Before designing IoT sensors, consider the most sophisticated sensing system ever evolved: human skin. Understanding nature’s solution provides profound insights for engineering better sensor systems.
NoteLessons from Biology
Your skin contains approximately 5 million sensors packed into just 2m^2 of “sensor array” that:
Detects pressure from 0.1g to 10kg (100,000x dynamic range)
Responds in 1-500ms (adapts to stimulus type)
Consumes only ~10mW total (incredible energy efficiency)
Self-heals and recalibrates continuously (no maintenance required)
This biological sensor network puts most IoT systems to shame in terms of efficiency, robustness, and adaptability.
533.3 Skin’s Multi-Scale Sensor Architecture
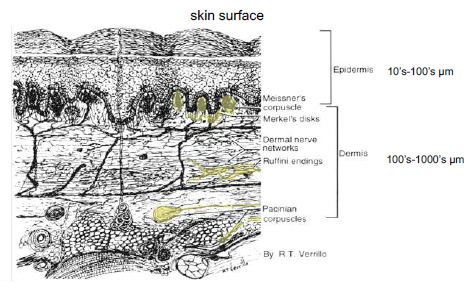
Human skin doesn’t rely on a single sensor type. Instead, it uses multiple specialized receptors working together–a principle directly applicable to IoT sensor design:
Figure 533.1: The five types of mechanoreceptors in human skin, each optimized for different sensing tasks
Mapping Biological Sensors to Engineering:
Skin Receptor
Sensation
Adaptation
Engineering Equivalent
Key Property
Merkel discs
Light touch, texture
Slow adapting
Strain gauge, pressure sensor
High spatial resolution (0.5mm)
Meissner corpuscles
Flutter, slip detection
Fast adapting
Vibration sensor (10-50 Hz)
Detects when objects slip from grasp
Pacinian corpuscles
Deep vibration
Very fast adapting
Accelerometer (50-500 Hz)
Maximum sensitivity at 200-300 Hz
Ruffini endings
Skin stretch, hand shape
Slow adapting
Strain sensor, force sensor
Directional sensitivity
Free nerve endings
Pain, temperature
Multi-modal
Thermistor, damage detector
Wide temperature range (-15C to 45C)
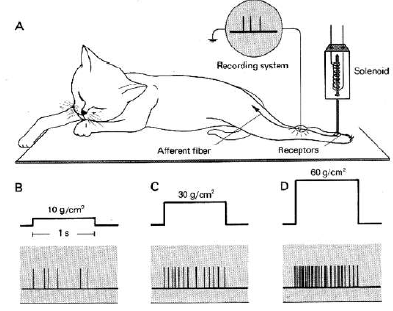
Figure 533.2: Slow adapting vs. fast adapting receptors: different sensors for static vs. dynamic conditions
533.4 Key Biomimetic Design Principles
Analyzing human skin reveals four critical principles for IoT sensor design:
533.4.1 Principle 1: Multi-Scale Sensing (Different Sensors for Different Scales)
Biological Insight: Skin uses different receptors for different frequency ranges (0.5 Hz to 500 Hz). No single receptor handles everything.
IoT Application: - Don’t use one sensor type for all conditions - Combine sensors with different response times: - Slow/static: Temperature (minutes), soil moisture (hours) - Medium/quasi-static: Vibration monitoring (1-10 Hz), door sensors - Fast/dynamic: Accelerometer (100+ Hz), acoustic sensors (kHz)
Real Example - Predictive Maintenance:
System combines:
- Temperature sensor (1 sample/min) for thermal drift
- Low-freq vibration (10 Hz) for bearing wear
- High-freq accelerometer (1000 Hz) for crack detection
533.4.2 Principle 2: Adaptive Response (Slow and Fast Adapting Sensors)
Biological Insight: Merkel discs (slow adapting) continuously report pressure, while Pacinian corpuscles (fast adapting) only respond to changes. This saves neural bandwidth.
IoT Application: - Use slow-adapting (DC-coupled) sensors for absolute measurements: - Room temperature, water level, battery voltage - Use fast-adapting (AC-coupled) sensors for change detection: - Motion sensors (PIR), vibration, acoustic events - Energy savings: Fast-adapting sensors can sleep between events
Code Example - Adaptive Sampling:
# Slow adapting: always measure absolute valuetemperature = read_thermistor() # DC-coupled, slow changing# Fast adapting: detect transitions onlyif motion_detected(): # AC-coupled, event-triggered wake_camera() stream_video()else: deep_sleep() # Save 99% power
Show code
{const container =document.getElementById('kc-sensor-adaptation');if (container &&typeof InlineKnowledgeCheck !=='undefined') { container.innerHTML=''; container.appendChild(InlineKnowledgeCheck.create({question:"A PIR (passive infrared) motion sensor only triggers when something moves - it doesn't report anything when the room is still. This is an example of which biological sensor type?",options: [ {text:"Slow adapting sensor (like Merkel discs)",correct:false,feedback:"Slow adapting sensors continuously report absolute values, like temperature sensors."}, {text:"Fast adapting sensor (like Pacinian corpuscles)",correct:true,feedback:"Fast adapting sensors only respond to changes/transitions, saving bandwidth and power."}, {text:"Multi-scale sensor",correct:false,feedback:"Multi-scale sensing uses different sensors for different frequency ranges."}, {text:"Redundant sensor",correct:false,feedback:"Redundancy refers to using multiple sensors for the same measurement."} ],explanation:"PIR sensors are fast adapting - they detect changes in infrared radiation (motion) but don't report a constant 'no motion' signal. This saves power because the sensor only 'wakes' the system when something interesting happens, just like Pacinian corpuscles in skin only respond to vibration changes.",difficulty:"medium",topic:"sensor-types" })); }}
533.4.3 Principle 3: Redundancy and Graceful Degradation
Biological Insight: Skin has overlapping sensor coverage. Damage to one receptor type doesn’t cause total failure.
IoT Application: - Sensor fusion: Combine multiple sensors for critical measurements - IMU = accelerometer + gyroscope + magnetometer - Indoor localization = Wi-Fi RSSI + BLE beacons + barometric altitude - Fail-safe design: System continues with reduced accuracy if one sensor fails
Real Example - Autonomous Vehicles:
Redundant perception:
- LiDAR (primary, 200m range, +/-2cm accuracy)
- Radar (backup, 250m range, +/-10cm, works in fog)
- Camera (context, color/sign detection)

If LiDAR fails -> reduce speed, continue with radar + camera
533.4.4 Principle 4: Hierarchical Processing (Edge Before Cloud)
Biological Insight: Significant signal processing occurs in nerve endings and spinal cord before reaching the brain. Only important signals trigger cortical attention.
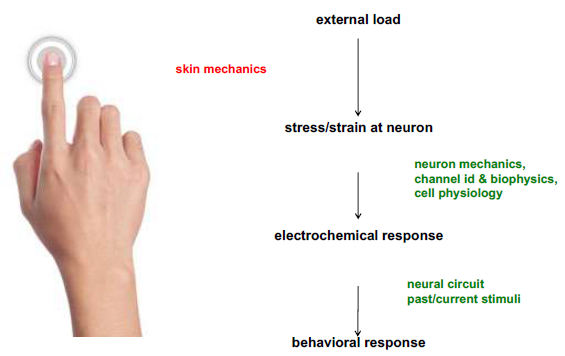
Figure 533.3: Hierarchical processing: both biological and IoT systems filter and process data at multiple levels
IoT Application: - Don’t send raw sensor data to cloud! Process locally: - Sensor level: Hardware filtering (RC circuits, op-amps) - Edge MCU: Thresholding, averaging, anomaly detection - Gateway: Data fusion, time-series compression - Cloud: Long-term analytics, model training
Quantified Impact - Smart Factory:
Raw sensor data: 1000 samples/sec x 100 sensors = 100,000 readings/sec
After edge processing:
- 95% filtered as "normal operation" (discard)
- 4% compressed (send averages every 10s)
- 1% anomalies (send immediately with context)

Result: 100,000 -> 150 messages/sec (99.85% reduction)
Bandwidth savings: $12,000/month -> $20/month
533.5 From Skin to IoT: A Practical Design Framework
Use these biomimetic principles when designing your next IoT sensor system:
%%{init: {'theme': 'base', 'themeVariables': {'primaryColor': '#2C3E50', 'primaryTextColor': '#fff', 'primaryBorderColor': '#16A085', 'lineColor': '#16A085', 'secondaryColor': '#E67E22', 'tertiaryColor': '#7F8C8D'}}}%%
block-beta
    columns 2

    block:BioTitle:1
        BT["BIOLOGICAL MODEL"]
    end
    block:IoTTitle:1
        IT["IoT IMPLEMENTATION"]
    end

    block:BioL1:1
        B1["PERCEPTION LAYER<br/>5 million receptors<br/>Multiple specialized types"]
    end
    block:IoTL1:1
        I1["SENSING LAYER<br/>Sensor array<br/>Multi-modal inputs"]
    end

    block:BioL2:1
        B2["LOCAL PROCESSING<br/>Spinal reflexes<br/>10ms latency"]
    end
    block:IoTL2:1
        I2["EDGE PROCESSING<br/>MCU filtering<br/><10ms response"]
    end

    block:BioL3:1
        B3["INTEGRATION LAYER<br/>Thalamus relay<br/>Pattern recognition"]
    end
    block:IoTL3:1
        I3["FOG/GATEWAY<br/>Data fusion<br/>Local ML inference"]
    end

    block:BioL4:1
        B4["CENTRAL PROCESSING<br/>Cortex analysis<br/>High-level decisions"]
    end
    block:IoTL4:1
        I4["CLOUD ANALYTICS<br/>Big data<br/>Model training"]
    end

    block:BioPower:1
        BP["Power: ~10mW total"]
    end
    block:IoTPower:1
        IP["Target: <100mW"]
    end

    style BT fill:#16A085,color:#fff
    style IT fill:#2C3E50,color:#fff
    style B1 fill:#a5d6a7
    style B2 fill:#81c784
    style B3 fill:#66bb6a
    style B4 fill:#4caf50
    style I1 fill:#90caf9
    style I2 fill:#64b5f6
    style I3 fill:#42a5f5
    style I4 fill:#2196f3
    style BP fill:#E67E22,color:#fff
    style IP fill:#E67E22,color:#fff
This layered view emphasizes the hierarchical processing architecture shared by biological and IoT sensing systems. Rather than showing the flow between components, this diagram highlights the functional equivalence at each layer: perception/sensing, local/edge processing, integration/fog, and central/cloud analytics. The key insight is that both systems minimize data transmission to higher layers by processing locally, with biology achieving remarkable 10mW efficiency that IoT systems strive to approach.
533.6 Biomimetic Design Checklist
Use this checklist when designing your sensor systems:
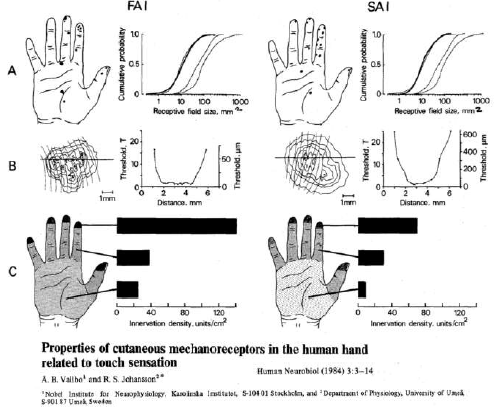
Figure 533.4: Receptor density in fingertips reaches 2,500 sensors/cm^2 – far denser than most IoT deployments
533.7 Summary: What Engineers Can Learn from Skin
The human skin sensor system represents 500 million years of evolutionary optimization. Key takeaways for IoT design:
No universal sensor: Use specialized sensors for different tasks (just like skin has 5+ receptor types)
Energy efficiency: Skin’s 10mW for 5M sensors proves hierarchical processing works
Adaptation matters: Fast-adapting sensors save bandwidth by reporting only changes
Redundancy is essential: Overlapping sensor coverage provides robustness
Process locally: Brain doesn’t analyze every nerve impulse; cloud shouldn’t analyze every sensor reading
533.8 Next Steps
Study sensor datasheets to understand their “adaptation type” (DC vs AC coupled)
Design multi-sensor fusion systems instead of relying on single sensors
Implement edge processing to filter data before transmission
Consider graceful degradation: what’s the backup if sensor X fails?
533.9 What’s Next
Now that you understand biomimetic sensing principles:
To understand specifications: Sensor Specifications - Accuracy, response time, and range explained
To learn signal processing: Signal Processing - Filtering and noise reduction
To see practical examples: Common IoT Sensors - Popular sensors and MEMS technology