105 IoT Systems Evolution: How Computing Power Enabled IoT
105.1 Learning Objectives
By the end of this chapter, you will be able to:
- Trace technology cycles: Understand the 10x growth pattern from mainframes to IoT
- Explain Moore’s Law and Dennard Scaling: Understand how physics enabled and then constrained computing
- Recognize the 2005 inflection point: Explain why distributed computing became economical
- Apply economic analysis: Evaluate IoT solutions based on computing economics
IoT Overview Series: - IoT Introduction - Getting started with IoT and the Five Verbs - Device Evolution - Embedded vs Connected vs IoT products - IoT History and Paradigm Shifts - Lessons from technology evolution - Industry 4.0 and Classification - Industrial IoT and device classification
Architecture Deep Dives: - Edge Computing - Edge computing patterns - Fog Computing - Fog computing fundamentals - Edge AI/ML - Machine learning at the edge
105.2 Evolution of Internet of Things Systems
The Internet of Things (IoT) has evolved through several distinct phases, reflecting the increasing interconnectedness of devices, people, and systems. Each phase represents a significant technological milestone in the journey from simple networks to fully integrated IoT ecosystems.
105.2.1 The 10x Technology Cycle Pattern
A remarkable pattern emerges when examining major computing technology cycles: each successive era brings approximately 10x more devices and users than the previous one. This exponential growth is driven by two consistent factors: lower prices and improved functionality.
Key insights from this growth trajectory:
- Mainframe Era (1960s): ~10^3 devices globally - room-sized computers costing $1M+, accessible only to governments and large corporations
- Personal Computer Era (1980s): ~10^6 devices - desktop machines at $2,000, bringing computing to businesses and homes (1,000x increase)
- Mobile Phone Era (2000s): ~10^9 devices - pocket-sized smartphones at $200, making connectivity ubiquitous (1,000x increase again)
- IoT Era (2030s projection): ~10^12 devices - embedded sensors at $2, connecting everything from light bulbs to industrial machinery (another 1,000x increase)
The Economics Driving This Growth:
Each 1,000x device increase correlates with approximately: - 100x cost reduction: $1M mainframe -> $10K PC -> $200 phone -> $2 sensor - 10x size reduction: Room -> Desktop -> Pocket -> Embedded (disappears into objects) - 10x functionality increase: Calculation -> Documents + Internet -> Apps + Camera -> AI + Sensing + Control
This exponential curve explains why IoT is not just “another technology” - it represents the continuation of a 70-year pattern where each decade brings computing to 10x more devices at 1/10th the cost.

Historical Technology Cycles and Scale:
| Era | Decade | Typical Units | Price Point | Key Innovation |
|---|---|---|---|---|
| Mainframe | 1960s | ~1 Million | $1M+ | Centralized computing for enterprises |
| Minicomputer | 1970s | ~10 Million | $100K | Departmental computing |
| Personal Computer | 1980s-90s | ~100 Million | $2-5K | Individual computing power |
| Desktop Internet | 1990s-2000s | ~1 Billion | $500-1K | Global information access |
| Mobile Internet | 2010s | ~5 Billion | $200-500 | Computing in your pocket |
| Internet of Things | 2020s-30s | ~20-40 Billion | $1-100 | Computing in everything |
1. Lower Price: Each cycle makes computing 10-100x cheaper per unit - Mainframe: $1M per computing unit - PC: $2,000 per computing unit - Smartphone: $200 per computing unit - IoT sensor: $1-10 per computing unit
2. Improved Functionality and Services: Each cycle enables new use cases - PCs enabled individual productivity - Internet enabled global communication - Mobile enabled always-on connectivity - IoT enables ambient intelligence in physical environments
IoT is the logical continuation of this pattern - bringing computation to the remaining 99% of physical objects that were previously “dumb.”
Core Concept: IoT transforms one-time product sales into ongoing service relationships. The device is the “foot in the door” - the real value comes from data analytics, predictive insights, and ecosystem integration that generate 5-9x higher lifetime customer value.
Why It Matters: 90% of IoT value comes from analytics and services, not just connectivity. A connected device without compelling data insights is just a gadget with Wi-Fi. Business models must capture value from data generated over years of device operation.
Key Takeaway: When evaluating IoT opportunities, ask: “What recurring value does the data enable?” not just “Can we connect this device?” Success requires both compelling hardware AND sustainable data-driven services.
105.2.2 Real-World Impact: IoT Market Growth and Economic Value
Global IoT Deployment Statistics (2025):
Market Size and Growth: - $1.5 trillion global IoT market value (2025) - 18-21 billion connected IoT devices deployed worldwide (IoT Analytics/Statista 2025) - 14% YoY growth in IoT connections (IoT Analytics 2025) - $11 trillion projected economic value by 2030 (McKinsey Global Institute) - 40+ billion IoT devices projected by 2034 (Statista)
Industry-Specific Adoption Rates: - Manufacturing: 87% of enterprises use IoT for predictive maintenance (Gartner) - Healthcare: 64% of providers deploy remote patient monitoring (Deloitte) - Agriculture: 60% of commercial farms use precision farming IoT (USDA) - Energy: 73% of utilities implement smart grid IoT solutions (IEA)
Quantified Business Benefits: - 25-40% reduction in equipment downtime with predictive maintenance - 30% average energy savings in IoT-enabled smart buildings - $200 billion annual cost savings in manufacturing through IIoT (Industrial IoT) - 50% reduction in water waste with smart irrigation systems - 20-30% improvement in supply chain efficiency with IoT tracking
Real Company Examples: - Amazon: 200,000+ IoT-enabled robots in fulfillment centers, processing 5 billion items annually - John Deere: 1.5 million connected tractors, generating $3 billion in precision agriculture revenue - Philips Healthcare: 15 million connected medical devices, improving patient outcomes by 18% - Nest (Google): 40 million smart thermostats deployed, saving users $2.8 billion in energy costs
Core Concept: IoT devices create billions of attack surfaces - each connected device is a potential entry point for attackers. IoT security differs from IT security because devices are often physically accessible, resource-constrained (cannot run antivirus), and deployed for 10-20 years without patches.
Why It Matters: IoT breaches cost an average of $3.86 million. Unlike IT systems where data theft is the primary concern, IoT attacks can cause physical harm (hijacked cars, disabled medical devices, disrupted power grids). Security must be designed in from day one.
Key Takeaway: Defense-in-depth is essential: encryption + authentication + network segmentation + secure boot + regular updates. No single security measure is sufficient. Assume every device will be attacked and design accordingly.
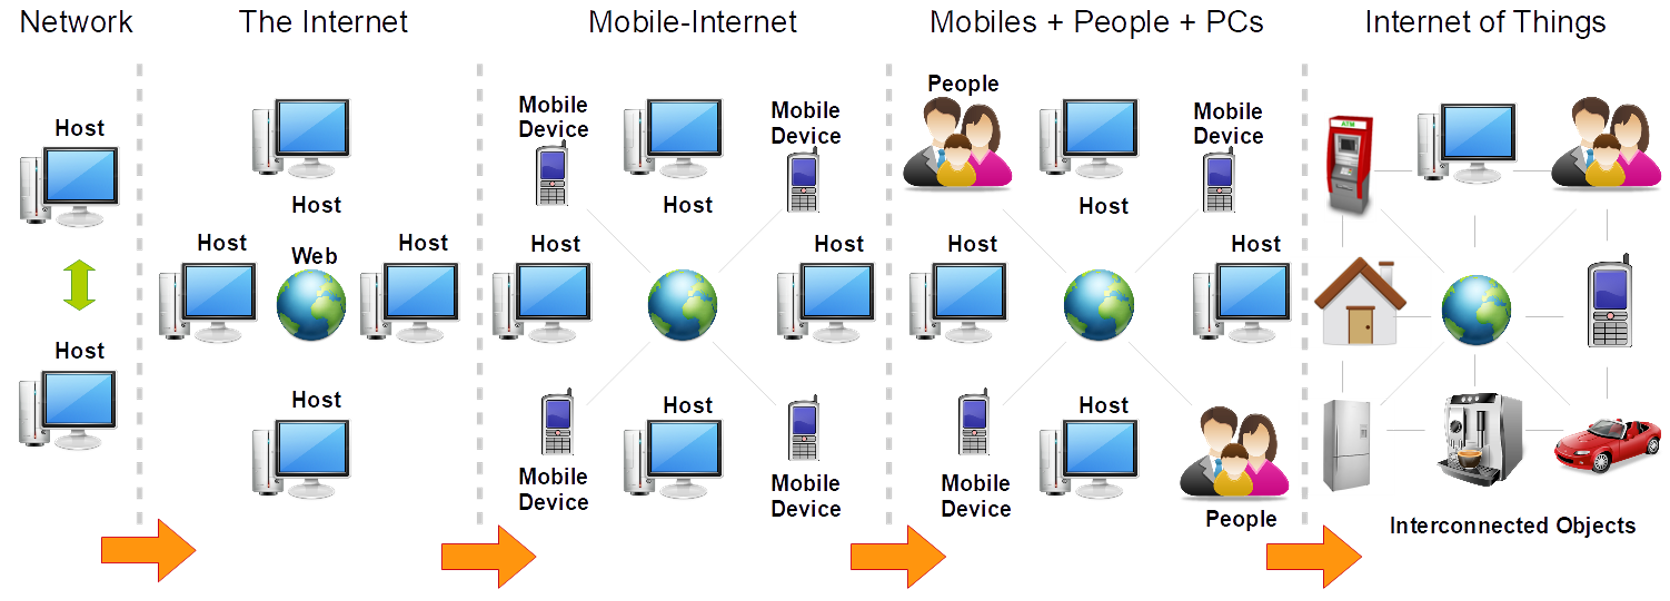
105.2.3 Five Phases of IoT Evolution
- Network:
- The initial phase involved connecting two or more computers to form basic networks, allowing direct communication between hosts.
- The Internet:
- The introduction of the World Wide Web connected large numbers of computers globally, enabling unprecedented access to information and services.
- Mobile-Internet:
- With the proliferation of mobile devices, the internet expanded to include connectivity for smartphones, enabling users to remain online from anywhere.
- Mobiles + People + PCs:
- This phase marked the integration of people into the internet via social networks and connected devices, blending the digital and social realms.
- Internet of Things:
- The current stage involves connecting everyday objects to the internet, transforming them into interconnected devices capable of communicating with each other and their environments.
IoT Evolution Timeline:
| Era | Year | Milestone | Key Developments |
|---|---|---|---|
| Network Era | 1969 | ARPANET | TCP/IP established, 2-4 computers, Military/academic use |
| Internet Era | 1991 | World Wide Web | HTTP/HTML standards, Millions of PCs, E-commerce emerges |
| 1999 | IoT Term Coined | Kevin Ashton names “IoT”, RFID supply chains, Early M2M | |
| Mobile Internet | 2007 | iPhone Launch | 3G/4G networks, Mobile apps ecosystem, Smartphones ubiquitous |
| IoT Mainstream | 2010 | Mass Adoption | 12.5B devices, Smart home, Industrial IoT, Cloud platforms |
| Industry 4.0 | 2014 | AI Integration | AI/ML integration, Edge computing, 5G deployment begins |
| Pervasive IoT | 2020+ | Billions of Devices | 75B+ forecast, Edge AI at scale, Digital twins, Autonomous systems |
105.3 How Computing Evolution Enabled IoT
The exponential growth in computing power is not just a technical curiosity - it represents the fundamental economic shift that made IoT possible. Understanding why computing evolved from expensive centralized mainframes to cheap distributed edge devices reveals why IoT emerged when it did, and why it couldn’t have happened earlier.
105.3.1 The Historical Context: Two Laws That Shaped Computing
Moore’s Law (1965): The Transistor Doubling
In 1965, Intel co-founder Gordon Moore observed that the number of transistors on a microchip doubles approximately every two years. This observation, known as Moore’s Law, has held remarkably true for over 50 years:
- 1971: Intel 4004 processor had 2,300 transistors
- 1995: Intel Pentium Pro had 5.5 million transistors (2,391x increase)
- 2005: Intel Pentium D had 1.7 billion transistors (739,130x increase)
- 2020: Apple M1 chip has 16 billion transistors (6,956,522x increase)
Dennard Scaling (1974-2005): The Power Efficiency Era
In 1974, Robert Dennard discovered that as transistors shrink, their power density stays roughly constant. This meant:
- Smaller transistors = Same power per unit area
- More transistors = Same total power consumption
- Result: Processors could get faster without overheating
This virtuous cycle enabled dramatic clock speed increases:
- 1980s: Processors ran at 1-10 MHz
- 1990s: Speeds reached 100-500 MHz
- 2000-2005: Speeds hit 3-4 GHz
105.3.2 The 2005 Inflection Point: Why Everything Changed
Around 2005, Dennard Scaling broke down. Physics caught up with engineering:
The Heat Wall Problem:
- Transistors became so small (~65nm) that leakage current created excessive heat
- Power density approached that of a nuclear reactor core (~100 W/cm^2)
- Clock speeds plateaued at ~3.8-4 GHz and have barely increased since
The Fundamental Shift:
| Era | Strategy | Focus | Example |
|---|---|---|---|
| Pre-2005 | Faster single processors | Centralized computing | Increase clock speed from 1 GHz -> 4 GHz |
| Post-2005 | More processors | Distributed computing | Add 2, 4, 8, 16+ cores at same speed |
This shift from “faster processors” to “more processors” fundamentally enabled IoT by making it economical to distribute computing power everywhere rather than centralizing it.
105.3.3 Why This Matters for IoT: The Economics of Distributed Computing
Before 2005: Centralization Was Optimal
When single-core performance was still improving rapidly (30-40% per year), it made economic sense to:
- Build faster central servers for data processing
- Keep devices simple and dumb (just sensors sending data)
- Process everything in data centers with the fastest CPUs
After 2005: Distribution Became Optimal
When single-core performance plateaued, chip manufacturers pivoted to:
- Multi-core processors: 2, 4, 8, 16+ cores on a single chip
- Specialized accelerators: GPUs for graphics, NPUs for AI
- Energy efficiency: Focus on performance-per-watt instead of raw speed
This created the economic conditions for IoT:
1. Cheap, Powerful Microcontrollers
| Microcontroller | Year | Price | Capabilities |
|---|---|---|---|
| Intel 8051 | 1980 | $5-10 | 8-bit, 12 MHz, no networking |
| ARM Cortex-M0 | 2009 | $0.50-1 | 32-bit, 48 MHz, low power |
| ESP32 | 2016 | $2-4 | Dual-core 240 MHz, Wi-Fi/Bluetooth, 520KB RAM |
| Raspberry Pi Pico | 2021 | $4 | Dual-core 133 MHz, 264KB RAM, extensive I/O |
Today’s $0.50 microcontroller has more computing power than a $10,000 desktop computer from 1995.
2. AI at the Edge
The proliferation of specialized neural network accelerators makes on-device AI feasible:
- Google Coral Edge TPU: 4 trillion operations/sec, $25, 2W power
- NVIDIA Jetson Nano: 472 GFLOPS, $99, 5-10W power
- Apple Neural Engine: 15.8 trillion ops/sec, integrated in phones
Real Impact: A security camera can now run face detection locally at 30 fps instead of streaming video to the cloud (99.9% bandwidth reduction).
3. Sensor Fusion on Device
Modern IoT devices can fuse data from multiple sensors in real-time:
- Smartphones: 24+ sensors (accelerometer, gyroscope, magnetometer, GPS, barometer, light, proximity, etc.)
- Drones: IMU (9-axis), GPS, ultrasonic, optical flow, cameras - all fused for stable flight
- Wearables: Heart rate, ECG, SpO2, temperature, accelerometer combined for health insights
4. Fog Computing Architecture
The abundance of cheap computing enables hierarchical processing:
- Device layer: Immediate response (sensor -> actuator in <10ms)
- Edge layer: Local analytics (factory floor aggregation)
- Fog layer: Regional processing (city-wide traffic optimization)
- Cloud layer: Long-term storage and complex AI training
105.3.4 Key Data Points: The Computing Power Revolution
Impact on IoT Economics:
| Metric | 2005 | 2025 | Change |
|---|---|---|---|
| Microcontroller cost | $5-10 | $0.50-2 | 10x cheaper |
| Microcontroller power | 100 mW typical | 5 mW sleep, 50 mW active | 20x more efficient |
| Wireless module cost | $50-100 | $2-5 | 20x cheaper |
| Cloud storage cost | $1/GB/month | $0.01/GB/month | 100x cheaper |
| Sensor cost | $10-50 | $0.20-2 | 25x cheaper |
Result: The total cost of an IoT device dropped from ~$200+ (2005) to ~$5-20 (2025), making it economical to connect billions of everyday objects.

105.3.5 Why Distributed Computing Enabled IoT
Real-World Example: Smart Factory Comparison
Centralized Approach (Pre-2005 Economics):
- 1,000 sensors -> Central server processes all data -> Actuators respond
- Latency: 100-500ms (sensor -> cloud -> actuator)
- Bandwidth: 1 Gbps fiber needed for real-time data
- Single point of failure: Server down = factory stops
- Cost: $100K server + $50K/year bandwidth
Distributed IoT Approach (Post-2005 Economics):
- 1,000 smart sensors with $2 microcontrollers -> Local edge processing -> Immediate actuation
- Latency: 1-10ms (sensor -> edge -> actuator)
- Bandwidth: 10 Mbps (only aggregate data to cloud)
- Resilient: Local loops continue if cloud fails
- Cost: $2K in microcontrollers + $1K/year bandwidth
Savings: $147K upfront + $49K/year by distributing computing to edge devices
105.3.6 The Three Enablers of Modern IoT
1. Abundant Cheap Computing
- Moore’s Law continues (transistor count still doubling)
- Focus shifted from speed to efficiency and specialization
- $0.50 microcontrollers rival 1990s desktops
2. Energy Efficiency Revolution
- Performance-per-watt improved 100x from 2005-2025
- Battery-powered devices can run for years
- Energy harvesting becomes viable for some applications
3. Specialized Accelerators
- Neural network accelerators: AI on $25 chips
- Cryptographic engines: Secure communication with minimal overhead
- Radio modules: Wi-Fi/Bluetooth/LoRa on single chip
Result: The economic viability of putting intelligent, networked computing into every device - from light bulbs to industrial pumps - that defines the IoT revolution.
Why IoT emerged around 2010-2015 and not earlier:
- Before 2005: Centralized computing was still improving fast enough to remain the economical choice
- 2005-2010: Industry transitioned from single-core speed to multi-core efficiency
- 2010-2015: Cheap ARM processors + Wi-Fi modules reached cost parity with “dumb” devices
- 2015+: Edge AI accelerators enabled on-device intelligence at scale
The Timeline Wasn’t Arbitrary: IoT required the post-Dennard Scaling economics where distributing computation became cheaper than centralizing it. The 2005 inflection point was the technical prerequisite; the 2010-2015 period was when costs dropped enough for mass adoption.
Example: A $4 ESP32 microcontroller (2016) would have cost $400+ in 2005 dollars and $40,000+ in 1995 dollars for equivalent capabilities. IoT only became economically viable when Moore’s Law (still continuing) + post-Dennard efficiency focus + specialized wireless chips brought costs down 10,000x.
105.3.7 Connecting to IoT Architecture
This computing evolution directly enables the architectural patterns you’ll study later in this book:
- Edge Computing: Only viable when edge nodes have sufficient computing power
- Fog Computing: Hierarchical processing requires powerful intermediate nodes
- Edge AI/ML: Requires specialized neural accelerators now available in $25 chips
- Wireless Sensor Networks: Nodes need computation for routing, data fusion, and coordination
Without the 2005 Dennard Scaling breakdown and subsequent pivot to distributed computing, IoT would still be “sensors sending data to central servers” - not the intelligent, autonomous edge devices that define modern IoT.
105.4 Summary
In this chapter, you learned:
- Technology cycles follow a 10x pattern - each era brings 10x more devices at 1/10th the cost
- Moore’s Law continues (transistor doubling) but Dennard Scaling broke down in 2005
- The 2005 inflection point shifted economics from centralized to distributed computing
- IoT economics enable $5-20 devices that would have cost $200+ in 2005
- Edge computing became viable when microcontrollers rivaled 1990s desktops
- IoT couldn’t have happened earlier - it required specific economic conditions
105.5 What’s Next?
Continue to Industry 4.0 and Device Classification to understand how IoT drives the Fourth Industrial Revolution and how to classify IoT devices.