523 Sensor Applications Overview
IoT Sensor Domains and Use Cases
523.1 Learning Objectives
By the end of this chapter, you will be able to:
- Identify Sensor Applications by Domain: Recognize how sensors are deployed across smart cities, healthcare, agriculture, and industrial IoT
- Match Sensors to Use Cases: Select appropriate sensor types for specific application requirements
- Analyze Sensor Data Requirements: Determine sampling rates, accuracy, and data formats for different applications
- Understand Domain-Specific Sensor Requirements: Know which sensors are used in each major IoT domain
- Evaluate Application Criticality: Understand how safety-critical vs. informational applications differ in sensor requirements
Core concept: Different IoT application domains (smart cities, agriculture, healthcare, industry) require specific sensor types matched to their unique environmental conditions and measurement needs. Why it matters: Choosing the wrong sensor for an application wastes money, produces unreliable data, and can cause system failures - a $5 humidity sensor in a greenhouse will fail within months if not rated for condensation. Key takeaway: Always match sensor specifications (range, accuracy, environment rating, power budget) to your specific deployment conditions before purchasing or designing.
Sensing Topics: - Sensor Fundamentals and Types - Sensor categories and selection - Sensor Circuits and Signals - Signal conditioning - Actuators - Output devices
Related Architecture: - Sensing as a Service - Cloud-connected sensing - WSN Overview - Wireless sensor networks
In This Series: - Sensor Selection Wizard - Interactive tool for choosing sensors - Sensor Application Architecture - Diagrams and data flow - Sensor Application Labs - Hands-on exercises
Learning Hubs: - Simulation Playground - Sensor simulators - Quiz Navigator - Sensing quizzes - Video Gallery - Sensor demos
523.2 Prerequisites
Before diving into this chapter, you should be familiar with:
- Sensor Fundamentals and Types: Understanding basic sensor principles, measurement types, and sensor categories is essential for evaluating which sensors fit specific application requirements
- IoT Reference Models: Knowledge of IoT system architecture (perception layer, network layer, application layer) helps you understand where sensors fit in the overall system and how sensor data flows through the architecture
- Electricity Fundamentals: Basic understanding of voltage, current, and power consumption is necessary for evaluating sensor power budgets and deployment feasibility in battery-powered applications
The Sensing and Actuation part moves from high-level applications to sensor physics, then to interfacing and finally to actuators and special cases:
- Start with this chapter, Sensor Applications Overview, to see the real-world problems sensors solve across domains (cities, agriculture, industry, health, homes).
- Then study the underlying building blocks in:
- Next, explore how systems act on sensor data in Actuators and related chapters such as Mobile Phone as a Sensor.
- Finally, connect these ideas to cross-cutting topics like energy budgets and analog/digital electronics for practical implementations.
If you are just getting started, a smooth path is: 1. Applications of Sensors -> Sensor Fundamentals and Types 2. Sensor Circuits/Interfacing -> Actuators -> Mobile Phone as a Sensor You can return to this roadmap whenever you want to check where a sensing or actuation chapter sits in the overall flow.
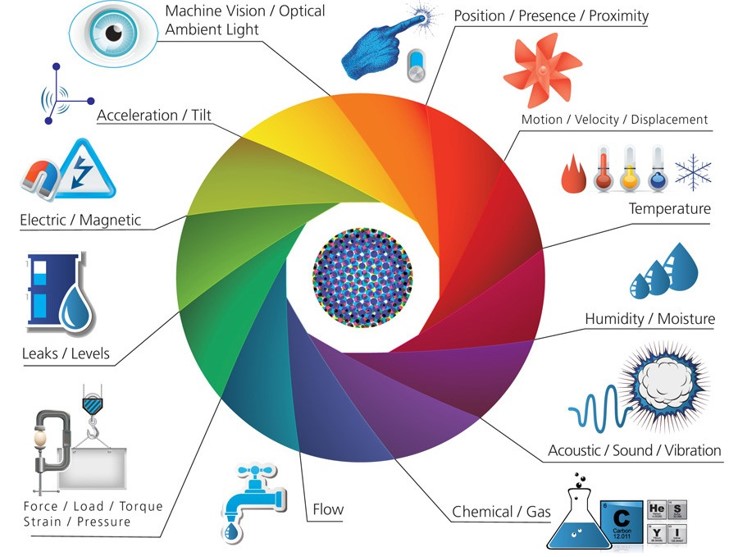
Sensors are the fundamental building blocks of Internet of Things (IoT) systems, serving as the interface between the physical and digital worlds. They enable IoT devices to perceive and measure physical phenomena, converting them into electrical signals that can be processed, analyzed, and acted upon. This chapter explores the diverse applications of sensors across various domains, demonstrating how they enable smart, connected solutions that improve efficiency, safety, and quality of life.

523.3 Getting Started (For Beginners)
If you’re wondering how sensors are actually used in the real world, this section will help you understand with simple examples before diving into technical details.
523.3.1 What Are Sensor Applications in Simple Terms?
Analogy: Think of sensors as the “senses” of smart devices - just like you use your eyes to see, ears to hear, and skin to feel temperature.
- Your smartphone uses sensors constantly: accelerometer (knows when you rotate the phone), GPS (knows where you are), light sensor (dims screen in dark), proximity sensor (turns off screen during calls)
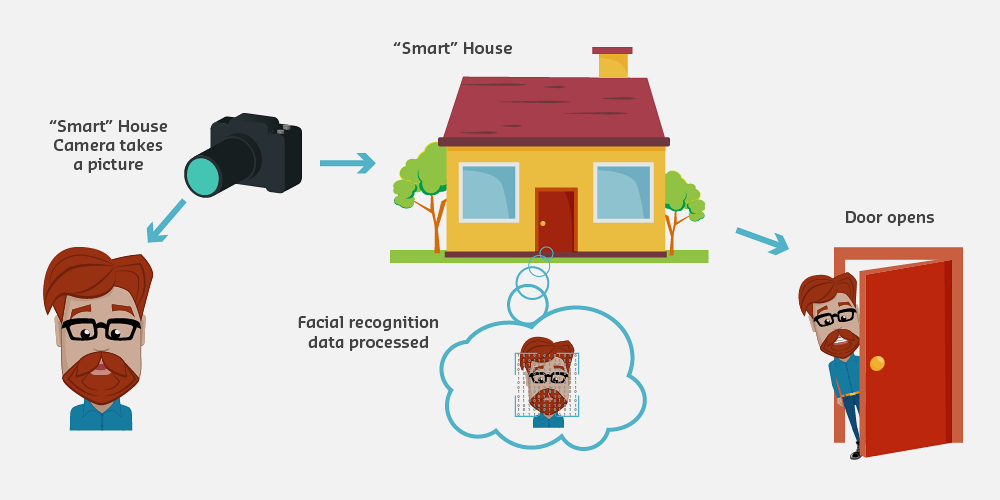
- A smart home uses motion sensors (detect if you’re home), temperature sensors (control heating), door sensors (security)
- Smart cities use thousands of sensors: parking sensors (find empty spots), air quality sensors (monitor pollution), traffic sensors (optimize lights)
523.3.2 Why Do We Need So Many Sensor Applications?
The Problem: Cities waste $millions on inefficient operations (trash trucks driving to empty bins, streetlights on during day, emergency response delays). Farms lose crops to undetected problems. Buildings waste energy heating empty rooms.
The Solution: Sensors provide real-time awareness! Now cities only collect full trash bins (saving fuel), lights dim when nobody’s around (saving energy), and farmers get alerts when crops need water (preventing losses).
523.3.3 Real-World Example: Smart Parking
Imagine you’re driving downtown looking for parking…
Without Sensors (Traditional): 1. Drive around for 15 minutes wasting gas 2. Finally find a spot 3 blocks away 3. Walk back to destination 4. City has no idea how many spots are available
With Sensors (Smart Parking): 1. Magnetic sensors in each parking space detect cars 2. App shows you nearest empty spot in real-time 3. Drive directly there (2 minutes, not 15!) 4. City collects data: “Downtown 85% full at 2pm”
Impact: San Francisco saved drivers 30,000 hours/year and reduced parking-related traffic by 30% with smart parking sensors!
523.3.4 The 12 Domains Where Sensors Make a Difference
This series covers 61 specific applications across 12 major domains:
- Smart Cities - Parking, traffic, lighting, waste (saves city budgets)
- Smart Environment - Air quality, fire detection, earthquake (protects nature and people)
- Smart Water - Quality monitoring, leak detection, flood warnings (saves water, prevents disasters)
- Smart Metering - Electricity, water, gas usage (helps you save money)
- Smart Security - Access control, radiation, hazardous gas detection (keeps people safe)
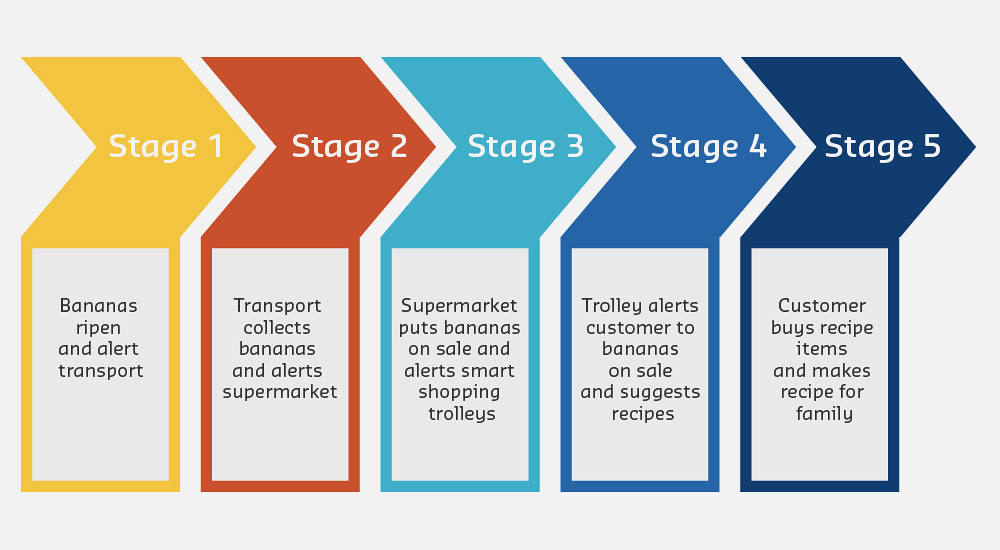
- Smart Retail - Inventory tracking, NFC payment (better shopping experience)
- Smart Logistics - Package tracking, shipment conditions (products arrive safely)
- Smart Industrial - Machine monitoring, air quality (safer factories, less downtime)
- Smart Agriculture - Soil moisture, weather stations (better crops, less water waste)
- Smart Farming - Animal tracking, barn air quality (healthier livestock)
- Smart Home - Energy monitoring, security, automation (comfort and savings)
- Smart Health - Fall detection, vital signs, fitness (better healthcare)
Before adding new sensors, consider what’s already there:
| Existing Infrastructure | Sensing Opportunity | Example Application |
|---|---|---|
| Wi-Fi routers | Channel State Information (CSI) | Occupancy, gesture recognition |
| Power lines | Non-Intrusive Load Monitoring | Appliance identification |
| LED lighting | Visible Light Positioning | Indoor navigation |
| HVAC ducts | Airflow patterns | Air quality distribution |
| Water pipes | Acoustic/pressure sensing | Leak detection, usage |
| Building structure | Vibration sensing | Structural health, footsteps |
Benefits of leveraging infrastructure: - Cost: No new hardware deployment - Coverage: Existing infrastructure already everywhere - Privacy: Often more privacy-preserving than cameras - Maintenance: Uses already-maintained systems
Principle: “Don’t add sensors - leverage what’s already there.”
523.3.5 Key Terms You’ll See
- Sensor: A device that measures something (temperature, motion, light, etc.)
- Application: A specific use case (e.g., “smart parking” is an application)
- Domain: A category of related applications (e.g., “Smart Cities” includes parking, lighting, traffic)
- Deployment: Installing and setting up sensors in the real world
- Sampling Rate: How often a sensor takes measurements (once per second = 1 Hz)
- Coverage: The area one sensor can monitor effectively
- Multi-sensor Fusion: Combining data from multiple sensor types for smarter decisions
523.3.6 Before You Continue
Make sure you’re familiar with: - Basic sensor concepts (what sensors measure) - Sensor types (temperature, motion, light, etc.) - Basic IoT architecture (sensors -> gateway -> cloud -> application)
Can you name 3 sensors your smartphone uses? Try it!
Answer: Most smartphones have 10+ sensors! Common ones: accelerometer (detects rotation/tilt), gyroscope (detects orientation), proximity (detects when near your ear), ambient light (auto-brightness), GPS (location), microphone (sound/voice), camera (images), compass (direction).
The Myth: Many beginners believe that deploying more sensors always leads to better data quality and system performance.
The Reality: Over-deployment creates diminishing returns and can actually harm system performance.
Real-World Example: Barcelona Smart City Air Quality Network
Barcelona initially deployed air quality sensors at a density of 1 sensor per 0.25 km (400 sensors for 100 km city area). After 2 years of operation, analysis showed:
- Redundant Data: 40% of sensors provided duplicate information due to overlapping coverage
- Network Congestion: With 400 sensors reporting every 60 seconds, the LoRaWAN network experienced 15% packet loss during peak hours
- Maintenance Burden: Annual maintenance costs reached 280,000 ($300,000) - far exceeding initial budget estimates
- Power Management: Battery replacements required every 2.3 years instead of the projected 5 years due to frequent transmissions
The Fix: Barcelona optimized to 1 sensor per 1 km (100 sensors total): - Maintained 95% coverage of pollution hotspots using strategic placement - Reduced network congestion to <2% packet loss - Cut annual costs by 68% (from 280k to 90k) - Extended battery life to 4.8 years with reduced transmission frequency
Key Lessons: 1. Coverage is not Quantity: Smart placement with fewer sensors often beats dense random deployment 2. Network Capacity: More sensors = more network traffic = higher infrastructure costs 3. Total Cost of Ownership: Each sensor incurs hardware ($50-150), installation ($50-100), and annual maintenance ($15-30) costs 4. Data Quality vs. Volume: 100 well-calibrated sensors beat 400 poorly maintained ones 5. Power Budget: Transmission frequency directly impacts battery life - optimize sampling rates
Optimal Sensor Density Guidelines: | Application | Recommended Density | Why? | |————-|——————-|——| | Smart Parking | 1 sensor per space | Binary state (occupied/empty) needs 1:1 coverage | | Air Quality | 1 sensor per 1-2 km | Pollutants diffuse over large areas, high overlap possible | | Soil Moisture | 1 sensor per 5-10 hectares | Soil conditions relatively uniform across fields | | Temperature (Indoor) | 1 sensor per 100-200 m | Temperature gradients predictable in buildings | | Vibration (Industrial) | 1 sensor per machine | Machine-specific data, no cross-machine correlation |
Bottom Line: Start with minimum viable coverage, validate with data, then expand strategically. Over-deployment wastes money and creates maintenance nightmares.
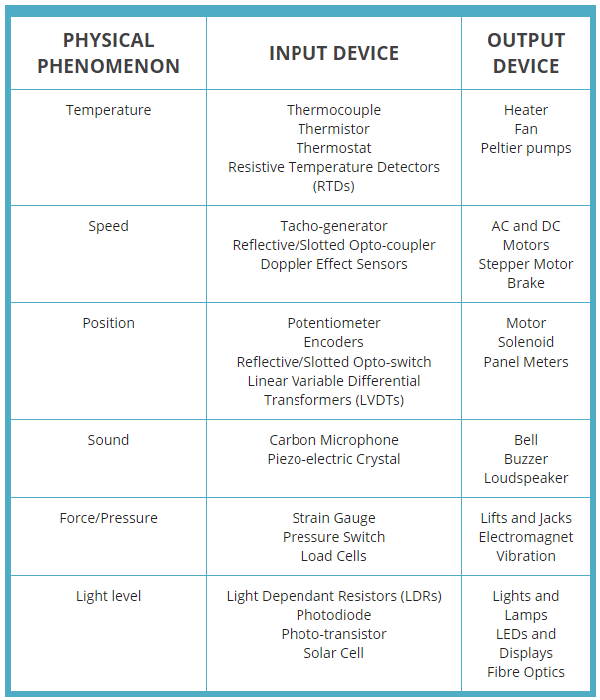
- Transducer: Device that converts physical phenomena into electrical signals for measurement and monitoring
- Multi-sensor Fusion: Combining data from multiple sensor types for comprehensive environmental awareness
- Real-time Monitoring: Continuous data collection enabling immediate awareness and response to changes
- Spatial Coverage: Distributed sensor networks providing comprehensive monitoring across large areas
- Deployment Scale: Range from small local installations to city-wide networks with thousands of sensors
- Power Budget: Total energy consumption planning for battery-powered and energy-harvesting sensor nodes
523.4 Overview of Sensor Applications
The Internet of Things has transformed how we interact with our environment by deploying sensors across virtually every domain of human activity. From monitoring air quality in cities to tracking livestock health on farms, sensors provide the real-time data that powers intelligent decision-making.
523.4.1 Key Characteristics of IoT Sensor Applications
1. Real-time Monitoring: Sensors continuously collect data, enabling immediate awareness of environmental conditions or system states.
2. Spatial Coverage: Networks of distributed sensors provide comprehensive coverage of large areas (cities, farms, forests) or complex systems (buildings, industrial facilities).
3. Multi-sensor Fusion: Many applications combine data from multiple sensor types to gain holistic understanding (e.g., combining temperature, humidity, and CO2 for air quality).
4. Actionable Intelligence: Sensor data drives automated responses (actuators) or informs human decision-making through analytics and visualization.
5. Cost-Effectiveness: Modern sensor technology enables deployment at scale, with decreasing costs making widespread sensing economically viable.
523.4.2 Sensor Application Domains
This chapter series organizes sensor applications into 12 major domains, covering 61 specific use cases:
- Smart Cities (9 applications): Urban infrastructure and services
- Smart Environment (5 applications): Natural environment monitoring
- Smart Water (6 applications): Water quality and management
- Smart Metering (5 applications): Resource consumption monitoring
- Smart Security (4 applications): Safety and emergency services
- Smart Retail (4 applications): Commerce and shopping
- Smart Logistics (4 applications): Transportation and supply chain
- Smart Industrial (6 applications): Manufacturing and industrial control
- Smart Agriculture (7 applications): Crop and soil management
- Smart Animal Farming (3 applications): Livestock monitoring
- Smart Home (4 applications): Residential automation
- Smart Health (5 applications): Healthcare and wellness
Each domain demonstrates unique sensor requirements, deployment challenges, and value propositions.
523.5 Smart Cities
| No. | Application | Sensors Integrated |
|---|---|---|
| 01 | Smart Parking | Magnetic field |
| 02 | Structural Health | Crack detection, crack propagation, accelerometer, linear displacement |
| 03 | Noise Urban Maps | Microphone (dBSPLA) |
| 04 | Smartphones Detection | Wi-Fi and Bluetooth radio scanner |
| 05 | Electromagnetic Field Levels | Electromagnetic field sensor |
| 06 | Traffic Congestion | Magnetic field |
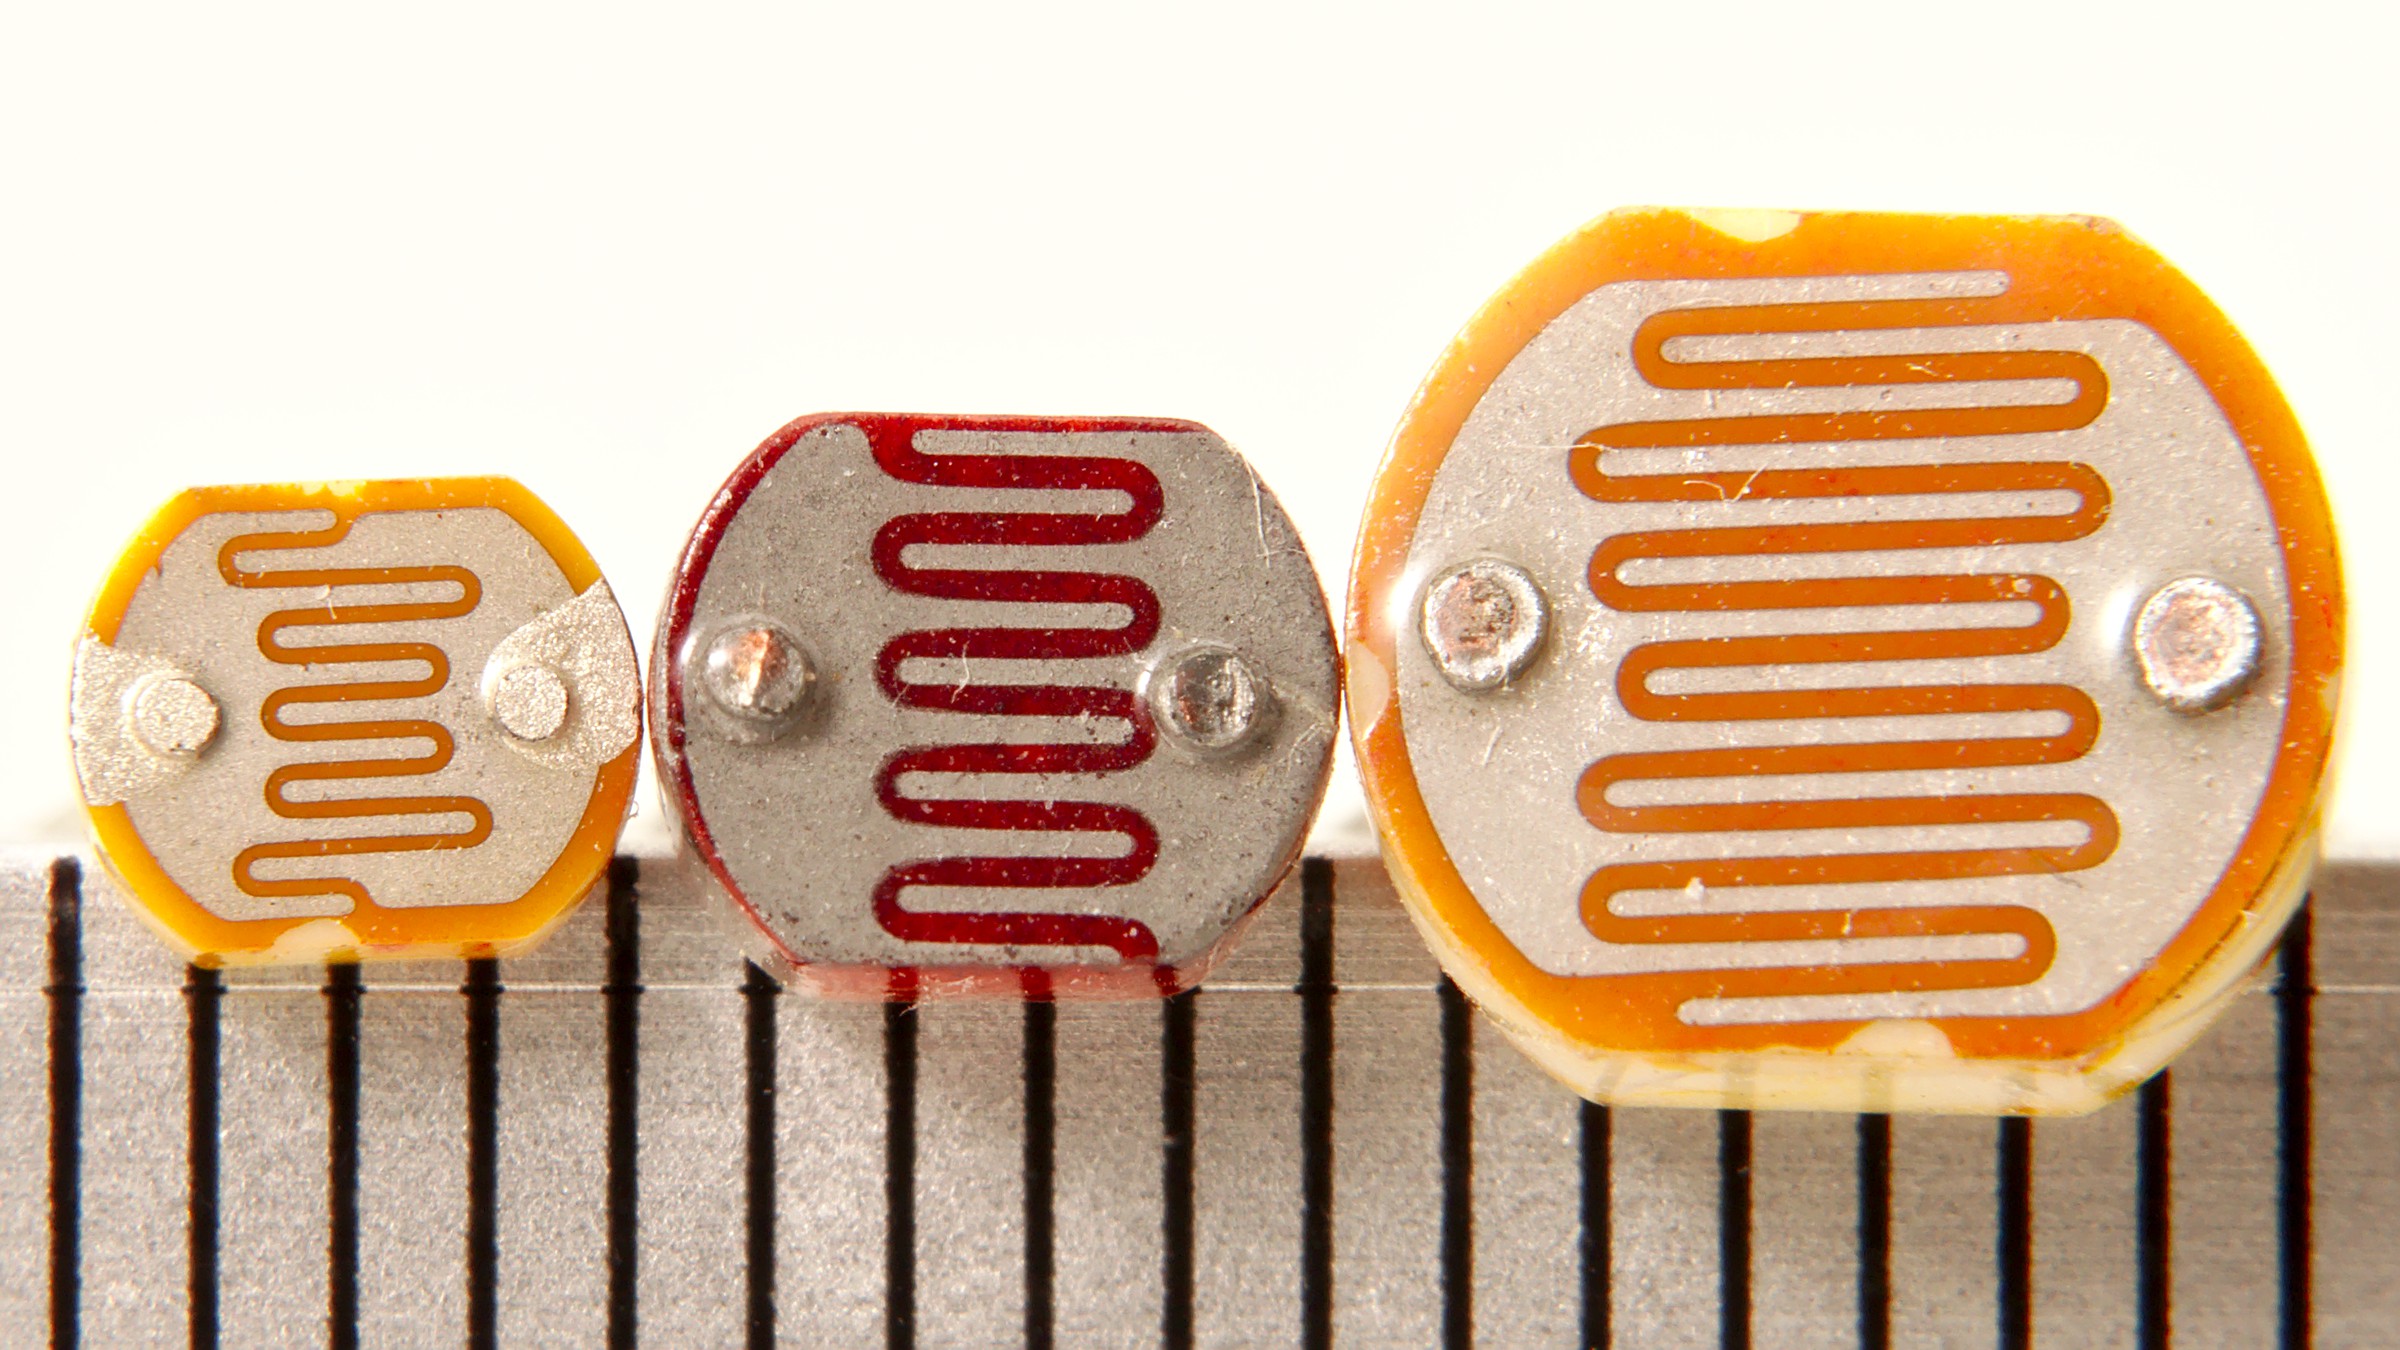
| 07 | Smart Lighting | Light sensor (LDR), actuator relay |
| 08 | Waste Management | Ultrasound sensor (measures capacity) |
| 09 | Smart Roads | Magnetic field, crack sensor, water and ice detection sensors |
523.6 Smart Environment
| No. | Application | Sensors Integrated |
|---|---|---|
| 10 | Forest Fire Detection | CO, CO2, temperature, humidity |
| 11 | Air Pollution | NO2, SH2, CO, CO2, Hydrocarbons, Methane (CH4) |
| 12 | Snow Level Monitoring | Ultrasounds |
| 13 | Landslide and Avalanche Prevention | Crack detection, crack propagation, accelerometer, linear displacement, soil moisture |
| 14 | Earthquake Early Detection | Accelerometer |
523.7 Smart Water
| No. | Application | Sensors Integrated |
|---|---|---|
| 15 | Potable Water Monitoring | pH, ORP, Dissolved Oxygen (DO), Nitrates, Phosphates |
| 16 | Chemical Leakage Detection in Rivers | Extreme pH values (signal chemical spills), Dissolved Oxygen (DO) |
| 17 | Swimming Pool Remote Measurement | pH, Oxidation-Reduction Potential (ORP) |
| 18 | Pollution Levels in the Sea | Temperature, Conductivity (Salinity), pH, Dissolved Oxygen (DO), Nitrates |
| 19 | Water Leakages | Liquid flow sensor |
| 20 | River Floods | Level sensor (switch), ultrasound sensor |
523.8 Smart Metering
| No. | Application | Sensors Integrated |
|---|---|---|
| 21 | Smart Grid | Current and voltage sensors |
| 22 | Tank Level | Level sensor (switch), ultrasound sensor (capacity measurement) |
| 23 | Photovoltaic Installations | Current and voltage sensors |
| 24 | Water Flow | Liquid flow sensor |
| 25 | Silos Stock Calculation | Ultrasound sensor (capacity measurement), load cells |
523.9 Smart Security and Emergency Services
| No. | Application | Sensors Integrated |
|---|---|---|
| 26 | Perimeter Access Control | PIR (infrared), hall effect (windows, doors), RFID and NFC tags |
| 27 | Liquid Presence | Water detection sensor |
| 28 | Radiation Levels | Geiger-Muller tube (Beta and Gamma), ultraviolet sensor (UVA, UVB) |
| 29 | Explosive and Hazardous Gases | O2, H2, CH4, Isobutane, Ethanol |
523.10 Smart Retail
| No. | Application | Sensors Integrated |
|---|---|---|
| 30 | Supply Chain Control | RFID and NFC tags |
| 31 | NFC Payment | RFID and NFC tags |
| 32 | Intelligent Shopping Application | RFID and NFC tags |
| 33 | Smart Product Management | Weight sensor (load cell), RFID and NFC tags |
523.11 Smart Logistics
| No. | Application | Sensors Integrated |
|---|---|---|
| 34 | Quality of Shipment Conditions | Light, temperature, humidity, impact, vibrations, accelerometer |
| 35 | Item Location | RFID and NFC tags |
| 36 | Storage Incompatibility Detection | O2, H2, CH4, Isobutane, Ethanol, RFID and NFC tags |
| 37 | Fleet Tracking | GPS |
523.12 Smart Industrial Control
| No. | Application | Sensors Integrated |
|---|---|---|
| 38 | M2M Applications | Voltage, vibration, accelerometer, current |
| 39 | Indoor Air Quality | CO, CO2, NH3, NO2, SH2, O3 |
| 40 | Temperature Monitoring | Temperature, humidity, pressure |
| 41 | Ozone Presence | Ozone (O3) |
| 42 | Indoor Location | Passive tags (RFID+NFC) + Active tags (Zigbee, Wi-Fi, Bluetooth) |
| 43 | Vehicle Auto-diagnosis | Voltage, vibration, accelerometer, current |
523.13 Control Systems
523.13.1 Open Loop Control


523.13.2 Closed Loop Control

523.14 Smart Agriculture
| No. | Application | Sensors Integrated |
|---|---|---|
| 44 | Wine Quality Enhancing | Soil temperature / moisture, leaf wetness, atmospheric pressure, solar radiation (PAR), trunk diameter |
| 45 | Green Houses | Soil temperature / moisture, leaf wetness, atmospheric pressure, solar radiation (PAR), trunk diameter |
| 46 | Golf Courses | Soil moisture |
| 47 | Meteorological Station Network | Anemometer, wind vane, pluviometer |
| 48 | Compost | Humidity, soil moisture, soil temperature |
| 49 | Hydroponics | pH, water conductivity, dissolved ions, air temperature, air humidity |
523.15 Smart Animal Farming
| No. | Application | Sensors Integrated |
|---|---|---|
| 50 | Offspring Care | CH4, SH2, NH3, temperature, humidity |
| 51 | Animal Tracking | Passive tags (RFID+NFC) + Active tags (Zigbee, Wi-Fi, Bluetooth) |
| 52 | Toxic Gas Levels | CH4, SH2, NH3, temperature, humidity |
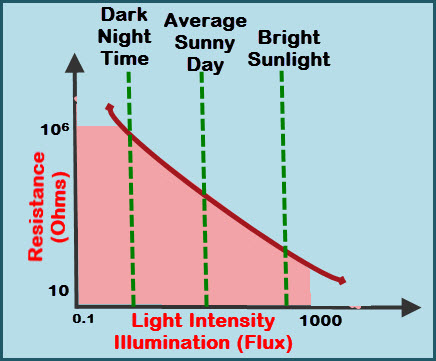
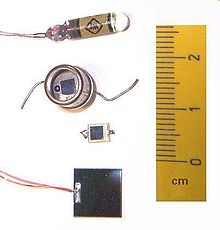
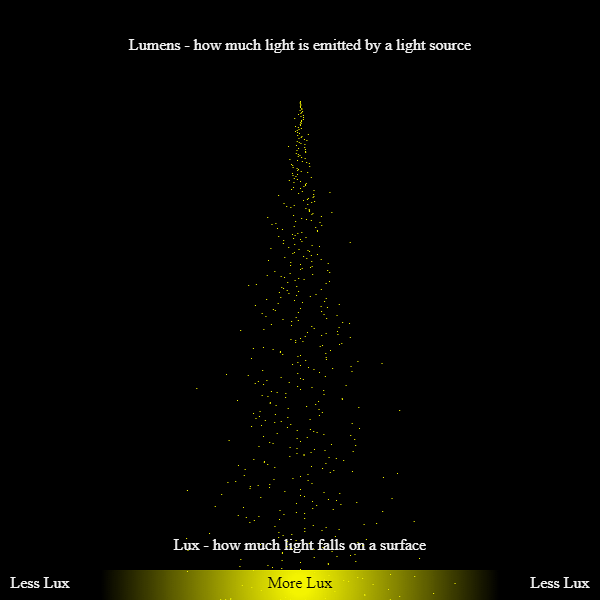
523.16 Light Sensing Technology
523.17 Smart Home Automation
| No. | Application | Sensors Integrated |
|---|---|---|
| 53 | Energy and Water Use | Current and voltage sensors, liquid flow sensor |
| 54 | Remote Control Appliances | Actuator relay |
| 55 | Intrusion Detection Systems | PIR (infrared), hall effect (windows, doors) |
| 56 | Art and Goods Preservation | Temperature, humidity, pressure, O2 |
523.18 Smart Health
| No. | Application | Sensors Integrated |
|---|---|---|
| 57 | Fall Detection | Accelerometer |
| 58 | Medical Fridges | Light, temperature, humidity, impact, vibrations, accelerometer |
| 59 | Sportsmen Care | ECG, pulse, accelerometer, respiration |
| 60 | Patients Surveillance | ECG, pulse, accelerometer, respiration |
| 61 | Ultraviolet Radiation | Ultraviolet sensor (UVA, UVB) |
523.19 Summary
This chapter introduced sensor applications across the 12 major IoT domains:
- Smart Cities: Parking, traffic, lighting, and waste management using magnetic, ultrasonic, and light sensors
- Smart Environment: Fire detection, air quality, and disaster prevention using gas and acceleration sensors
- Smart Water: Quality monitoring and leak detection using pH, flow, and level sensors
- Smart Industrial: Machine monitoring and predictive maintenance using vibration and current sensors
- Smart Agriculture: Soil and crop monitoring using moisture, temperature, and chemical sensors
- Smart Health: Patient monitoring using accelerometers, ECG, and pulse sensors
The tables in this chapter serve as a reference for matching sensor types to specific applications in your IoT projects.
523.20 What’s Next
Now that you understand the landscape of sensor applications across domains, you’re ready to learn how to select the right sensors for your specific project:
Continue to Sensor Selection Wizard -> - Interactive tool to help you choose sensors based on your requirements, budget, and deployment environment.