%% fig-alt: "Timeline diagram showing S2aaS value chain phases: Phase 1 (Year 0) shows sensor deployment with CAPEX investment of $500K for infrastructure. Phase 2 (Months 1-6) shows platform integration including sensor registration, API development, and marketplace listing. Phase 3 (Months 6-12) shows customer acquisition with first subscribers generating $50K revenue. Phase 4 (Years 1-3) shows steady-state operation with multiple tenants generating $150K annual revenue and 70% utilization. Break-even occurs at approximately 3 years."
%%{init: {'theme': 'base', 'themeVariables': { 'primaryColor': '#2C3E50', 'primaryTextColor': '#fff', 'primaryBorderColor': '#16A085', 'lineColor': '#16A085', 'secondaryColor': '#E67E22', 'tertiaryColor': '#7F8C8D'}}}%%

timeline
    title S2aaS Value Chain Timeline
    section Investment Phase
        Year 0 : Sensor Deployment : CAPEX $500K : Infrastructure setup
    section Integration Phase
        Months 1-3 : Platform Integration : API Development : Sensor Registration
        Months 3-6 : Marketplace Launch : Quality Certification : Pricing Strategy
    section Growth Phase
        Months 6-12 : First Customers : $50K Revenue : 10% Utilization
        Year 1-2 : Multi-Tenant Growth : $100K Revenue : 40% Utilization
    section Maturity Phase
        Year 2-3 : Break-Even Point : $150K Revenue : 70% Utilization
        Year 3+ : Profit Generation : ROI Achieved : Network Effects
491 S2aaS Core Concepts and Service Models
491.1 Learning Objectives
By the end of this chapter, you will be able to:
- Understand S2aaS Model: Explain Sensing-as-a-Service and its paradigm shift from dedicated infrastructure
- Identify Service Layers: Differentiate between IaaS, PaaS, and SaaS for sensing systems
- Describe the S2aaS Ecosystem: Explain the roles of sensor owners, platform operators, and data consumers
- Explain Historical Evolution: Trace the development from dedicated sensing to marketplace models
- Apply Discovery Mechanisms: Implement sensor discovery based on capabilities, location, or criteria
491.2 Prerequisites
Before diving into this chapter, you should be familiar with:
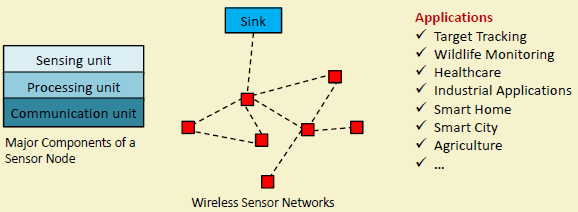
- Wireless Sensor Networks: Understanding traditional WSN architectures helps appreciate the paradigm shift to shared, service-oriented sensing infrastructure
- Sensor Fundamentals and Types: Knowledge of sensor characteristics and data types is essential for designing virtualization layers that abstract physical sensors
- IoT Reference Models: Familiarity with the 7-level IoT architecture helps understand where S2aaS platforms operate and how they integrate sensing with cloud services
ImportantThe Challenge: Sensors are Expensive to Deploy and Maintain
The Problem: Owning sensor infrastructure is costly and complex:
- Capital expense: Hardware ($100-$1,000+ per sensor), installation, permits, site surveys
- Operating expense: Power, cellular/Wi-Fi connectivity, cloud storage, maintenance
- Expertise required: Calibration, data quality assurance, domain knowledge for each sensor type
- Scale complexity: Deploying thousands of sensors across a city requires massive logistics
Why Traditional Approaches Fall Short:
- Different applications need different sensor types and locations
- Utilization varies dramatically (weather sensors idle during stable conditions)
- Technology changes rapidly (3-5 year obsolescence cycles)
- Geographic coverage requires investment that no single organization can justify
What We Actually Need:
- Access to sensor data without owning the physical infrastructure
- Pay-per-use model matching sensing costs to actual consumption
- Virtual sensors that aggregate and abstract physical deployments
- Standard APIs enabling seamless switching between providers
The Solution: Sensing-as-a-Service (S2aaS) applies the cloud computing model to sensors: rent sensing capability instead of buying it. Just as AWS eliminated the need to own data centers, S2aaS eliminates the need to own sensor networks. A startup can access 10,000 air quality sensors across 50 cities for $5,000/month instead of spending $10 million to deploy their own.
TipFor Beginners: Sensing-as-a-Service (S2aaS)
Imagine you want to monitor air quality across your city for a research project. You could spend $500,000 buying and installing 500 sensors, or you could pay $5,000/month to access data from sensors the city already installed. This is Sensing-as-a-Service - renting access to sensors instead of owning them.
The Sharing Economy for Sensors:
Think of S2aaS like Airbnb for sensors: - Sensor Owners (like homeowners): Deploy sensors for their own use, then rent them out to earn passive income - Data Consumers (like travelers): Pay for temporary access to sensor data without buying expensive hardware - Platform (like Airbnb): Connects owners and consumers, handles payments, ensures quality
Real-World Example:
A city installs 1,000 air quality sensors for pollution monitoring (cost: $1 million). Instead of letting them sit idle at night: - University researchers rent access for climate studies ($10,000/year) - Health department uses data for respiratory illness tracking ($15,000/year) - Real estate company analyzes data for property valuations ($20,000/year) - City recovers investment in 2-3 years instead of 10!
Three Service Levels (like cloud computing):
- IaaS (Infrastructure): Rent raw sensor access - you handle everything else (like renting a car)
- PaaS (Platform): Access sensor network with basic processing included (like Uber - you don’t drive)
- SaaS (Software): Get ready-to-use analytics and insights (like Uber Eats - food arrives at your door)
| Term | Simple Explanation | Everyday Analogy |
|---|---|---|
| S2aaS | Rent sensor access instead of buying sensors | Netflix vs buying DVDs |
| Multi-Tenancy | Multiple users share same sensors safely | Apartment building with private units |
| Sensor Virtualization | Software representation of physical sensor | Uber app representing real cars |
| Data Marketplace | Platform to buy/sell sensor data | eBay for sensor data |
| Pay-Per-Use | Pay only for data you actually consume | Electric bill (pay for kwh used) |
| Sensor Discovery | Finding available sensors by location/type | Google Maps searching “coffee near me” |
Who Benefits:
- Sensor Owners: Monetize infrastructure (instead of $0 return, earn revenue)
- Data Consumers: Avoid $500K capital expense, get immediate access, pay only $5K/month when needed
- Society: Less electronic waste (shared sensors vs duplicate deployments), lower barriers for researchers/startups
Why This Matters for IoT:
Traditional model: Every application deploys dedicated sensors (wasteful, expensive, redundant). S2aaS model: Share sensor infrastructure (efficient, affordable, accessible). This democratizes IoT - small startups and researchers can access sensing capabilities previously limited to large organizations with big budgets!
TipFor Kids: Meet the Sensor Squad!
Sensing-as-a-Service is like having a library for sensors - instead of buying every book (sensor), you can borrow the ones you need!
491.2.1 The Sensor Squad Adventure: The Neighborhood Sharing Club
One sunny day, the Sensor Squad was helping their neighborhood. Sammy the Temperature Sensor lived at the Johnson house, Lux the Light Sensor lived at the Garcia house, Motio the Motion Detector lived at the Park house, and Pressi the Pressure Sensor lived at the Chen house.
“I wish I knew how sunny it is in my backyard,” said Mrs. Johnson. “But I don’t have a light sensor!”
“I wish I knew the temperature!” said Mr. Garcia. “But I don’t have a temperature sensor!”
Everyone wanted data from sensors they didn’t own. Buying new sensors for everyone would cost so much money!
Then Lux had a brilliant idea: “What if we SHARE? I can tell Mrs. Johnson how sunny it is, and Sammy can tell Mr. Garcia the temperature. We’ll create a SENSOR SHARING CLUB!”
The Sensor Squad got to work. They built a special clubhouse (the cloud platform) where all their readings were collected. Now anyone in the neighborhood could ask for sensor data:
- The ice cream truck driver checked Sammy’s temperature readings to know which streets would have kids outside
- The garden club used Lux’s light data to plan the best sunny spots for their flowers
- The mail carrier used Motio’s motion data to know when dogs were in the yard
- The delivery company used Pressi’s weight readings to find flat, sturdy surfaces for packages
Instead of everyone buying their OWN sensors (which would cost thousands of dollars!), they paid a small monthly fee to access the Sensor Squad’s data. The families who owned the sensors earned money back, and everyone saved tons of cash!
“This is amazing!” cheered the neighborhood. “We’re getting sensor data for just a few dollars a month instead of buying expensive equipment!”
491.2.2 Key Words for Kids
| Word | What It Means |
|---|---|
| Sensing-as-a-Service | Renting access to sensors instead of buying your own - like Netflix for sensor data |
| Data Marketplace | A place where people can buy and sell sensor information, like an online store for data |
| Multi-Tenancy | When many different people share the same sensor, but each gets their own private data |
| Sensor Virtualization | Making one physical sensor appear as many “virtual” sensors for different users |
| Pay-Per-Use | Paying only for the sensor data you actually use, like paying for electricity by the hour |
491.2.3 Try This at Home!
Create Your Own Sensor Sharing Club!
- Find “sensors” around your house (these can be pretend):
- A thermometer = temperature sensor
- A window = light sensor (is it sunny or cloudy?)
- Your eyes = motion sensor (is anyone walking by?)
- A bathroom scale = pressure/weight sensor
- Make a “Sensor Menu” on paper:
- Temperature reading: 5 cents
- Light level (sunny/cloudy/dark): 3 cents
- Motion alert (someone walked by!): 2 cents
- Weight measurement: 4 cents
- Play “Sensor Service” with family:
- Family members “pay” with play money or tokens
- They request data: “Is it sunny outside?”
- You check your “light sensor” (the window) and report back!
- Keep track of your “earnings” - see how much money you’d make if this were real!
Discussion Questions: - Why is it cheaper to share sensors instead of everyone buying their own? - What data would YOU want to buy from a neighbor’s sensor? - What data should NEVER be shared? (Hint: cameras inside houses!)
492 Sensing as a Service
NoteKey Concepts
- Sensing-as-a-Service (SaaS): Cloud-based model where sensing capabilities are offered as services, abstracting underlying sensor infrastructure from applications
- Sensor Virtualization: Creating software abstractions of physical sensors, allowing applications to access sensing data without managing hardware
- Service-Oriented Architecture (SOA): Architectural pattern where system capabilities are exposed as services with well-defined interfaces
- Sensor Discovery: Mechanisms for applications to find and access available sensing services based on capabilities, location, or other criteria
- Data Marketplace: Platforms where sensor data can be shared, traded, or monetized, enabling new business models for sensing infrastructure
- Multi-Tenancy: Multiple independent applications sharing common sensor infrastructure while maintaining data isolation and security
492.1 Sensing as a Service (S2aaS)


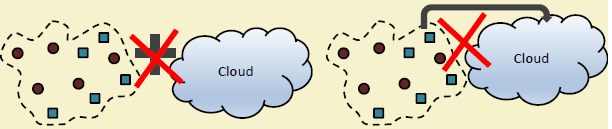
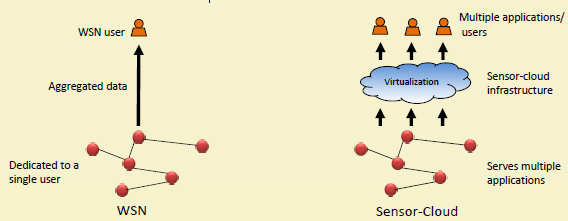
Sensing as a Service (S2aaS) represents a paradigm shift in how sensing infrastructure is deployed, managed, and monetized. Rather than requiring each application or organization to deploy and maintain dedicated sensing infrastructure, S2aaS enables shared sensor networks where sensing capabilities are provided as a service, similar to how cloud computing delivers computational resources on demand.
TipCross-Hub Connections
Expand Your Learning:
This chapter on S2aaS core concepts connects to resources across the book’s learning ecosystem:
- Knowledge Map: Explore how S2aaS fits into the broader IoT architecture landscape, connecting service-oriented sensing with cloud computing, WSN, and business models
- Quizzes Hub: Test your understanding of S2aaS concepts including multi-tenancy, sensor virtualization, data ownership models, and pricing strategies
- Simulations Hub: Experiment with interactive S2aaS marketplace simulators to understand sensor discovery, pricing dynamics, and multi-tenant resource allocation
- Videos Hub: Watch guided tutorials on sensor cloud architecture, data marketplace design patterns, and real-world S2aaS platform implementations
Related Deep Dives: - S2aaS Data Ownership - Ownership models, privacy, and governance - S2aaS Value and Challenges - Stakeholder value and future directions - Sensing as a Service - Complete S2aaS implementation details
Architectural Comparisons: - Cloud Computing - IaaS/PaaS/SaaS models applied to computing - M2M Fundamentals - Dedicated versus shared sensing paradigms - Fog Fundamentals - Local versus cloud sensing services
492.2 Definition
Sensing as a Service (S2aaS) is a service model where sensor infrastructure, data collection, processing, and analytics are provided as on-demand, pay-per-use services rather than requiring organizations or individuals to own and operate their own dedicated sensing systems. S2aaS enables sensor owners to monetize their infrastructure while allowing data consumers to access sensing capabilities without capital investment.
492.2.1 Core Concept
In the S2aaS model, sensors and sensor networks become shared resources, much like cloud computing transformed dedicated servers into shared, on-demand infrastructure. Sensor owners (individuals, organizations, municipalities) deploy and maintain sensing infrastructure, while multiple consumers access sensor data and analytics through service interfaces.
Traditional Model: - Each organization deploys dedicated sensors - High capital and operational costs - Underutilized infrastructure - Redundant deployments in same areas - Limited scalability
S2aaS Model:


- Shared sensor infrastructure
- Pay-per-use pricing
- Higher utilization efficiency
- Reduced redundancy
- Dynamic scalability

492.2.2 Service Layers

Sensing-as-a-Service Three-Tier Architecture
| Layer | Components | Function | Analogy |
|---|---|---|---|
| Data Consumers | Research Apps, Smart City Services, Business Analytics | Use sensor data | End users |
| SaaS Layer | Traffic Alerts, Air Quality Reports, Occupancy Analytics, Predictive Maintenance | Ready-to-use insights | Netflix (content delivered) |
| PaaS Layer | Data Collection, Storage, Processing, API Gateway, Query & Aggregation | Sensor network platform | Uber (service, not car ownership) |
| IaaS Layer | Temperature Sensors, Air Quality Monitors, Traffic Cameras, Motion Detectors, Smart Meters | Raw sensor access | Renting equipment |
| Physical Infrastructure | Buildings, Streets, Vehicles, Industrial Sites | Where sensors are deployed | Real-world locations |
Data Flow: Physical Infrastructure → IaaS (sensors) → PaaS (platform) → SaaS (analytics) → Data Consumers
Infrastructure as a Service (IaaS) - Sensor Level: Raw access to physical sensors and actuators, similar to virtual machines in cloud computing.
Example: Renting access to specific sensors (temperature, air quality, cameras) deployed in locations of interest.
Platform as a Service (PaaS) - Sensor Network Level: Access to sensor network platforms providing data collection, storage, and basic processing without managing individual sensors.
Example: Using a smart city sensor network platform to collect traffic and environmental data without deploying own sensors.
Software as a Service (SaaS) - Analytics Level: High-level applications and analytics built on sensor data, delivered as ready-to-use services.
Example: Subscribe to traffic congestion alerts, air quality reports, or occupancy analytics without dealing with sensors or data processing.
492.3 Introduction to Sensing as a Service

The evolution of Sensing as a Service reflects broader trends in shared economies, cloud computing, and the proliferation of IoT devices creating opportunities for infrastructure sharing and monetization.
492.3.1 Historical Evolution
Dedicated Sensing Era (Pre-2010): Organizations deployed application-specific sensor networks for particular use cases, resulting in high costs and limited reuse.
Cloud-Enabled Sensing (2010-2015): Cloud platforms enabled better data management and sharing, but sensor deployment remained siloed.
Sensor Proliferation (2015-2020): Explosion of smart devices, smartphones, vehicles, and public infrastructure created vast sensing capacity, much of it underutilized.
Sensing Marketplaces (2020-Present): Platforms emerge enabling sensor owners to monetize infrastructure and data consumers to access sensing capabilities on-demand.
492.3.2 Drivers of S2aaS Adoption
Economic Efficiency: Sharing sensor infrastructure reduces costs for all participants through economies of scale and higher utilization.
Reduced Deployment Barriers: Accessing existing sensors eliminates need for capital investment, permitting, installation, and maintenance.
Broader Coverage: Leveraging diverse sensor owners creates denser, more comprehensive coverage than any single organization could achieve.
Faster Time-to-Insight: Immediate access to operational sensors enables rapid prototyping and deployment of sensing applications.
Sustainability: Sharing infrastructure reduces electronic waste and energy consumption from redundant deployments.
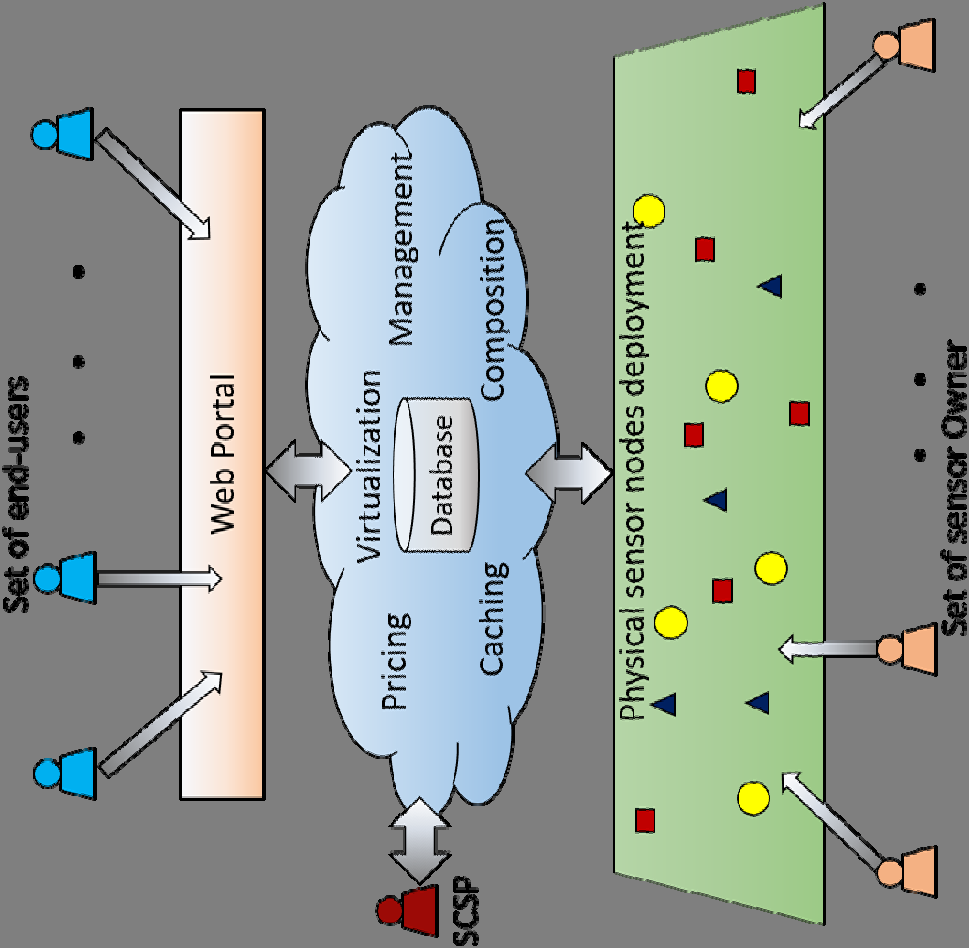
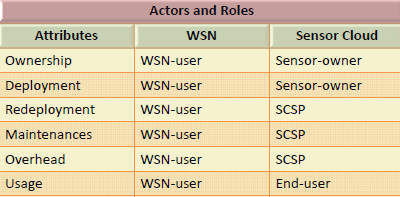
492.3.3 S2aaS Ecosystem

NoteAlternative View: S2aaS Value Chain Timeline
This variant shows the temporal flow of value creation in S2aaS, from initial sensor deployment through monetization, helping understand the investment-to-revenue timeline.
Key Insight: S2aaS transforms sensor infrastructure from a pure cost center (traditional model) into a revenue-generating asset. The timeline shows that break-even typically occurs at 3 years with multi-tenant monetization, compared to never recovering costs with single-purpose deployment.
S2aaS Business Model and Ecosystem Value Flow
| Stakeholder | Role | Examples |
|---|---|---|
| Sensor Owners | Deploy & maintain infrastructure | Municipalities, Building Owners, Vehicle Fleets, Individuals, Sensing Companies |
| Platform Operators | Marketplace & technical infrastructure | Marketplace Provider, Cloud Infrastructure, Analytics Services, API Gateway, Payment Processing |
| Data Consumers | Pay for sensing capabilities | Researchers, Businesses, City Planners, Emergency Services, App Developers |
Value Flows:
| Flow | From | To | Details |
|---|---|---|---|
| Sensor Data | Owners | Platform | Raw measurements, telemetry |
| Processed Data | Platform | Consumers | Analytics, insights, APIs |
| Usage Fees | Consumers | Platform | Pay-per-use pricing |
| Revenue Share | Platform | Owners | 70-85% of usage fees |
| Transaction Fee | Platform retains | - | 15-30% of transactions |
Economic Model: Owners monetize infrastructure → Platform facilitates transactions → Consumers access data affordably → Win-win-win ecosystem
Sensor Owners/Providers: - Municipalities with smart city infrastructure - Building owners with environmental monitoring - Vehicle fleets with mobile sensors - Individuals with personal devices - Specialized sensing companies
Data Consumers/Users: - Researchers needing environmental data - Businesses requiring market intelligence - City planners analyzing mobility patterns - Emergency responders needing situational awareness - Application developers building IoT services
Platform Operators: - Marketplace providers connecting owners and consumers - Cloud platforms hosting sensor data - Analytics service providers - API and integration platforms
TipKnowledge Check
Test your understanding of fundamental concepts with these questions.
492.4 Summary
This chapter covered S2aaS core concepts and service models:
- S2aaS Definition: Service model providing on-demand sensor infrastructure, data collection, and analytics as pay-per-use offerings rather than requiring dedicated ownership and deployment
- Service Layers: Infrastructure as a Service (raw sensor access), Platform as a Service (sensor network platforms), and Software as a Service (ready-to-use analytics applications)
- Historical Evolution: From dedicated sensing era through cloud-enabled sensing to modern sensing marketplaces
- Drivers of Adoption: Economic efficiency, reduced deployment barriers, broader coverage, faster time-to-insight, and sustainability benefits
- Ecosystem Stakeholders: Sensor owners monetize infrastructure, platform operators facilitate marketplace transactions, data consumers access capabilities affordably
- Business Model: Value flows from sensor data through processed analytics to usage fees, with revenue sharing (70-85%) between owners and platforms
492.5 What’s Next
The next chapter explores S2aaS Data Ownership, covering ownership models (sensor owner, consumer, shared), data rights frameworks, privacy and consent considerations, and data governance mechanisms for multi-tenant sensing platforms.