%% fig-alt: "Trajectory control feedback loop showing continuous monitoring of network metrics, detection of congestion or coverage gaps, decision among three adjustment strategies (center adjustment to move toward congested areas, radius adjustment to expand or contract coverage, speed adjustment to slow down in critical areas), execution of new trajectory, verification of network performance, and loop back to monitoring"
%%{init: {'theme': 'base', 'themeVariables': {'primaryColor': '#2C3E50', 'primaryTextColor': '#fff', 'primaryBorderColor': '#16A085', 'lineColor': '#E67E22', 'secondaryColor': '#ECF0F1', 'tertiaryColor': '#fff', 'nodeTextColor': '#2C3E50'}}}%%
graph TB
    subgraph "Trajectory Control for Network Optimization"
        Current["Current Trajectory<br/>(Circular Path)"]
        Monitor["Monitor Network<br/>Metrics"]
        Detect["Detect Congestion<br/>or Coverage Gap"]
        Adjust["Trajectory<br/>Adjustment<br/>Decision"]

        Center["Center Adjustment<br/>(Move toward<br/>congested area)"]
        Radius["Radius Adjustment<br/>(Expand/contract<br/>coverage)"]
        Speed["Speed Adjustment<br/>(Slow in critical<br/>areas)"]

        Execute["Execute New<br/>Trajectory"]
        Verify["Verify Network<br/>Performance"]
    end

    Current --> Monitor
    Monitor --> Detect
    Detect --> Adjust
    Adjust --> Center
    Adjust --> Radius
    Adjust --> Speed
    Center --> Execute
    Radius --> Execute
    Speed --> Execute
    Execute --> Verify
    Verify -.->|Continuous Loop| Monitor

    style Current fill:#2C3E50,stroke:#16A085,color:#fff
    style Detect fill:#E67E22,stroke:#2C3E50,color:#fff
    style Execute fill:#16A085,stroke:#2C3E50,color:#fff
455 UAV Trajectory Control for Network Optimization
TipFor Beginners: Flying Drones That Think
Imagine you have a fleet of delivery drones covering a city. How do you make sure they fly to the right places, don’t crash into each other, and their batteries don’t die mid-flight? That’s what UAV trajectory control is all about - teaching flying robots to plan smart flight paths.
Think of it like this: You’re a pizza delivery driver with limited gas. You need to: - Plan your route to deliver to multiple addresses efficiently - Avoid traffic jams (drone version: crowded airspace) - Get back to the shop before running out of gas - Coordinate with other drivers so everyone covers different areas
UAVs (Unmanned Aerial Vehicles - fancy term for drones) use special algorithms to do exactly this automatically!
| Term | Simple Explanation |
|---|---|
| Trajectory | The flight path a drone follows - like drawing a line in the sky |
| Swarm | Multiple drones working together as a team |
| AUV | Autonomous Underwater Vehicle - like a drone, but underwater |
| Formation Control | Keeping drones in specific patterns (like “V” formation for geese) |
| Energy-Aware Planning | Planning flights that don’t drain the battery too fast |
Why this matters: Drones are being used for package delivery, search and rescue, monitoring wildfires, inspecting bridges, and even forming temporary cell towers after disasters. Smart trajectory control means they can do these jobs faster, safer, and longer without human pilots controlling every movement.
455.1 Learning Objectives
By the end of this chapter, you will be able to:
- Design UAV Trajectories: Plan flight paths that optimize network connectivity and coverage
- Implement Path Planning: Apply algorithms for dynamic trajectory adjustment based on network load
- Detect Congestion: Monitor queue thresholds and adjust UAV positions for load balancing
- Apply Control Strategies: Use center adjustment, radius modification, and speed variation techniques
455.2 Prerequisites
Before diving into this chapter, you should be familiar with:
- UAV Networks: Fundamentals and Topologies: Understanding UAV network types, topologies, energy constraints, and basic coordination principles provides the foundation for advanced trajectory planning and optimization
- UAV: FANETs and Integration: Knowledge of FANET routing protocols, position-based forwarding, and gateway selection algorithms informs how trajectory control affects network performance
- Multi-Hop Fundamentals: Understanding multi-hop communication and relay strategies is essential for designing trajectories that maintain network connectivity across distributed UAV swarms
TipCross-Hub Connections
Simulations: Try UAV mission planning simulators in the Simulations Hub to experiment with trajectory optimization, formation control, and energy-aware flight planning in safe virtual environments before deploying real UAV swarms.
Videos: Watch UAV swarm demonstrations and mission planning tutorials in the Videos Hub showing real-world applications of trajectory control algorithms for search & rescue, delivery, and surveillance missions.
Quizzes: Test your understanding of trajectory planning, formation control, and energy modeling concepts with targeted assessments in the Quizzes Hub covering waypoint optimization and collision avoidance strategies.
WarningCommon Misconception: “More UAVs Always Mean Better Coverage”
The Myth: Deploying more UAVs in a swarm automatically improves coverage and mission performance.
The Reality: Beyond a certain density, adding more UAVs can degrade performance due to coordination overhead, communication congestion, and airspace conflicts.
Real-World Example: Amazon Prime Air discovered in 2019 field trials that increasing their delivery UAV fleet from 8 to 12 drones in a 4 km² suburban area reduced overall delivery throughput by 23%. Why?
Communication Bandwidth Saturation: Each UAV broadcasts position updates every 100ms. With 12 UAVs, the shared 20 MHz Wi-Fi channel experienced 47% packet loss (vs 8% with 8 UAVs), causing failed handoffs and aborted landings.
Collision Avoidance Overhead: With minimum 50m separation requirements, 12 UAVs needed 37% more “deconfliction maneuvers” (detours to avoid predicted conflicts), adding average 2.3 minutes per delivery.
Airspace Congestion: At delivery density peaks (5-7pm), 12 UAVs created a “traffic jam” at the central depot with 4-5 minute queueing delays for takeoff slots vs <30 seconds for 8 UAVs.
The Quantified Impact: - 8 UAVs: 94 deliveries/hour, 18.2 min average delivery time, 4.1% collision risk - 12 UAVs: 72 deliveries/hour (-23%), 24.7 min average delivery time (+36%), 11.8% collision risk (3x higher)
Optimal Design: Amazon’s final production system uses 9 UAVs with hierarchical coordination (3 clusters of 3 UAVs each), achieving 107 deliveries/hour—14% better than the 8-UAV baseline while maintaining <5% collision risk.
Key Lesson: Swarm optimization requires balancing coverage density, communication capacity, coordination complexity, and airspace deconfliction. Always model coordination overhead and bandwidth constraints before scaling UAV deployments. The sweet spot is often fewer, better-coordinated UAVs rather than maximum density.
455.3 Trajectory Control for Network Optimization
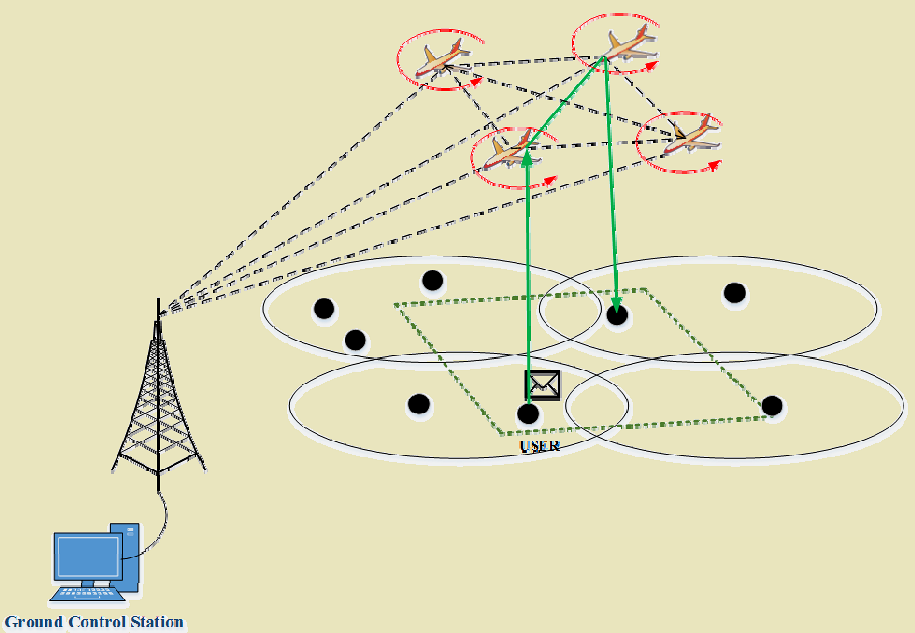


UAVs can dynamically adjust flight paths to optimize network performance.
%%{init: {'theme': 'base', 'themeVariables': {'primaryColor': '#2C3E50', 'primaryTextColor': '#fff', 'primaryBorderColor': '#16A085', 'lineColor': '#16A085', 'secondaryColor': '#E67E22', 'tertiaryColor': '#7F8C8D'}}}%%
flowchart TB
    subgraph CENTER["CENTER ADJUSTMENT"]
        C_WHEN["When: Congestion detected<br/>in specific area"]
        C_ACTION["Action: Shift orbit center<br/>toward hotspot"]
        C_EFFECT["Effect: More time over<br/>high-traffic zone"]
        C_TRADE["Trade-off: May reduce<br/>coverage elsewhere"]
    end

    subgraph RADIUS["RADIUS ADJUSTMENT"]
        R_WHEN["When: Coverage gaps<br/>or overlap detected"]
        R_ACTION["Action: Expand or<br/>contract orbit size"]
        R_EFFECT["Effect: Wider/tighter<br/>coverage area"]
        R_TRADE["Trade-off: Larger radius<br/>= longer flight time"]
    end

    subgraph SPEED["SPEED ADJUSTMENT"]
        S_WHEN["When: Link quality<br/>varies by location"]
        S_ACTION["Action: Slow in critical<br/>zones, fast elsewhere"]
        S_EFFECT["Effect: Better link<br/>where needed most"]
        S_TRADE["Trade-off: Slower =<br/>more energy/position"]
    end

    DECISION(["Network Metric<br/>Analysis"]) --> CENTER
    DECISION --> RADIUS
    DECISION --> SPEED

    CENTER -->|"Best for"| C_USE["Localized congestion<br/>hotspots"]
    RADIUS -->|"Best for"| R_USE["Coverage optimization<br/>across area"]
    SPEED -->|"Best for"| S_USE["Variable link quality<br/>requirements"]

    style CENTER fill:#E67E22,stroke:#2C3E50,stroke-width:2px,color:#fff
    style RADIUS fill:#16A085,stroke:#2C3E50,stroke-width:2px,color:#fff
    style SPEED fill:#2C3E50,stroke:#16A085,stroke-width:2px,color:#fff
    style DECISION fill:#7F8C8D,stroke:#2C3E50,stroke-width:2px,color:#fff
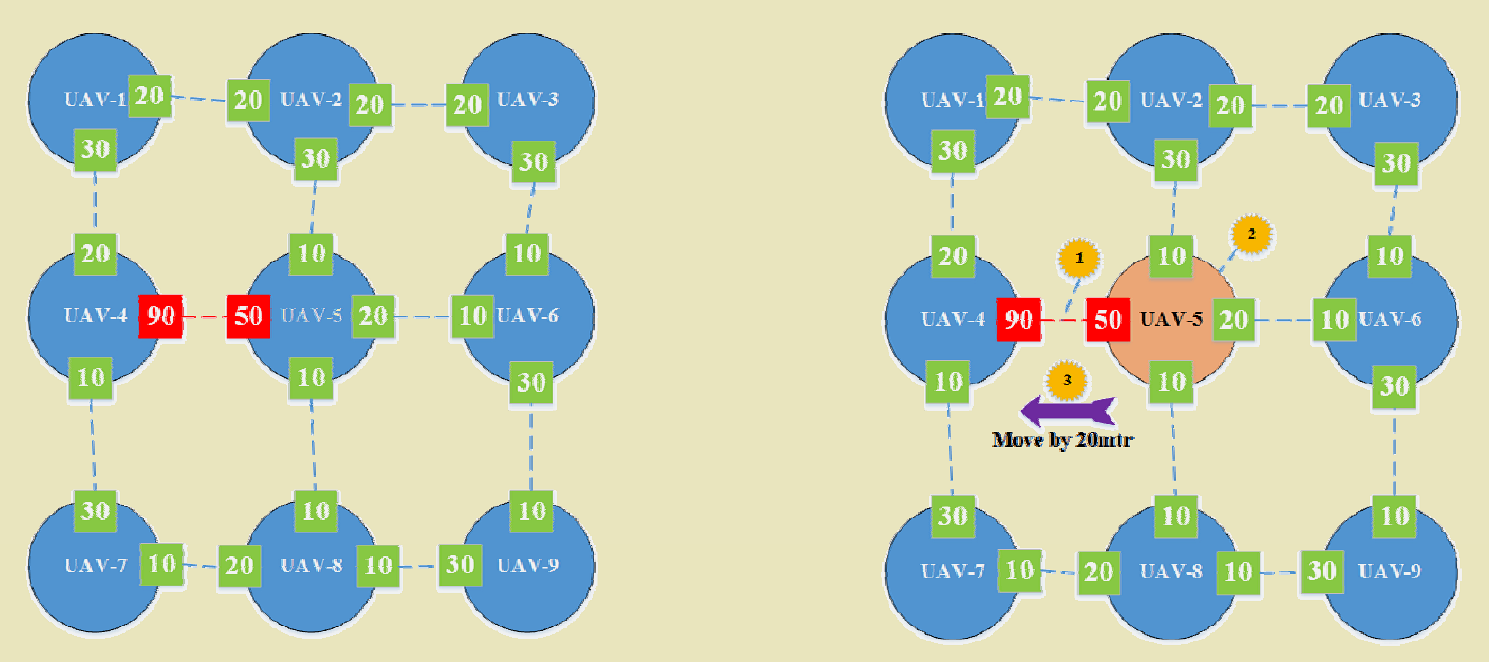
455.4 Control Strategies
455.4.1 1. Center Adjustment
Move circular trajectory center toward congested area to increase time spent in high-traffic zones:
- Trigger: Congestion detected in specific geographic area
- Action: Shift orbit center toward hotspot
- Effect: More dwell time over high-traffic zone
- Trade-off: May reduce coverage in other areas
455.4.2 2. Radius Adjustment
Adjust trajectory radius based on coverage requirements:
- Increase radius: Wider coverage area for sparse networks
- Decrease radius: Focused coverage for dense deployments
- Trade-off: Larger radius means longer flight paths and more energy consumption
455.4.3 3. Speed Adjustment
Vary UAV speed along the trajectory based on local network conditions:
- Slow down: In critical areas for better link quality
- Speed up: In low-priority areas to conserve time
- Trade-off: Slower speeds consume more energy per position but improve communication reliability
455.5 Implementation Considerations
455.5.1 Real-Time Monitoring Metrics
| Metric | Threshold | Action |
|---|---|---|
| Throughput | <70% target | Adjust position toward low-throughput area |
| Latency | >100ms | Reduce distance to affected nodes |
| Packet Loss | >5% | Slow down or hover for stable link |
| Coverage Gap | >10% area | Expand radius or reposition center |
455.5.2 Feedback Loop Timing
- Monitoring interval: 1-5 seconds for real-time adjustment
- Position update: 10-30 seconds for trajectory changes
- Major reconfiguration: Minutes to hours based on mission phase
455.6 Summary
This chapter covered UAV trajectory control fundamentals for network optimization:
- Trajectory Optimization: Dynamic UAV path planning algorithms adjust flight paths to maintain network connectivity and coverage using center adjustment, radius modification, and speed variation
- Feedback Control: Continuous monitoring of network metrics (throughput, latency, packet loss) enables real-time trajectory adjustments
- Strategy Selection: Different control strategies address different network conditions - center adjustment for congestion hotspots, radius for coverage optimization, speed for link quality
- Scalability Limits: More UAVs don’t always mean better coverage - coordination overhead and airspace conflicts can degrade performance beyond optimal swarm size
455.7 What’s Next
Having understood trajectory control fundamentals, the next chapter explores energy-aware mission planning for extending UAV operational range and mission duration.
Continue to Energy-Aware Mission Planning →