%%{init: {'theme': 'base', 'themeVariables': {'primaryColor':'#2C3E50','primaryTextColor':'#fff','primaryBorderColor':'#16A085','lineColor':'#16A085','secondaryColor':'#E67E22','tertiaryColor':'#7F8C8D','clusterBkg':'#ECF0F1','clusterBorder':'#2C3E50','edgeLabelBackground':'#fff'}}}%%
graph TB
    subgraph Healthcare["Healthcare & Medical Devices"]
        H1[Heart Rate Monitors]
        H2[Blood Glucose Meters]
        H3[Temperature Sensors]
        H4[Pulse Oximeters]
    end

    subgraph SmartHome["Smart Home & Consumer"]
        S1[Smart Locks]
        S2[Light Bulbs]
        S3[Thermostats]
        S4[Audio Devices]
    end

    subgraph Wearables["Wearables & Fitness"]
        W1[Fitness Trackers]
        W2[Smartwatches]
        W3[Activity Monitors]
        W4[Sleep Trackers]
    end

    subgraph Retail["Retail & Location"]
        R1[Beacons]
        R2[Asset Tracking]
        R3[Proximity Marketing]
        R4[Indoor Navigation]
    end

    subgraph Industrial["Industrial IoT"]
        I1[Sensor Networks]
        I2[Predictive Maintenance]
        I3[Equipment Monitoring]
        I4[Safety Systems]
    end

    BLE[Bluetooth Low Energy<br/>Core Technology]

    BLE --> Healthcare
    BLE --> SmartHome
    BLE --> Wearables
    BLE --> Retail
    BLE --> Industrial

    style BLE fill:#2C3E50,stroke:#16A085,stroke-width:3px,color:#fff
    style Healthcare fill:#16A085,stroke:#2C3E50,stroke-width:2px,color:#fff
    style SmartHome fill:#16A085,stroke:#2C3E50,stroke-width:2px,color:#fff
    style Wearables fill:#16A085,stroke:#2C3E50,stroke-width:2px,color:#fff
    style Retail fill:#16A085,stroke:#2C3E50,stroke-width:2px,color:#fff
    style Industrial fill:#16A085,stroke:#2C3E50,stroke-width:2px,color:#fff
921 Bluetooth Applications and Labs
921.1 Learning Objectives
By the end of this chapter, you will be able to:
- Identify Bluetooth Use Cases: Analyze healthcare, smart home, industrial, and retail applications
- Implement BLE Beacons: Configure iBeacon and Eddystone for proximity-based services
- Design Wearable Solutions: Apply BLE for fitness trackers, health monitors, and smart accessories
- Build BLE Applications: Develop client and server applications using standard BLE APIs
- Integrate with Cloud Services: Connect BLE devices to cloud platforms for data analytics
- Troubleshoot BLE Deployments: Diagnose connection issues, range problems, and interference
921.2 Prerequisites
Before diving into this chapter, you should be familiar with:
- Bluetooth Fundamentals and Architecture: Understanding BLE architecture, GATT services, characteristics, and connection models is essential for building practical applications
- Application Protocols Overview: Knowledge of protocol selection criteria helps you understand when to use Bluetooth versus other IoT protocols
- Networking Fundamentals: Basic understanding of wireless communication, frequency bands, and interference is necessary for troubleshooting deployments
NoteRelated Chapters
Deep Dives: - Bluetooth Fundamentals and Architecture - Core BLE protocol stack - Bluetooth Security - Securing BLE applications - Bluetooth Implementations and Labs - Hands-on development guide
Comparisons: - Wi-Fi Applications - Compare Bluetooth vs Wi-Fi for IoT - Zigbee Applications - Mesh networking alternatives - NFC Applications - Short-range contactless communication
Products Using Bluetooth:
Learning Resources: - Quizzes Hub - Test your BLE application knowledge - Videos Hub - BLE application tutorials - Simulations Hub - Interactive BLE experiments
TipFor Beginners: Bluetooth in the Real World
Bluetooth Low Energy (BLE) is everywhere in IoT—from your fitness tracker to smart locks. This chapter shows how to build real applications, not just understand the theory.
Three Main Application Types:
| Type | How It Works | Examples |
|---|---|---|
| Connected Devices | Your phone pairs with a device for two-way communication | Fitness bands, smart locks, medical devices |
| Beacons | Small devices broadcast their location; phones detect them nearby | Store navigation, museum guides, proximity alerts |
| Mesh Networks | Devices relay messages to cover large areas | Smart lighting, building automation |
Common BLE Profiles:
BLE uses “profiles” that define how devices communicate for specific purposes:
- Heart Rate Profile: Fitness devices send pulse data
- Battery Service: Any device can report battery level
- Device Information: Manufacturer, model, serial number
- Proximity Profile: Detect when devices are nearby
Beacons Explained Simply:
A beacon is like a lighthouse—it constantly broadcasts “I’m here!” and an identifier such as “display #23”. As a phone walks past and detects that ID, the app can decide to show information or trigger an action for that specific location.
Two Beacon Standards:
- iBeacon (Apple): Uses UUID + major + minor numbers
- Eddystone (Google): Can broadcast URLs directly
When to Use Bluetooth:
✅ Good for: Short range (<50m), phone connection, wearables, small data ❌ Bad for: Long range, large networks, high bandwidth, no phone involved
Quick Example - Fitness Tracker:
- Tracker has heart rate sensor
- BLE advertises “I have heart rate data”
- Phone app connects and subscribes to heart rate
- Tracker sends readings every second
- App displays your pulse in real-time
This chapter guides you through building these types of applications yourself.
TipUnderstanding Check: BLE Beacon Deployment for Retail
Scenario: You’re deploying a proximity experience for a medium-sized retail store with ~30 product display areas. You want customers’ phones to show product details and promotions when they stand near specific displays. Beacons are battery-powered and should last months-to-years between maintenance.
Think about: 1. Should you use iBeacon or Eddystone (UID/URL/EID)? What platform constraints drive the choice? 2. How do beacon density, TX power, and advertising interval affect detection latency, battery life, and proximity granularity? 3. If you need sub-meter positioning, what technology would you consider instead of RSSI-based proximity?
Suggested approach: - Start with a standard beacon format (Eddystone-UID or iBeacon) and a backend mapping from beacon IDs → locations/displays. - Pilot first: place beacons per zone/display, then adjust based on measured RSSI variability and user experience. - Tune advertising interval and TX power to meet latency/battery goals (shorter intervals improve discovery but increase power). - Remember: RSSI is noisy—avoid promising fixed “meter-level” accuracy without calibration.
Verify Your Understanding: - Why does shorter advertising interval reduce battery life? - When would Bluetooth Mesh be a better fit than beacons in a retail deployment?
921.3 Real-World Applications
Bluetooth technology spans multiple application domains, each leveraging specific capabilities of the protocol. The following diagram illustrates the major application areas:
TipAlternative View: BLE Applications by Data Pattern
This variant shows the same BLE application domains organized by their typical data communication patterns - helping you understand which BLE features each domain relies on most.
%% fig-alt: "BLE applications organized by data patterns: Continuous streaming (heart rate, audio) uses connection mode with notifications. Periodic reporting (glucose, temperature) uses connection with intervals. Broadcast only (beacons, asset tags) uses advertising without connection. Command/response (locks, thermostats) uses connection with characteristic writes."
%%{init: {'theme': 'base', 'themeVariables': { 'primaryColor': '#2C3E50', 'primaryTextColor': '#fff', 'primaryBorderColor': '#16A085', 'lineColor': '#E67E22', 'secondaryColor': '#16A085', 'tertiaryColor': '#7F8C8D', 'fontSize': '11px'}}}%%
flowchart TB
    subgraph STREAM["CONTINUOUS STREAMING<br/>Connection + Notifications"]
        ST1["Heart Rate<br/>Monitors"]
        ST2["Audio<br/>Devices"]
        ST3["Real-time<br/>Sensors"]
    end

    subgraph PERIODIC["PERIODIC REPORTING<br/>Connection + Intervals"]
        PE1["Glucose<br/>Meters"]
        PE2["Fitness<br/>Trackers"]
        PE3["Environmental<br/>Sensors"]
    end

    subgraph BROADCAST["BROADCAST ONLY<br/>Advertising Mode"]
        BR1["iBeacon/<br/>Eddystone"]
        BR2["Asset<br/>Tags"]
        BR3["Proximity<br/>Markers"]
    end

    subgraph COMMAND["COMMAND/RESPONSE<br/>Connection + Write"]
        CM1["Smart<br/>Locks"]
        CM2["Thermostats"]
        CM3["Light<br/>Controls"]
    end

    BLE["BLE Core"] --> STREAM
    BLE --> PERIODIC
    BLE --> BROADCAST
    BLE --> COMMAND

    style STREAM fill:#2C3E50,stroke:#16A085,color:#fff
    style PERIODIC fill:#16A085,stroke:#2C3E50,color:#fff
    style BROADCAST fill:#E67E22,stroke:#2C3E50,color:#fff
    style COMMAND fill:#7F8C8D,stroke:#2C3E50,color:#fff
Key Insight: Understanding the data pattern helps you choose the right BLE features. Continuous streaming needs connection with notifications. Beacons need only advertising. Smart locks need secure command/response. Matching your pattern to BLE capabilities optimizes battery life and responsiveness.
921.3.1 Healthcare and Medical Devices
BLE has revolutionized personal health monitoring by enabling continuous data collection with minimal power consumption. Medical-grade devices use standardized BLE profiles to ensure interoperability across platforms.
Key Applications:
- Heart Rate Monitors: Chest straps and wristbands transmit real-time pulse data using the Heart Rate Profile (HRP)
- Blood Glucose Meters: Continuous glucose monitors (CGMs) like Dexcom G6 send readings every 5 minutes to smartphones
- Pulse Oximeters: SpO2 sensors provide oxygen saturation levels for respiratory monitoring
- Temperature Sensors: Continuous fever monitoring for infants and post-operative patients
Real-World Example - Continuous Glucose Monitoring:
The Dexcom G6 CGM system demonstrates BLE’s capabilities in medical IoT:
- Sensor transmits glucose readings every 5 minutes via BLE
- 10-day sensor life with coin cell battery in transmitter
- Range: Often on the order of a few meters in real use, but varies with placement and environment
- Data stored locally on phone, synchronized to cloud for clinician access
- Some CGM systems are cleared for insulin dosing decisions; check product labeling and jurisdiction-specific approvals
Regulatory Considerations:
Medical requirements vary widely by jurisdiction and device class. As a rule of thumb:
- Plan for applicable medical-device regulatory pathways (e.g., US FDA, EU MDR/CE) based on intended use.
- Treat security and privacy as design requirements (encryption, authentication, auditability) because health data is sensitive and may be regulated depending on who collects/processes it.
- Some device categories may fall under medical electrical equipment standards (e.g., IEC 60601 family).
Always consult current regulatory guidance for your product and region.
921.3.2 Smart Home and Consumer Electronics
BLE powers the modern smart home ecosystem, providing low-power connectivity for devices that don’t require continuous high-bandwidth communication.
Key Applications:
- Smart Locks: August, Yale, Schlage use BLE for keyless entry and access control
- Light Bulbs: Philips Hue, LIFX enable smartphone control and automation
- Thermostats: Nest, Ecobee use BLE for initial setup and local control
- Audio Devices: Wireless speakers, headphones, soundbars
BLE Mesh for Smart Buildings:
Bluetooth Mesh extends BLE for large-scale building automation:
%%{init: {'theme': 'base', 'themeVariables': {'primaryColor':'#2C3E50','primaryTextColor':'#fff','primaryBorderColor':'#16A085','lineColor':'#16A085','secondaryColor':'#E67E22','tertiaryColor':'#7F8C8D','clusterBkg':'#ECF0F1','clusterBorder':'#2C3E50','edgeLabelBackground':'#fff'}}}%%
graph TB
    subgraph Floor1["Floor 1 - Retail Space"]
        L1[Light 1]
        L2[Light 2]
        S1[Switch 1]
        Sensor1[Motion Sensor 1]
    end

    subgraph Floor2["Floor 2 - Office"]
        L3[Light 3]
        L4[Light 4]
        S2[Switch 2]
        Sensor2[Occupancy Sensor 2]
    end

    subgraph Floor3["Floor 3 - Conference"]
        L5[Light 5]
        L6[Light 6]
        S3[Switch 3]
        Sensor3[Daylight Sensor 3]
    end

    Gateway[BLE Mesh Gateway]
    Cloud[Cloud Management<br/>Platform]

    L1 <--> L2
    L2 <--> S1
    S1 <--> Sensor1
    Sensor1 <--> L3

    L3 <--> L4
    L4 <--> S2
    S2 <--> Sensor2
    Sensor2 <--> L5

    L5 <--> L6
    L6 <--> S3
    S3 <--> Sensor3

    L1 --> Gateway
    L4 --> Gateway
    L6 --> Gateway
    Gateway --> Cloud

    style Gateway fill:#E67E22,stroke:#2C3E50,stroke-width:3px,color:#fff
    style Cloud fill:#2C3E50,stroke:#16A085,stroke-width:2px,color:#fff
    style Floor1 fill:#ECF0F1,stroke:#2C3E50,stroke-width:2px
    style Floor2 fill:#ECF0F1,stroke:#2C3E50,stroke-width:2px
    style Floor3 fill:#ECF0F1,stroke:#2C3E50,stroke-width:2px
BLE Mesh Capabilities (high level):
- Scale (theoretical): large address space, but practical deployments depend on traffic, relay density, and environment
- Reliability: managed flooding with relays/retransmissions can improve delivery (at the cost of airtime)
- Security: built-in AES-CCM encryption with network/application keys (plan provisioning and key rotation)
- Power Efficiency: Low Power Node + Friend features for battery-powered sensors
Example deployment (illustrative):
- Multi-floor lighting + sensors + wall switches in a retrofit building
- Over-the-air provisioning and group addressing for rooms/zones
- Gateways bridge mesh to dashboards for monitoring and updates
- Design considerations: relay placement, TTL, message rates, firmware update strategy, and safe fallback behavior if the cloud is down
921.3.3 Wearables and Fitness
Wearables rely heavily on BLE for phone connectivity and low-power sensor telemetry. They highlight the main engineering trade-off: always-on sensing and notifications, with a small battery.
Key Applications:
- Fitness Trackers: Step counting, heart rate, sleep tracking (Fitbit, Garmin, Whoop)
- Smartwatches: Notifications, activity tracking, contactless payments (Apple Watch, Galaxy Watch)
- Activity Monitors: Specialized sports tracking (Polar, Suunto)
- Sleep Trackers: Ring-based sleep analysis (Oura Ring)
BLE Profile Usage in Wearables:
| Profile | Purpose | Data Rate | Typical Update Interval |
|---|---|---|---|
| Heart Rate Profile (HRP) | Pulse monitoring | 1 byte/sec | 1 second |
| Running Speed & Cadence | Running metrics | 5 bytes/sec | 1 second |
| Cycling Power | Power meter data | 8 bytes/sec | 1 second |
| Battery Service | Battery level | 1 byte | 60 seconds |
| Device Information | Model, firmware | 20 bytes | On connection |
Example: Fitness Tracker Battery Life Budgeting
A tracker’s battery life is set by its average power draw. Major contributors are usually the radio (notifications/sync), sensors (PPG/IMU), display, and MCU.
Illustrative power budget (numbers vary by device and usage):
BLE radio (notifications + sync):      ~5 mW
Optical heart-rate sensing (duty):     ~6 mW
Display (intermittent):               ~2 mW
IMU + MCU (low-power processing):     ~2 mW
-------------------------------------------
Average power:                         ~15 mW

Battery energy: 200 mAh × 3.7 V ≈ 740 mWh
Estimated life: 740 mWh / 15 mW ≈ 49 hours (~2 days)
Note: Real products extend battery life by reducing average power (duty-cycling sensors, batching data, longer connection intervals, aggressive sleep). Use the calculation to reason about trade-offs, not as a guarantee.
921.3.4 BLE Beacons for Retail and Location Services
BLE beacons enable proximity-based services without requiring device pairing. They broadcast identifiers that smartphones can detect to trigger location-aware applications.
Two Major Beacon Standards:
%%{init: {'theme': 'base', 'themeVariables': {'primaryColor':'#2C3E50','primaryTextColor':'#fff','primaryBorderColor':'#16A085','lineColor':'#16A085','secondaryColor':'#E67E22','tertiaryColor':'#7F8C8D','clusterBkg':'#ECF0F1','clusterBorder':'#2C3E50','edgeLabelBackground':'#fff'}}}%%
graph LR
    subgraph iBeacon["iBeacon (Apple)"]
        iB1[UUID: Identifies Beacon Group<br/>16 bytes]
        iB2[Major: Location ID<br/>2 bytes]
        iB3[Minor: Specific Beacon<br/>2 bytes]
        iB4[TX Power: Signal Strength<br/>1 byte]
    end

    subgraph Eddystone["Eddystone (Google)"]
        eB1[Frame Type:<br/>UID, URL, TLM, EID]
        eB2[UID: Namespace + Instance<br/>16 bytes]
        eB3[URL: Direct Web Address<br/>17 bytes max]
        eB4[TLM: Telemetry Data<br/>Battery, Temperature]
    end

    Beacon[BLE Beacon Hardware<br/>CR2032 Battery<br/>1-3 Year Life]

    Beacon --> iBeacon
    Beacon --> Eddystone

    iBeacon --> App1[iOS App<br/>Region Monitoring]
    Eddystone --> App2[Android App<br/>Nearby API]
    Eddystone --> Browser[Physical Web<br/>Chrome Browser]

    style Beacon fill:#E67E22,stroke:#2C3E50,stroke-width:3px,color:#fff
    style iBeacon fill:#ECF0F1,stroke:#2C3E50,stroke-width:2px
    style Eddystone fill:#ECF0F1,stroke:#2C3E50,stroke-width:2px
    style App1 fill:#16A085,stroke:#2C3E50,stroke-width:2px,color:#fff
    style App2 fill:#16A085,stroke:#2C3E50,stroke-width:2px,color:#fff
    style Browser fill:#16A085,stroke:#2C3E50,stroke-width:2px,color:#fff
Beacon Applications:
- Proximity Marketing: Retail stores send promotions when customers approach specific products
- Indoor Navigation: Museums and airports guide visitors with beacon-based wayfinding
- Asset Tracking: Hospitals track medical equipment using beacon tags
- Contactless Check-in: Hotels and events enable automatic check-in via beacons
- Smart Parking: Parking garages detect available spaces and guide drivers
Example deployment: Museum navigation
- Place beacons to create zones near exhibits/galleries.
- App triggers audio/content when a beacon ID is seen (no pairing required).
- Provide accessibility options (languages, captions) in the app.
- Measure aggregate dwell time/flows only with clear user consent and privacy controls.
Beacon Battery Life Factors:
| Parameter | Longer Life | Balanced | Faster Discovery |
|---|---|---|---|
| Advertising Interval | Longer (slower) | Medium | Shorter (faster) |
| TX Power | Lower | Medium | Higher |
| Range | Shorter | Medium | Longer |
| Battery Life | Longer | Medium | Shorter |
| Proximity Granularity | Coarse | Medium | Finer |
Note: Actual range and battery life vary widely across hardware, configuration, and the physical environment—treat the table as a qualitative trade-off guide.
CautionPitfall: Setting Beacon Advertising Interval Too Short for Battery Life Goals
The Mistake: Deploying beacons with 20-100ms advertising intervals to “maximize discoverability,” then discovering batteries drain in weeks instead of the expected 2-3 years.
Why It Happens: Marketing materials emphasize fast discovery, and developers assume shorter intervals are “better.” But advertising is the dominant power consumer for beacons. A 20ms interval causes 50 radio wake-ups per second, each consuming approximately 15-25uA average current per advertisement event (including radio startup, TX, and settling time).
The Fix: Match advertising interval to your actual discovery latency requirements. Most retail/museum deployments work well with 300-1000ms intervals:
Battery life estimation (CR2032, ~220mAh):
- 20ms interval:  ~15uA avg → 220mAh / 0.015mA = ~14,667 hours (~1.7 years theoretical, often <1 year in practice)
- 100ms interval: ~8uA avg  → 220mAh / 0.008mA = ~27,500 hours (~3.1 years theoretical)
- 1000ms interval: ~3uA avg → 220mAh / 0.003mA = ~73,333 hours (~8.4 years theoretical)

Recommended starting points:
- Fast discovery needed (pairing flow): 20-50ms for a few seconds, then switch to slower
- Retail proximity: 300-500ms (sub-second discovery is fine for walking customers)
- Asset tracking: 1000-2000ms (discovery within seconds is acceptable)
- Presence detection: 2000-10240ms (10.24s is BLE max advertising interval)
CautionPitfall: Expecting Consistent RSSI-Based Distance Estimates from BLE Beacons
The Mistake: Building proximity features that assume RSSI (Received Signal Strength Indicator) provides meter-level accuracy, then finding that “1 meter away” sometimes reads as 0.5m and sometimes as 5m depending on user orientation and environment.
Why It Happens: RSSI is affected by multipath reflections, body absorption (humans absorb 2.4GHz signals), antenna orientation, and environmental changes. A person turning 90 degrees can cause 10-20 dBm RSSI variation—equivalent to a 3-10x distance change in naive distance calculations.
The Fix: Design for zone-based proximity (near/medium/far) rather than precise distances. Apply filtering and calibration:
// WRONG: Direct RSSI to distance conversion
function getDistance(rssi, txPower) {
    return Math.pow(10, (txPower - rssi) / (10 * 2.0)); // Unreliable!
}

// BETTER: Zone-based classification with hysteresis
const ZONES = {
    IMMEDIATE: { threshold: -50, name: "touching" },    // <0.5m typical
    NEAR:      { threshold: -65, name: "nearby" },      // 0.5-2m typical
    MEDIUM:    { threshold: -80, name: "in room" },     // 2-5m typical
    FAR:       { threshold: -90, name: "detectable" }   // >5m typical
};

// Apply moving average filter (5-10 samples)
// Add hysteresis (require 3+ consecutive readings before zone change)
// Calibrate thresholds per-venue with real measurements
921.3.5 BLE Application Selection Decision Tree
Choosing the right BLE approach depends on your use case requirements. This decision tree guides you through the selection process:
%%{init: {'theme': 'base', 'themeVariables': {'primaryColor':'#2C3E50','primaryTextColor':'#fff','primaryBorderColor':'#16A085','lineColor':'#16A085','secondaryColor':'#E67E22','tertiaryColor':'#7F8C8D'}}}%%
flowchart TB
    START([Start: BLE Application<br/>Requirements]) --> Q1{Need bidirectional<br/>data exchange?}

    Q1 -->|No - Broadcast Only| BEACON[BLE Beacon<br/>iBeacon / Eddystone]
    Q1 -->|Yes - Two-way| Q2{Need multi-hop<br/>coverage?}

    Q2 -->|Yes - Large Area| MESH[Bluetooth Mesh<br/>Managed Flooding]
    Q2 -->|No - Point-to-Point| Q3{Device Role?}

    Q3 -->|Sensor/Peripheral| GATT_P[GATT Server<br/>Peripheral Role]
    Q3 -->|Hub/Gateway| GATT_C[GATT Client<br/>Central Role]

    BEACON --> B_USE[Use Cases:<br/>Proximity, Navigation,<br/>Asset Tags]
    MESH --> M_USE[Use Cases:<br/>Lighting, HVAC,<br/>Building Automation]
    GATT_P --> P_USE[Use Cases:<br/>Wearables, Sensors,<br/>Health Monitors]
    GATT_C --> C_USE[Use Cases:<br/>Smartphones, Gateways,<br/>Controllers]

    style START fill:#2C3E50,stroke:#16A085,stroke-width:3px,color:#fff
    style BEACON fill:#E67E22,stroke:#2C3E50,stroke-width:2px,color:#fff
    style MESH fill:#16A085,stroke:#2C3E50,stroke-width:2px,color:#fff
    style GATT_P fill:#16A085,stroke:#2C3E50,stroke-width:2px,color:#fff
    style GATT_C fill:#16A085,stroke:#2C3E50,stroke-width:2px,color:#fff
    style B_USE fill:#7F8C8D,stroke:#2C3E50,stroke-width:1px,color:#fff
    style M_USE fill:#7F8C8D,stroke:#2C3E50,stroke-width:1px,color:#fff
    style P_USE fill:#7F8C8D,stroke:#2C3E50,stroke-width:1px,color:#fff
    style C_USE fill:#7F8C8D,stroke:#2C3E50,stroke-width:1px,color:#fff
921.3.6 BLE Deployment Workflow Timeline
Successful BLE deployments follow a structured workflow from requirements through production:
%%{init: {'theme': 'base', 'themeVariables': {'primaryColor':'#2C3E50','primaryTextColor':'#fff','primaryBorderColor':'#16A085','lineColor':'#16A085','secondaryColor':'#E67E22','tertiaryColor':'#7F8C8D'}}}%%
graph LR
    subgraph Phase1["1. Requirements"]
        R1[Define Use Case]
        R2[Power Budget]
        R3[Range Analysis]
    end

    subgraph Phase2["2. Design"]
        D1[Select Chipset]
        D2[Antenna Design]
        D3[GATT Profile]
    end

    subgraph Phase3["3. Development"]
        DEV1[Firmware Dev]
        DEV2[Mobile App]
        DEV3[Backend API]
    end

    subgraph Phase4["4. Testing"]
        T1[Bench Testing]
        T2[Field Pilot]
        T3[Security Audit]
    end

    subgraph Phase5["5. Deployment"]
        P1[Site Survey]
        P2[Installation]
        P3[Commissioning]
    end

    subgraph Phase6["6. Operations"]
        O1[Monitoring]
        O2[OTA Updates]
        O3[Analytics]
    end

    Phase1 --> Phase2 --> Phase3 --> Phase4 --> Phase5 --> Phase6

    style Phase1 fill:#2C3E50,stroke:#16A085,stroke-width:2px,color:#fff
    style Phase2 fill:#16A085,stroke:#2C3E50,stroke-width:2px,color:#fff
    style Phase3 fill:#E67E22,stroke:#2C3E50,stroke-width:2px,color:#fff
    style Phase4 fill:#16A085,stroke:#2C3E50,stroke-width:2px,color:#fff
    style Phase5 fill:#2C3E50,stroke:#16A085,stroke-width:2px,color:#fff
    style Phase6 fill:#7F8C8D,stroke:#2C3E50,stroke-width:2px,color:#fff
921.3.7 Industrial IoT Applications
Industrial environments increasingly adopt BLE for sensor networks, predictive maintenance, and safety monitoring. The protocol’s low power consumption and smartphone integration make it ideal for retrofitting existing equipment.
Key Applications:
- Vibration Monitoring: Detect bearing failures in rotating equipment
- Temperature Monitoring: Cold chain tracking for pharmaceuticals and food
- Pressure Sensors: Hydraulic system monitoring in manufacturing
- Gas Detection: Safety monitoring for hazardous environments
Industrial BLE Sensor Network Example:
%%{init: {'theme': 'base', 'themeVariables': {'primaryColor':'#2C3E50','primaryTextColor':'#fff','primaryBorderColor':'#16A085','lineColor':'#16A085','secondaryColor':'#E67E22','tertiaryColor':'#7F8C8D','clusterBkg':'#ECF0F1','clusterBorder':'#2C3E50','edgeLabelBackground':'#fff'}}}%%
graph TB
    subgraph Factory["Manufacturing Floor"]
        M1[Motor 1<br/>Vibration Sensor]
        M2[Motor 2<br/>Vibration Sensor]
        M3[Motor 3<br/>Vibration Sensor]
        T1[Temperature<br/>Sensor]
        T2[Temperature<br/>Sensor]
        P1[Pressure<br/>Sensor]
        P2[Pressure<br/>Sensor]
    end

    subgraph Gateway["BLE Gateway Infrastructure"]
        G1[Gateway 1<br/>Zone A]
        G2[Gateway 2<br/>Zone B]
        G3[Gateway 3<br/>Zone C]
    end

    subgraph Backend["Backend Systems"]
        MQTT[MQTT Broker]
        DB[(Time Series DB<br/>InfluxDB)]
        ML[ML Pipeline<br/>Anomaly Detection]
        Alert[Alert System<br/>SMS/Email]
    end

    M1 -.BLE.-> G1
    M2 -.BLE.-> G1
    T1 -.BLE.-> G1

    M3 -.BLE.-> G2
    P1 -.BLE.-> G2

    T2 -.BLE.-> G3
    P2 -.BLE.-> G3

    G1 -->|Wi-Fi/Ethernet| MQTT
    G2 -->|Wi-Fi/Ethernet| MQTT
    G3 -->|Wi-Fi/Ethernet| MQTT

    MQTT --> DB
    DB --> ML
    ML --> Alert

    style Factory fill:#ECF0F1,stroke:#2C3E50,stroke-width:2px
    style Gateway fill:#ECF0F1,stroke:#2C3E50,stroke-width:2px
    style Backend fill:#ECF0F1,stroke:#2C3E50,stroke-width:2px
    style MQTT fill:#E67E22,stroke:#2C3E50,stroke-width:2px,color:#fff
    style DB fill:#16A085,stroke:#2C3E50,stroke-width:2px,color:#fff
    style ML fill:#2C3E50,stroke:#16A085,stroke-width:2px,color:#fff
    style Alert fill:#E67E22,stroke:#2C3E50,stroke-width:2px,color:#fff
Example: Predictive maintenance (illustrative):
- Deploy vibration/temperature sensors on motors, pumps, or conveyors.
- Gateways aggregate BLE data and forward it to backend storage and analytics.
- Analysis can range from simple thresholds and spectral features to ML models; design for false positives and a human-in-the-loop workflow.
Industrial BLE Advantages vs Traditional Systems:
| Aspect | Traditional Wired | BLE Wireless |
|---|---|---|
| Installation effort | Higher (cabling) | Lower (retrofit-friendly) |
| Ongoing maintenance | Lower (no batteries) | Battery management required |
| Scalability | Harder (wiring) | Easier (add sensors/gateways) |
| Retrofit existing equipment | Often difficult | Often simpler |
| Data rate | Higher (continuous) | Usually lower/moderate (periodic) |
| Reliability | Predictable cabling | Depends on RF environment; mitigated with gateway placement |
921.4 Cross-Hub Connections
NoteExplore Related Learning Resources
Deepen your understanding of Bluetooth applications with these curated resources:
Interactive Learning: - Simulations Hub: Try the BLE Beacon Range Estimator to calculate optimal beacon placement and advertising parameters for your deployment - Quizzes Hub: Test your knowledge with the Bluetooth Applications Quiz covering beacon deployment, wearable design, and industrial IoT scenarios
Video Tutorials: - Videos Hub: Watch demonstrations of BLE mesh network configuration, iBeacon setup, and real-world industrial sensor deployments
Knowledge Reinforcement: - Knowledge Gaps Hub: Understand common misconceptions about BLE range, battery life calculations, and beacon vs mesh selection criteria
Knowledge Mapping: - Knowledge Map: Visualize how Bluetooth applications connect to GATT profiles, security mechanisms, and other short-range protocols
921.5 Common Misconceptions
WarningMyth: “Bluetooth Beacons Can Track Your Exact Location Everywhere”
The reality: Beacons are one-way broadcasters. They cannot receive, so a beacon does not know who is nearby. Any “tracking” requires a phone/app that chooses to log beacon sightings.
What must be true for tracking to happen:
- A customer installs an app that listens for beacons
- The customer grants permissions (Bluetooth and often location/background, depending on platform)
- The app reports sightings to a server (with explicit consent and a privacy policy)
What beacons can and cannot do:
- ✅ Enable proximity triggers (content, navigation, check-in) for opted-in users
- ❌ Provide “exact location” on their own—RSSI is noisy and most deployments are zone-based
Privacy design tips:
- Make consent explicit and revocable
- Minimize identifiers; rotate IDs where feasible (e.g., ephemeral IDs)
- Prefer aggregate analytics where possible instead of per-user tracking
Note: Other radio systems (Wi-Fi, cellular) can also be used for analytics, but OS privacy protections and regulations vary—design with transparency and consent either way.
921.6 Original Source Figures (Alternative Views)
The following figures from the CP IoT System Design Guide provide alternative perspectives on Bluetooth application concepts.
NoteOriginal Bluetooth Low Energy Overview (Alternative View)
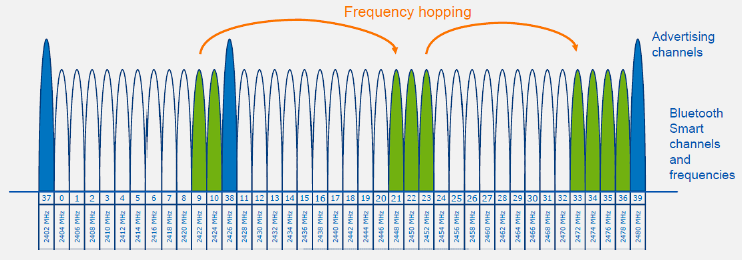
Source: CP IoT System Design Guide, Chapter 4 - Networking
NoteOriginal Bluetooth Power Classes (Alternative View)
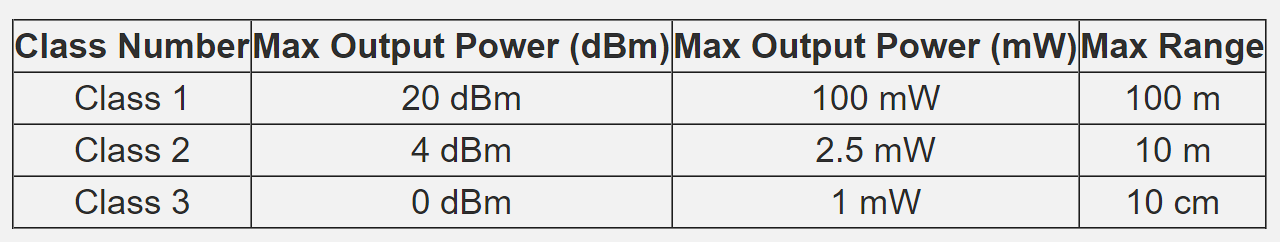
Source: CP IoT System Design Guide, Chapter 4 - Networking
NoteOriginal Bluetooth Operational Modes (Alternative View)
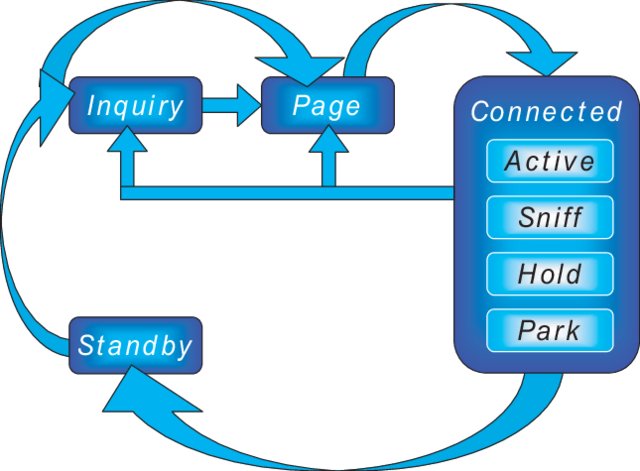
Source: CP IoT System Design Guide, Chapter 4 - Networking
NoteOriginal Bluetooth Comparison for Application Selection (Alternative View)
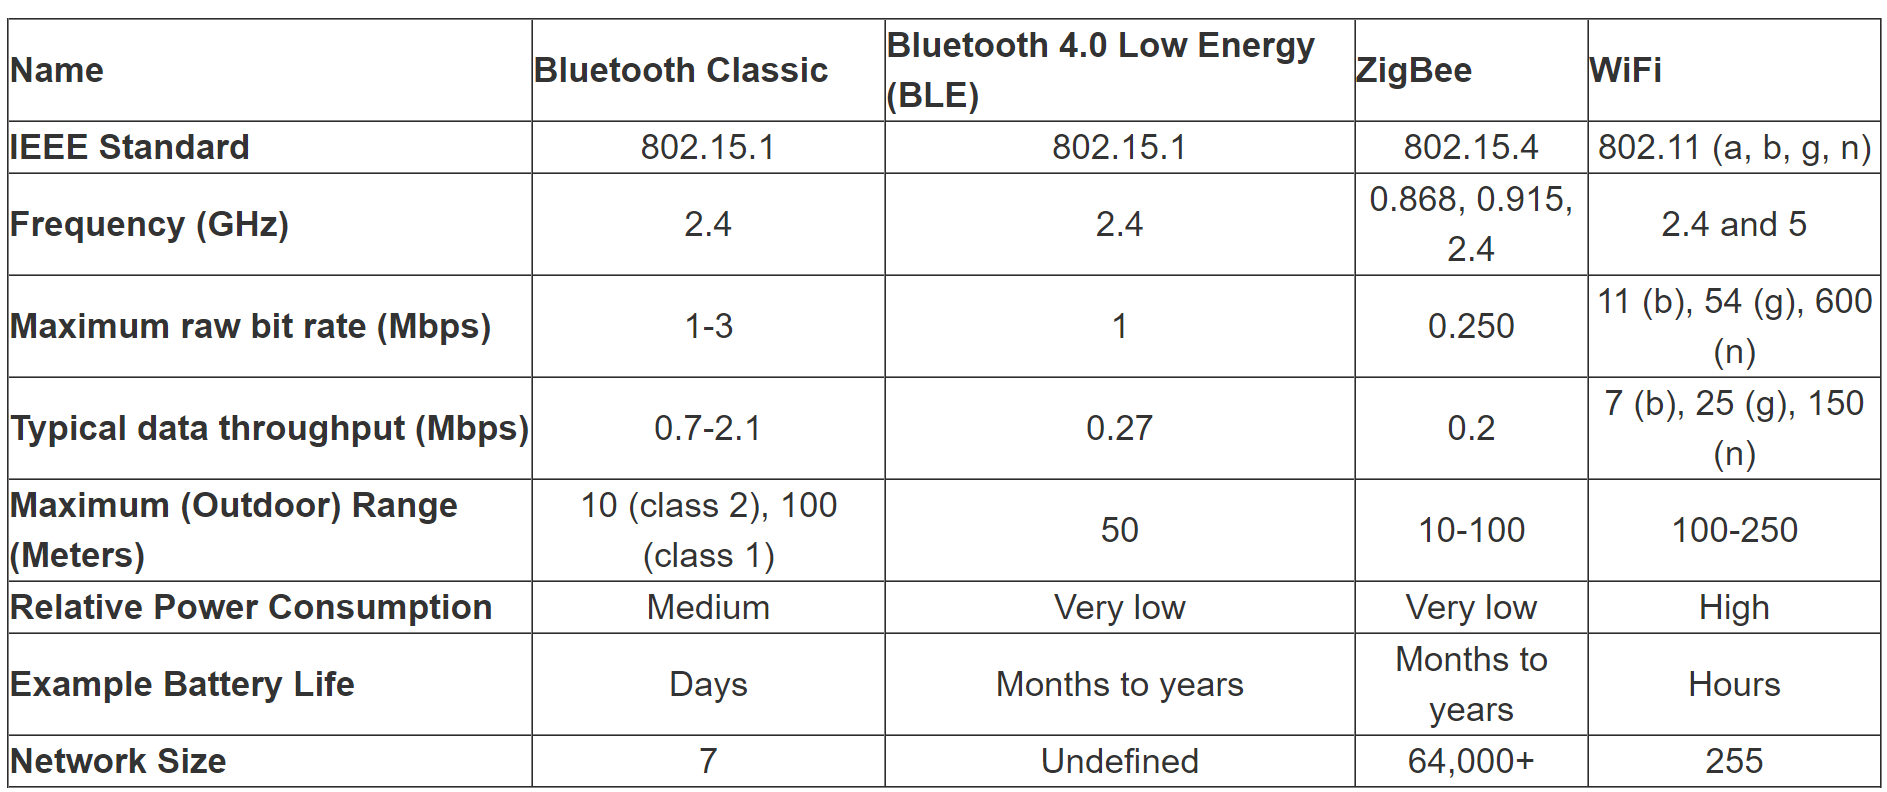
Source: CP IoT System Design Guide, Chapter 4 - Networking
NoteOriginal Bluetooth Serial Port Profile (Alternative View)
Source: CP IoT System Design Guide, Chapter 4 - Networking
921.7 Visual Reference Gallery
NoteVisual: BLE GATT Profile Architecture

GATT defines standardized data organization enabling interoperability across BLE devices from different manufacturers.
NoteVisual: BLE Beacon Broadcast
![]()
Beacons continuously broadcast identifiers that smartphones detect for location-aware services without requiring pairing.
NoteVisual: BLE Connection Flow

The BLE connection process can be quick, but setup time varies widely based on advertising interval, scan duty cycle, and OS scheduling—measure and tune for your application.
NoteVisual: Bluetooth Mesh Relay

Bluetooth Mesh extends BLE for building automation using managed flooding; it supports large networks in theory, but practical size depends on traffic patterns, relay density, and the physical environment.
NoteVisual: BLE Advertising Modes

Advertising modes balance discoverability, connection speed, and battery life for different application requirements.
921.8 Worked Examples
NoteWorked Example: Designing GATT Service Architecture for Environmental Monitoring Station
Scenario: An outdoor environmental monitoring station measures temperature, humidity, barometric pressure, UV index, and air quality (PM2.5). The device connects to a mobile app for configuration and real-time monitoring, and must support firmware updates over BLE (DFU).
Given: - Environmental Sensing Service UUID: 0x181A (Bluetooth SIG standard) - Custom Configuration Service UUID: f47ac10b-58cc-4372-a567-0e02b2c3d479 - DFU Service UUID: 0xFE59 (Nordic standard) - Maximum MTU after negotiation: 247 bytes - Sensor sampling rate: configurable 1-60 seconds - Alert thresholds: user-configurable per measurement
Steps:
- Map measurements to standard characteristics where available:
- Temperature:
0x2A6E(sint16, 0.01°C resolution) - Humidity:
0x2A6F(uint16, 0.01% resolution) - Pressure:
0x2A6D(uint32, 0.1 Pa resolution) - UV Index:
0x2A76(uint8) - PM2.5: Custom characteristic (no SIG standard)
- Temperature:
- Design GATT service hierarchy:
%%{init: {'theme': 'base', 'themeVariables': {'primaryColor': '#2C3E50', 'primaryTextColor': '#fff', 'primaryBorderColor': '#16A085', 'lineColor': '#16A085', 'secondaryColor': '#E67E22', 'tertiaryColor': '#7F8C8D'}}}%%
graph TB
    Device["Environmental Monitoring Device"]

    subgraph EnvSensing["Environmental Sensing Service<br/>0x181A"]
        Temp["Temperature 0x2A6E<br/>[Read, Notify]"]
        TempCCCD["CCCD 0x2902"]
        Humidity["Humidity 0x2A6F<br/>[Read, Notify]"]
        HumCCCD["CCCD 0x2902"]
        Pressure["Pressure 0x2A6D<br/>[Read, Notify]"]
        PresCCCD["CCCD 0x2902"]
        UV["UV Index 0x2A76<br/>[Read, Notify]"]
        UVCCCD["CCCD 0x2902"]
        PM25["PM2.5 Custom<br/>[Read, Notify]"]
        PM25CCCD["CCCD 0x2902"]
    end

    subgraph DevInfo["Device Information Service<br/>0x180A"]
        Mfr["Manufacturer Name<br/>0x2A29 [Read]"]
        Model["Model Number<br/>0x2A24 [Read]"]
        FWRev["Firmware Revision<br/>0x2A26 [Read]"]
        HWRev["Hardware Revision<br/>0x2A27 [Read]"]
    end

    subgraph Battery["Battery Service<br/>0x180F"]
        BattLevel["Battery Level<br/>0x2A19 [Read, Notify]"]
    end

    subgraph Config["Configuration Service<br/>Custom UUID"]
        SampInt["Sampling Interval<br/>[Read, Write]"]
        TempHigh["Temp Alert High<br/>[Read, Write]"]
        TempLow["Temp Alert Low<br/>[Read, Write]"]
        HumHigh["Humidity Alert High<br/>[Read, Write]"]
        DevName["Device Name<br/>[Read, Write]"]
    end

    subgraph DFU["DFU Service<br/>0xFE59"]
        DFUCtrl["DFU Control Point<br/>[Write, Indicate]"]
        DFUPkt["DFU Packet<br/>[Write Without Response]"]
    end

    Device --> EnvSensing
    Device --> DevInfo
    Device --> Battery
    Device --> Config
    Device --> DFU

    Temp --> TempCCCD
    Humidity --> HumCCCD
    Pressure --> PresCCCD
    UV --> UVCCCD
    PM25 --> PM25CCCD

    style Device fill:#2C3E50,stroke:#16A085,stroke-width:3px,color:#fff
    style EnvSensing fill:#16A085,stroke:#2C3E50,stroke-width:2px,color:#fff
    style DevInfo fill:#16A085,stroke:#2C3E50,stroke-width:2px,color:#fff
    style Battery fill:#16A085,stroke:#2C3E50,stroke-width:2px,color:#fff
    style Config fill:#E67E22,stroke:#2C3E50,stroke-width:2px,color:#fff
    style DFU fill:#7F8C8D,stroke:#2C3E50,stroke-width:2px,color:#fff
- Calculate notification payload sizes:
- Combined sensor reading (all 5 values): 2+2+4+1+2 = 11 bytes
- With ATT header (3 bytes): 14 bytes per notification
- Fits easily in default 23-byte MTU
- Design batch mode for efficiency (optional):
- Create aggregate characteristic combining all readings
- Single notification instead of 5 separate ones
- Reduces connection events by 80%
Result: GATT architecture uses 4 services with 16 characteristics. Standard UUIDs ensure compatibility with generic BLE scanner apps. Configuration service enables remote device management. DFU service supports field firmware updates. Aggregate characteristic option reduces power consumption for continuous monitoring.
Key Insight: Use Bluetooth SIG standard service and characteristic UUIDs (16-bit) whenever possible for interoperability. Reserve 128-bit custom UUIDs for application-specific data. Group related configuration parameters in a custom service separate from sensor data for cleaner architecture and access control.
NoteWorked Example: iBeacon Deployment for Museum Indoor Navigation
Scenario: A museum deploys BLE beacons to provide audio guide triggers and indoor navigation. Visitors use the museum app to receive exhibit information when approaching displays. The system must distinguish between 200 exhibit locations across 3 floors with accurate “which exhibit am I near?” detection.
Given: - Beacon format: iBeacon - Proximity UUID: B9407F30-F5F8-466E-AFF9-25556B57FE6D - Major values: Floor numbers (1, 2, 3) - Minor values: Exhibit IDs (001-999) - TX power at 1m reference: -59 dBm (calibrated) - Desired proximity zones: Immediate (<1m), Near (1-3m), Far (3-10m)
Steps:
Design beacon identifier scheme:
- UUID: Single value for entire museum (identifies “this museum” vs others)
- Major = Floor: 0x0001 (Floor 1), 0x0002 (Floor 2), 0x0003 (Floor 3)
- Minor = Exhibit: 0x0001 (Exhibit 001) through 0x00C8 (Exhibit 200)
- Example: Major=2, Minor=47 → Floor 2, Exhibit 47
Calculate RSSI thresholds for proximity zones (using log-distance path loss model):
RSSI = TxPower - 10 * n * log10(distance)

Where n = 2.5 (typical indoor path loss exponent)
TxPower = -59 dBm at 1 meter

At 1m:  RSSI = -59 - 10*2.5*log10(1) = -59 dBm
At 3m:  RSSI = -59 - 10*2.5*log10(3) = -71 dBm
At 10m: RSSI = -59 - 10*2.5*log10(10) = -84 dBm
Set zone thresholds with hysteresis:
- Immediate: RSSI > -55 dBm (exit at -58 dBm)
- Near: RSSI -55 to -73 dBm (exit Near at -76 dBm)
- Far: RSSI -73 to -85 dBm
- Out of range: RSSI < -85 dBm
Implement smoothing algorithm in app:
// Exponential moving average for RSSI smoothing
smoothed_rssi = 0.7 * previous_smoothed + 0.3 * new_rssi

// Require 3 consecutive readings in new zone before triggering
if (consecutive_zone_readings >= 3) {
    trigger_zone_change(current_zone);
}
Plan beacon placement:
- Mount beacons at consistent height (2.5m recommended)
- Aim antenna downward toward visitor standing position
- Space beacons 6-8m apart to minimize overlap
- Place at exhibit center, not edges
Configure advertising parameters:
- Advertising interval: 350 ms (balance discovery vs battery)
- TX power: 0 dBm (adequate for 10m range)
- Expected battery life (CR2032): ~18 months
Result: 200 beacons deployed with systematic Major.Minor addressing. App triggers exhibit content when visitor enters “Near” zone (1-3m) with 3-reading confirmation. Hysteresis prevents zone flapping at boundaries. Smoothed RSSI provides stable proximity classification despite RF variability.
Key Insight: Never promise meter-level accuracy from RSSI alone—design for zone-based proximity (Immediate/Near/Far) rather than precise distances. The iBeacon Major.Minor hierarchy maps naturally to physical hierarchies (building.floor.room or floor.exhibit). Hysteresis and temporal filtering are essential for stable user experience despite RSSI fluctuations from body absorption and multipath.
921.9 Knowledge Check
921.10 What’s Next
In the next chapter, Bluetooth Comprehensive Review, we’ll synthesize all Bluetooth concepts with quiz questions, protocol stack deep-dives, and troubleshooting guidance for real-world deployments.
Key Takeaways: - BLE beacons enable passive proximity experiences without pairing (phones scan advertising packets) - iBeacon vs Eddystone is usually a platform/feature choice (UID/URL/ephemeral IDs, app ecosystem, backend mapping) - Advertising interval and TX power trade off discovery latency against battery life - Bluetooth Mesh suits multi-hop active control (lighting/HVAC) while beacons suit passive proximity context - Real deployments benefit from site surveys, calibration, and clear privacy/consent design