%%{init: {'theme': 'base', 'themeVariables': { 'primaryColor': '#2C3E50', 'primaryTextColor': '#fff', 'primaryBorderColor': '#16A085', 'lineColor': '#16A085', 'secondaryColor': '#E67E22', 'tertiaryColor': '#ecf0f1', 'nodeBorder': '#2C3E50'}}}%%
sequenceDiagram
participant Client
participant Server
Note over Client,Server: HTTP Polling (Inefficient)
loop Every second
Client->>Server: GET /sensor/data
Server-->>Client: 200 OK (headers: 500B)
end
Note over Client,Server: WebSocket (Efficient)
Client->>Server: HTTP Upgrade Request
Server-->>Client: 101 Switching Protocols
Server->>Client: Data frame (6B header)
Server->>Client: Data frame (6B header)
Server->>Client: Data frame (6B header)
848 Wi-Fi Implementation: HTTP and WebSocket
848.1 Learning Objectives
By the end of this chapter, you will be able to:
- Build HTTP REST APIs: Implement ESP32 web servers with RESTful endpoints for sensor data and device control
- Create HTTP Clients: Send HTTP GET/POST requests to cloud services and local servers
- Implement WebSocket Communication: Establish real-time bidirectional data streaming
- Understand Protocol Trade-offs: Choose between HTTP, WebSocket, and MQTT for different IoT scenarios
- Analyze Network Capacity: Evaluate Wi-Fi throughput and latency for IoT deployments
TipFor Beginners: HTTP vs WebSocket for IoT
What is this chapter? Web communication protocols for IoT - when to use HTTP REST APIs vs real-time WebSocket streaming.
HTTP REST (Request/Response): - Best for: On-demand queries, infrequent updates, web integration - Pattern: Client requests, server responds - Overhead: High (headers each request)
WebSocket (Persistent Connection): - Best for: Real-time dashboards, live sensor streaming, low-latency control - Pattern: Bidirectional frames - Overhead: Low (2-14 bytes per message)
Quick Decision Guide:
| Scenario | Use HTTP | Use WebSocket |
|---|---|---|
| Read sensor on demand | Yes | No |
| Live sensor dashboard | No | Yes |
| Firmware update check | Yes | No |
| Remote control (<50ms) | No | Yes |
| Mobile app API | Yes | Either |
848.2 Prerequisites
Before diving into this chapter, you should be familiar with:
- Wi-Fi Implementation: ESP32 Basics: Basic Wi-Fi connection and configuration
- HTTP Protocol Basics: Understanding of HTTP request/response patterns
848.3 HTTP REST API on ESP32
TipInteractive Simulator: ESP32 Web Server (HTTP REST API)
What This Simulates: ESP32 hosting a web server with RESTful API for sensor data and device control
HTTP REST API Pattern:
Client (Browser/App)         ESP32 Web Server
      |                            |
      |--- GET /api/temperature -->|
      |                            | Read sensor
      |<-- 200 OK {"temp":23.5} --|
      |                            |
      |--- POST /api/led --------->|
      |    {"state":"on"}          | Control actuator
      |<-- 200 OK {"status":"on"}-|
RESTful Endpoints:
GET    /api/temperature   - Read temperature value
GET    /api/humidity      - Read humidity value
POST   /api/led           - Control LED (on/off)
GET    /api/status        - Get device status
PUT    /api/config        - Update device configuration
How to Use: 1. Click Start Simulation 2. Wait for “HTTP server started” message 3. Note the IP address (simulated: 192.168.1.100) 4. See GET/POST requests being processed 5. Observe JSON responses with sensor data
848.4 WebSocket Real-Time Communication
TipInteractive Simulator: WebSocket Real-Time Communication
What This Simulates: ESP32 WebSocket server providing real-time bidirectional sensor data streaming
WebSocket vs HTTP:
WebSocket Handshake:
1. HTTP Upgrade Request:
   GET /ws HTTP/1.1
   Upgrade: websocket
   Connection: Upgrade
   Sec-WebSocket-Key: dGhlIHNhbXBsZSBub25jZQ==

2. Server Upgrade Response:
   HTTP/1.1 101 Switching Protocols
   Upgrade: websocket
   Connection: Upgrade
   Sec-WebSocket-Accept: s3pPLMBiTxaQ9kYGzzhZRbK+xOo=

3. Bidirectional frames exchange:
   Server - {"temp":23.5,"time":1234567890}
   Client - {"command":"led_on"}
   Server - {"status":"led_on","success":true}
How to Use: 1. Click Start Simulation 2. WebSocket server starts on ws://192.168.1.100:81 3. Watch real-time sensor data streaming every second 4. See client commands being processed instantly 5. Observe persistent connection (no reconnection overhead)
848.5 Wi-Fi Network Capacity Analysis
848.5.1 Throughput and Performance
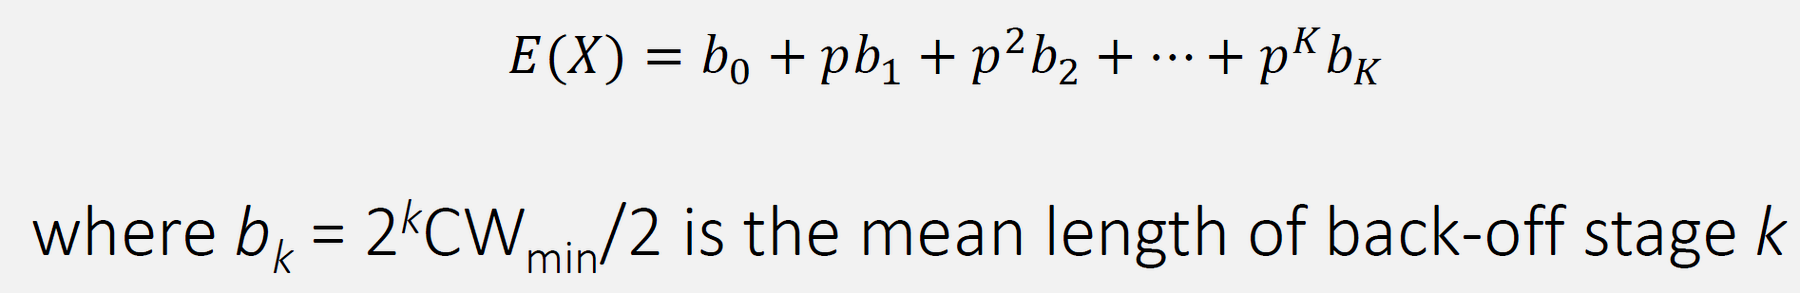
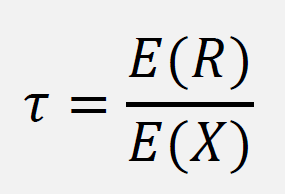
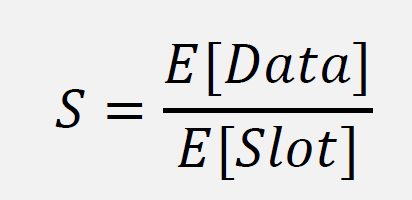
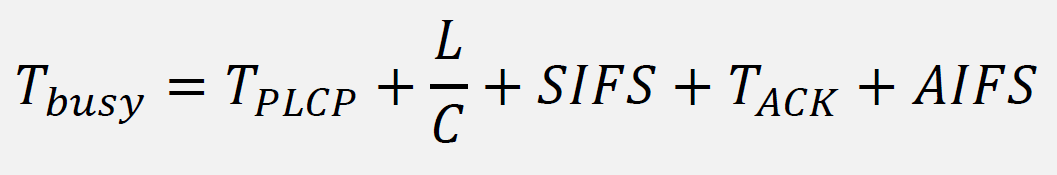
848.5.2 CSMA/CA Model Equations
![Equation for average slot duration E[Slot] in 802.11 CSMA/CA based on idle probability P_idle and busy probability (1-P_idle), expressed using attempt probability tau and number of stations n.](../images/Throughput5.png)
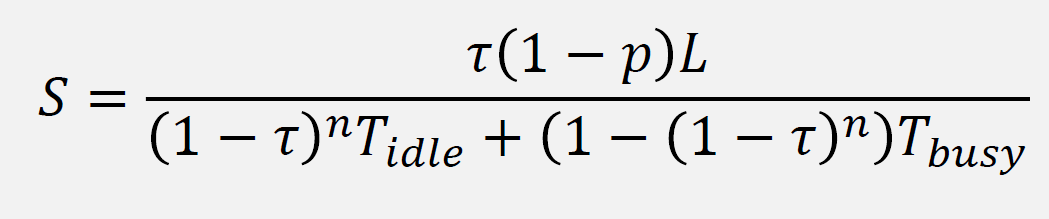
NoteText Version of CSMA/CA Model Equations
For accessibility, here is one common Bianchi-style saturated DCF model form. Symbol choices vary across sources, so focus on the structure and assumptions (saturation traffic, fixed frame sizes, and simplified timing).
Definitions:
\[ P_{\text{idle}} = (1 - \tau)^n \qquad P_{\text{tr}} = 1 - P_{\text{idle}} \qquad P_{\text{s}} = n\,\tau\,(1-\tau)^{n-1} \]
Average slot duration:
\[ \mathbb{E}[\text{Slot}] = P_{\text{idle}}\,\sigma + P_{\text{s}}\,T_{\text{s}} + (P_{\text{tr}} - P_{\text{s}})\,T_{\text{c}} \]
Throughput:
\[ S = \frac{P_{\text{s}}\,L}{\mathbb{E}[\text{Slot}]} \]
Where \(n\) is the number of contending stations, \(\tau\) is the per-slot transmission probability per station, \(L\) is payload length (bits), \(\sigma\) is the idle slot duration, \(T_{\text{s}}\) is the time for a successful transmission, and \(T_{\text{c}}\) is the time lost in a collision. Use this as an intuition-building model; validate capacity with real measurements (airtime utilization, retries, throughput, and latency).
What to Measure (recommended): - Airtime utilization and retry rate (from AP/controller if available) - End-to-end latency/jitter and packet loss (ping or application-level probes) - Application-layer throughput (e.g., iperf3 or representative traffic) - Roaming/handoff behavior if devices move
Example Output Format (illustrative):
=== Wi-Fi Capacity Check ===

Clients: <N>
Observed throughput: <Mbps>
Latency (p50/p95): <ms>
Retry rate: <percent> (if available)

Recommendations:
  - If airtime is high: add AP capacity, reduce client count per AP, or use a wider plan (more APs, better placement)
  - If retries are high: improve RSSI/SNR (placement/antennas), reduce interference, or change channels/bands
  - If roaming is unstable: increase overlap, tune thresholds, and use fast-roaming features where supported
Key Concepts Demonstrated: - PHY rate vs usable throughput: overhead, retries, and contention reduce application throughput - Contention effects: more active stations increase backoff and collision probability under load - Capacity planning: design around airtime and worst-case locations, not just headline Mbps - Measurement-first workflow: validate with iperf3, latency probes, and AP stats
848.6 Visual Reference Gallery
Explore these AI-generated figures that illustrate Wi-Fi implementation concepts for IoT devices.
NoteWi-Fi Module Architecture

NoteWi-Fi Roaming and Handoff

NoteWi-Fi Mesh Network Topology

848.7 Summary
This chapter covered HTTP and WebSocket communication for Wi-Fi IoT:
- HTTP REST APIs: Building ESP32 web servers with RESTful endpoints for sensor data and device control, including proper status codes and JSON formatting
- HTTP Client Communication: Sending GET/POST requests to cloud services and local servers with timeout handling
- WebSocket Real-Time Streaming: Persistent bidirectional connections with 95% bandwidth reduction compared to HTTP polling
- Protocol Selection: When to use HTTP (on-demand, infrequent) vs WebSocket (real-time, continuous) vs MQTT (pub/sub, low power)
- Network Capacity Analysis: Understanding throughput, contention, and capacity planning for IoT Wi-Fi deployments
848.8 What’s Next
The next chapter provides a Comprehensive Wi-Fi IoT Lab with a complete production-ready ESP32 implementation demonstrating connection management, RSSI monitoring, power modes, HTTP communication, and mDNS service discovery.