481 Topology Management Techniques
481.1 Learning Objectives
By the end of this chapter, you will be able to:
- Design event-aware topologies: Reconfigure network structure dynamically in response to detected events
- Apply InTSeM principles: Use information-theoretic analysis to eliminate redundant transmissions
- Calculate entropy metrics: Determine which sensor readings provide significant new information
- Integrate social sensing: Leverage social media signals to adjust WSN duty cycles proactively
- Implement probabilistic duty cycling: Adapt sampling rates based on estimated event probability
Core concept: Smart topology management adapts network structure and transmission rates based on events, information content, and external signals—not just fixed schedules. Why it matters: InTSeM can reduce transmissions by 50-90% while still capturing all important data; social sensing enables proactive adaptation before events occur. Key takeaway: Transmit only when readings provide new information (high entropy), and use external signals to anticipate when intensive monitoring is needed.
481.2 Prerequisites
Before diving into this chapter, you should be familiar with:
- Duty Cycle Fundamentals: Basic duty cycling concepts and trade-offs
- Wireless Sensor Networks: Network topologies and multi-hop communication
- Fog Fundamentals: Edge decision-making for local adaptation
481.3 Event-Aware Topology Management
WSNs often monitor discrete events (fire detection, intrusion, equipment failure). Event-driven topology management optimizes network structure for event detection and reporting.
481.3.1 Event Characteristics

481.3.2 Implementation Example: Forest Fire Detection
// Event-aware topology management for fire detection
#include <Arduino.h>

const float FIRE_THRESHOLD = 50.0;  // °C
const int EVENT_RADIUS = 100;       // meters

enum NodeState {
    SLEEPING,
    MONITORING,
    EVENT_ACTIVE
};

struct Node {
    int id;
    float x, y;  // Position
    NodeState state;
    float sample_rate;  // Hz
};

class EventAwareTopology {
private:
    Node* nodes;
    int num_nodes;

public:
    EventAwareTopology(Node* n, int count) : nodes(n), num_nodes(count) {}

    void detectEvent(int detector_node_id, float temperature) {
        if (temperature > FIRE_THRESHOLD) {
            Serial.printf("FIRE DETECTED by Node %d: %.1f°C\n",
                         detector_node_id, temperature);

            // Trigger topology reconfiguration
            reconfigureForEvent(detector_node_id);
        }
    }

    void reconfigureForEvent(int event_node_id) {
        Node& event_node = nodes[event_node_id];

        Serial.println("Reconfiguring topology for event...");

        // Activate all nodes within event radius
        for (int i = 0; i < num_nodes; i++) {
            float distance = calculateDistance(event_node, nodes[i]);

            if (distance <= EVENT_RADIUS) {
                if (nodes[i].state == SLEEPING) {
                    // Wake up sleeping node
                    wakeNode(i);
                }

                // Increase sampling rate for event monitoring
                nodes[i].sample_rate = 1.0;  // 1 Hz (high rate)
                nodes[i].state = EVENT_ACTIVE;

                Serial.printf("  Activated Node %d (distance: %.1fm)\n",
                             i, distance);
            }
        }

        // Establish redundant paths to sink
        establishMultiPath(event_node_id);
    }

    float calculateDistance(Node& a, Node& b) {
        return sqrt((a.x - b.x) * (a.x - b.x) +
                    (a.y - b.y) * (a.y - b.y));
    }

    void wakeNode(int node_id) {
        // Send wake-up signal
        Serial.printf("  Sending wake-up to Node %d\n", node_id);
        // Implementation: send radio wake-up packet
    }

    void establishMultiPath(int source_id) {
        // Create redundant routing paths from event node to gateway
        Serial.printf("  Establishing multi-path routing from Node %d\n", source_id);
        // Implementation: configure alternate routes
    }

    void normalOperation() {
        // Return to normal sparse topology
        for (int i = 0; i < num_nodes; i++) {
            if (nodes[i].state == EVENT_ACTIVE) {
                nodes[i].state = MONITORING;
                nodes[i].sample_rate = 0.01;  // 0.01 Hz (low rate: every 100s)
                Serial.printf("Node %d returned to normal operation\n", i);
            }
        }
    }
};

// Usage
void setup() {
    Serial.begin(115200);

    // Define sensor network
    Node nodes[5] = {
        {0, 0, 0, MONITORING, 0.01},      // Node 0 at origin
        {1, 50, 30, SLEEPING, 0},         // Node 1
        {2, 80, 60, MONITORING, 0.01},    // Node 2
        {3, 40, 90, SLEEPING, 0},         // Node 3
        {4, 120, 50, MONITORING, 0.01}    // Node 4
    };

    EventAwareTopology topology(nodes, 5);

    // Simulate event detection
    float temperature = 55.0;  // Fire detected!
    topology.detectEvent(0, temperature);

    // Later: event ends
    delay(60000);  // 60 seconds
    topology.normalOperation();
}

void loop() {
    // Continuous monitoring
}
Benefits:
- Energy efficiency: Sleep nodes when no events
- Event detection: High-density sensing during events
- Reliability: Redundant paths for critical event data
- Adaptability: Dynamic reconfiguration as events evolve
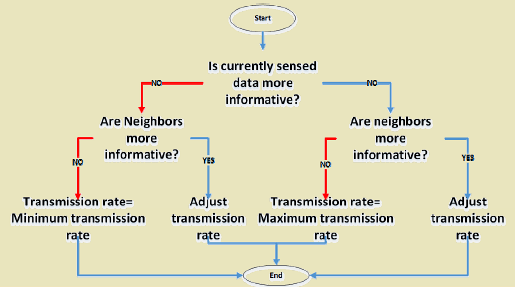
481.4 Information-Theoretic Self-Management (InTSeM)
InTSeM controls node transmission rates based on information content to minimize redundant transmissions.
481.4.1 InTSeM Concept
Key Insight: Not all sensor readings contain equal information.

Example:
Temperature sensor in stable environment:
- Reading 1: 25.0°C → Information: Medium (first reading)
- Reading 2: 25.1°C → Information: Low (predictable, small change)
- Reading 3: 25.0°C → Information: Very Low (same as before)
- Reading 4: 35.0°C → Information: HIGH (unexpected! transmit!)
InTSeM skips transmitting readings 2-3 (low information), saving energy.
481.4.2 Information Content Calculation
Entropy-based measurement:
\[ I(x) = -\log_2(P(x)) \]
Where:
- \(I(x)\) = Information content of reading \(x\)
- \(P(x)\) = Probability of observing reading \(x\) based on history
High probability (expected value) → Low information Low probability (surprising value) → High information
481.4.3 Example Output
InTSeM Transmission Decisions:
Reading | Information | Transmit?
--------|-------------|----------
   25.0 |        2.65 | YES      (First reading)
   25.1 |        2.58 | YES      (Still learning)
   25.0 |        1.98 | NO       (Predictable)
   24.9 |        2.58 | YES      (Less common)
   25.1 |        1.58 | NO       (Now expected)
   25.0 |        1.32 | NO       (Very predictable)
   35.0 |        5.46 | YES      (Anomaly! High info)
   25.2 |        2.81 | YES      (After anomaly, uncertain)
   25.1 |        1.19 | NO       (Back to normal)
   25.0 |        0.85 | NO       (Predictable)

Transmissions: 5/10
Reduction: 50.0%
Benefits:
- 50% transmission reduction in stable environments
- Anomaly detection (high information = unusual event)
- Adaptive: Adjusts to changing conditions
- No data loss: All high-information readings transmitted
Trade-off:
- Computation cost: Information calculation requires CPU
- Memory: Must store history
- Latency: May delay some transmissions
481.5 Knowledge Check
481.6 Social Sensing and Duty Cycle Management
Social sensing integrates data from social media platforms to improve WSN efficiency, particularly for rare event monitoring.
481.6.1 Problem: Rare Event Monitoring
Challenge:
Traditional WSNs sample continuously, wasting energy when event is unlikely:
Submarine monitoring WSN:
- Submarine passage: 0.01% of time (very rare)
- Sensors active 100% of time monitoring for rare event
- 99.99% of sensing cycles find nothing → wasted energy
481.6.2 Probabilistic Duty Cycle (PDC)
Concept: Adjust duty cycle based on event occurrence probability learned from social media.

481.6.3 Example: Protest/Riot Detection for Urban Surveillance
Urban surveillance systems monitor public spaces for security incidents, but events like protests or riots are rare (occurring <0.1% of time). Running cameras and acoustic sensors 24/7 wastes energy on empty streets.
Social Sensing Integration:
- Monitor Twitter/X, Facebook, Instagram for keywords: “protest”, “rally”, “demonstration”, “gathering” + city name
- NLP analysis: Extract event time, location, expected crowd size
- Estimate event probability:
- 0 mentions → P = 1% (baseline)
- 10-50 mentions → P = 20% (event announced)
- 50+ mentions, real-time posts → P = 80% (event unfolding)
- Adjust WSN duty cycle based on probability
Scenario Comparison:
| Scenario | Social Media Activity | Event Probability | Duty Cycle | Sampling Interval | Energy vs Baseline |
|---|---|---|---|---|---|
| Normal day | 0 relevant posts | 1% | 1% | 1 sample/100s | 1× |
| Protest announced (3 days ahead) | 30 posts planning event | 20% | 20% | 1 sample/5s | 20× |
| Event unfolding | 80+ real-time posts, livestreams | 80% | 50% | 1 sample/2s | 50× |
Energy Calculation (1 camera node, 1 week):
- Without social sensing (100% duty cycle): 7 days × 24 h × 500 mA = 84 Ah
- With social sensing:
- Normal (6.5 days @ 1%): 6.5 × 24 × 5 mA = 0.78 Ah
- Event (0.5 days @ 50%): 0.5 × 24 × 250 mA = 3.0 Ah
- Total: 3.78 Ah → 95.5% energy savings!
Example Output:
Social Sensing Duty Cycle Adaptation:

Scenario: Normal Day
  Relevant social media mentions: 0
  Estimated event probability: 1.0%
  Adjusted duty cycle: 1.0%
  Sampling interval: 100.0 seconds
  Energy consumption vs baseline: 1.0x

Scenario: Protest Announced
  Relevant social media mentions: 30
  Estimated event probability: 20.0%
  Adjusted duty cycle: 20.0%
  Sampling interval: 5.0 seconds
  Energy consumption vs baseline: 20.0x

Scenario: Major Event Unfolding
  Relevant social media mentions: 80
  Estimated event probability: 80.0%
  Adjusted duty cycle: 50.0%
  Sampling interval: 2.0 seconds
  Energy consumption vs baseline: 50.0x
Benefits:
- Energy savings: Low duty cycle (99%) when no event expected
- Event capture: High duty cycle (50x) when event likely
- Proactive adaptation: Increase sampling before event detected by WSN
- Crowdsourced intelligence: Leverage millions of social media users
Challenges:
- False positives: Social media rumors may not reflect reality
- Privacy: Social media monitoring raises concerns
- Latency: Social media analysis adds processing delay
- Connectivity: Requires internet access for social media APIs
481.7 Cross-Hub Connections
Interactive Simulations:
- Duty Cycle Calculator: Experiment with different duty cycles, battery capacities, and current consumption to see impact on lifetime
- TSP Route Optimizer: Visualize drone flight path planning for disconnected sensor nodes using different TSP algorithms
- Energy Budget Simulator: Model complete WSN energy consumption including wake overhead, sensing, transmission, and sleep modes
Practice Quizzes:
- Architecture Quiz: Test your understanding of duty-cycling strategies, InTSeM, and event-aware topology management
- Energy Optimization Quiz: Questions on battery lifetime calculations, duty cycle trade-offs, and power budgeting
Video Tutorials:
- WSN Energy Optimization: Demonstration of duty-cycling impact on battery life with real hardware
- Drone-Assisted Data Collection: CoRAD implementation using DJI Tello drone and ESP32 sensors
- Social Sensing Applications: Case study of Twitter-integrated urban surveillance for event-aware sampling
Knowledge Gaps to Explore:
- Why do some WSNs fail despite good duty-cycling?: Common pitfalls in duty cycle implementation (clock drift, neighbor desynchronization)
- When should you use drones vs dense deployment?: Cost-benefit analysis of CoRAD vs adding more sensor nodes
- How to validate information content thresholds?: Tuning InTSeM parameters for different sensing applications
481.9 Visual Reference Gallery

S-MAC protocol with synchronized sleep schedules and adaptive duty cycling.

CSMA/CA mechanism for collision avoidance in wireless sensor networks.

Topology control strategies balancing connectivity, coverage, and energy efficiency.
481.10 Summary
This chapter covered advanced topology management techniques for wireless sensor networks:
- Event-aware topology: Dynamically reconfiguring network structure when events are detected, activating sleeping nodes and increasing sampling rates in event areas
- Information-Theoretic Self-Management (InTSeM): Reducing transmissions by 50-90% by calculating information content and transmitting only high-information readings
- Entropy-based decisions: Using probability models to determine which sensor readings provide significant new information versus predictable redundant data
- Social sensing integration: Leveraging social media analysis to estimate event probabilities and adjust sensor duty cycles proactively before events occur
- Probabilistic Duty Cycle (PDC): Optimizing energy consumption for rare event monitoring by adapting sampling rates from 1% baseline to 50% during likely events
481.11 Phantom Figure Gallery
The following AI-generated figures provide alternative visual representations of concepts covered in this chapter.
481.11.1 Duty Cycling Overview


481.11.2 MAC Protocols


481.11.3 Trickle Algorithm

481.11.4 Topology Control


481.12 What’s Next
Having completed duty-cycling and topology management, continue to Sensing as a Service to learn how sensor networks can be offered as cloud-based services, enabling new business models and applications.