%% fig-cap: "Datasheet Reading Priority by Project Phase"
%% fig-alt: "Timeline showing which datasheet sections matter most at each project phase. Feasibility phase focuses on electrical specs (voltage, current) and key performance specs to validate concept. Prototyping phase adds timing diagrams, pinouts, and application circuits. Integration phase emphasizes interface details, register maps, and programming examples. Production phase focuses on absolute max ratings, quality grades, and reliability data. Each phase builds on previous knowledge."
%%{init: {'theme': 'base', 'themeVariables': { 'primaryColor': '#2C3E50', 'primaryTextColor': '#fff', 'primaryBorderColor': '#16A085', 'lineColor': '#16A085', 'secondaryColor': '#E67E22', 'tertiaryColor': '#fff', 'fontSize': '11px'}}}%%
graph TB
subgraph Phase1["1. FEASIBILITY"]
F1["Electrical: Voltage, Current"]
F2["Performance: Range, Accuracy"]
F3["Cost & Availability"]
end
subgraph Phase2["2. PROTOTYPING"]
P1["Pinout & Package"]
P2["Application Circuits"]
P3["Timing Diagrams"]
end
subgraph Phase3["3. INTEGRATION"]
I1["Register Maps"]
I2["Communication Protocols"]
I3["Code Examples"]
end
subgraph Phase4["4. PRODUCTION"]
PR1["Absolute Max Ratings"]
PR2["Quality & Reliability"]
PR3["Ordering Information"]
end
Phase1 --> Phase2 --> Phase3 --> Phase4
style F1 fill:#16A085,stroke:#2C3E50,color:#fff
style F2 fill:#16A085,stroke:#2C3E50,color:#fff
style P1 fill:#2C3E50,stroke:#16A085,color:#fff
style P2 fill:#2C3E50,stroke:#16A085,color:#fff
style I1 fill:#E67E22,stroke:#2C3E50,color:#fff
style I2 fill:#E67E22,stroke:#2C3E50,color:#fff
style PR1 fill:#7F8C8D,stroke:#2C3E50,color:#fff
style PR2 fill:#7F8C8D,stroke:#2C3E50,color:#fff
1628 Accelerometer Specification Case Study
1628.1 Learning Objectives
By the end of this chapter, you will be able to:
- Analyze real-world datasheets: Walk through all sections of an accelerometer specification sheet
- Interpret electrical specifications: Understand voltage, current, and ratiometric output calculations
- Read performance metrics: Evaluate sensitivity, noise density, and bandwidth specifications
- Understand mechanical specifications: Package dimensions, pin configurations, and mounting requirements
- Apply timing and temperature specs: Account for startup time and temperature drift in designs
1628.2 Prerequisites
Before diving into this chapter, you should be familiar with:
- Specification Sheet Fundamentals: Understanding of datasheet sections and vocabulary
- Sensor Fundamentals and Types: Familiarity with sensor parameters (accuracy, resolution, range)
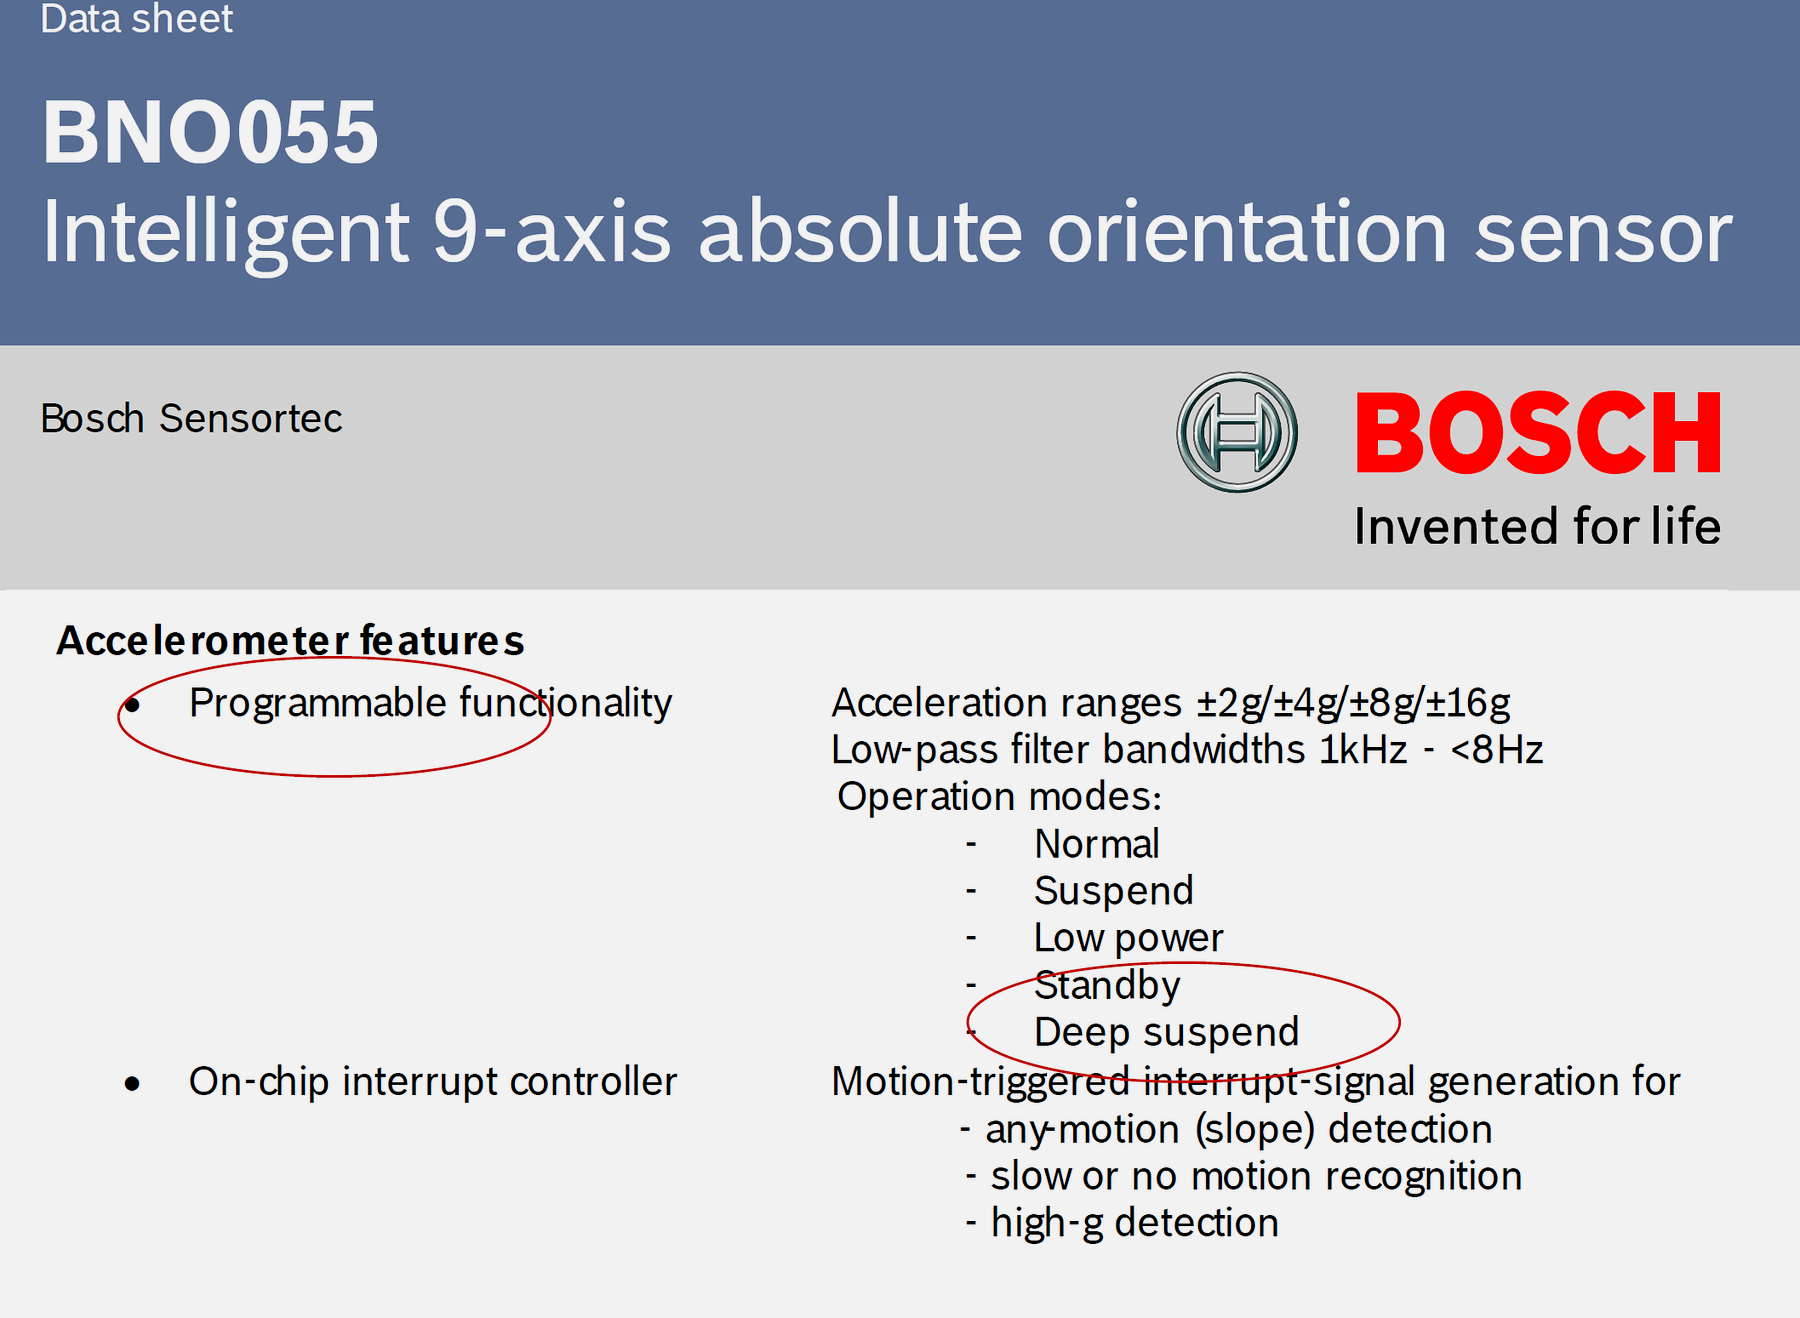
1628.3 Case Study: Accelerometer Specification Sheet
Let’s examine a real-world example: the +/-2g Tri-axis Analog Accelerometer specification sheet.
1628.3.1 Product Description
Key Information:
- Product Name: Tri-axis Analog Accelerometer
- Measurement Range: +/-2g (where g = 9.81 m/s^2)
- Output Type: Analog voltage (ratiometric to supply voltage)
- Axes: X, Y, Z (three-dimensional acceleration measurement)
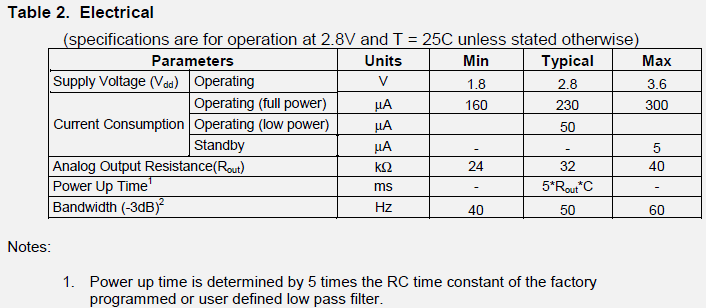
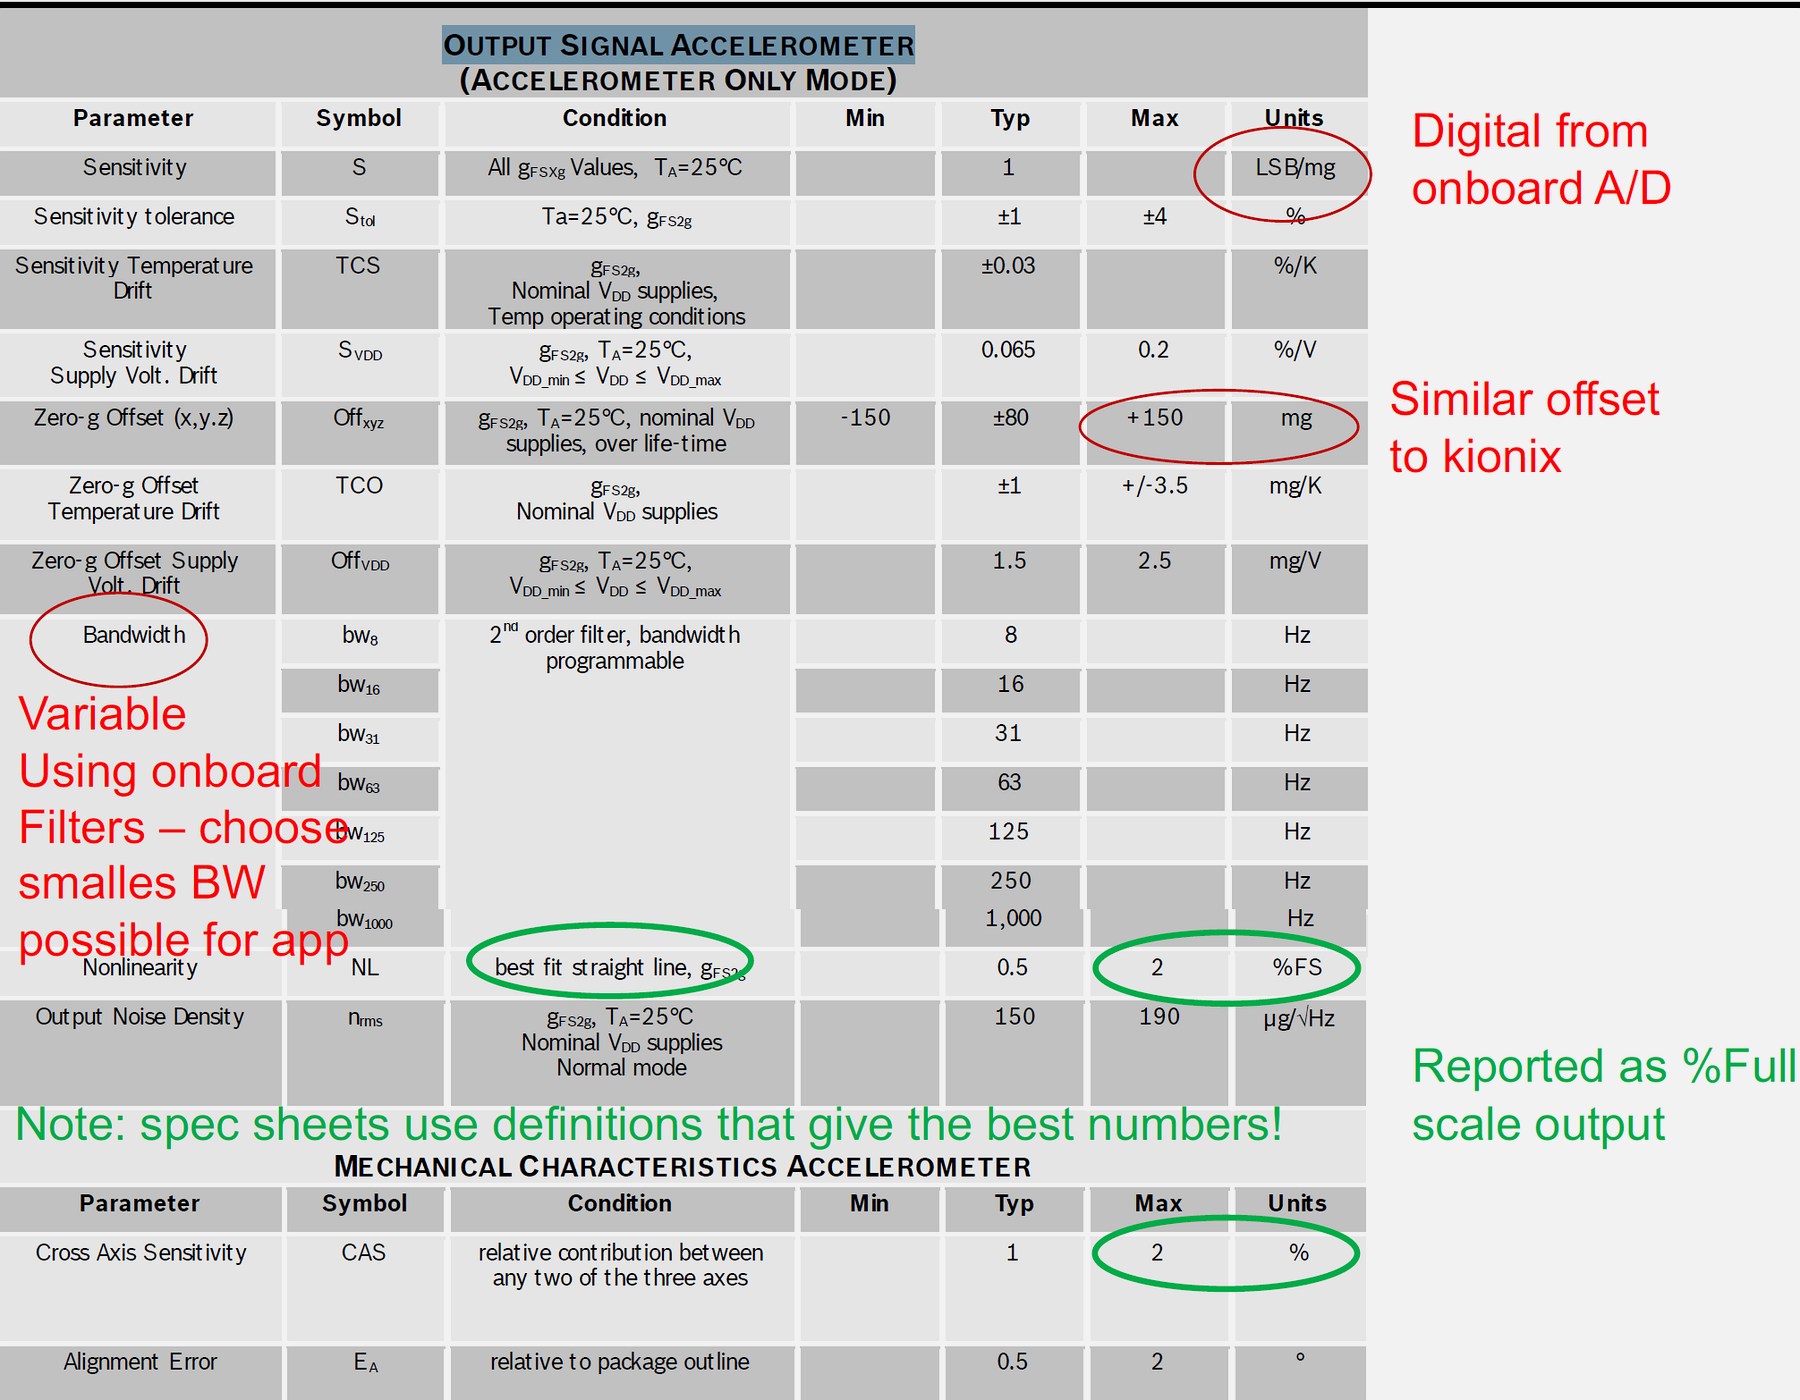
1628.3.2 Electrical Characteristics
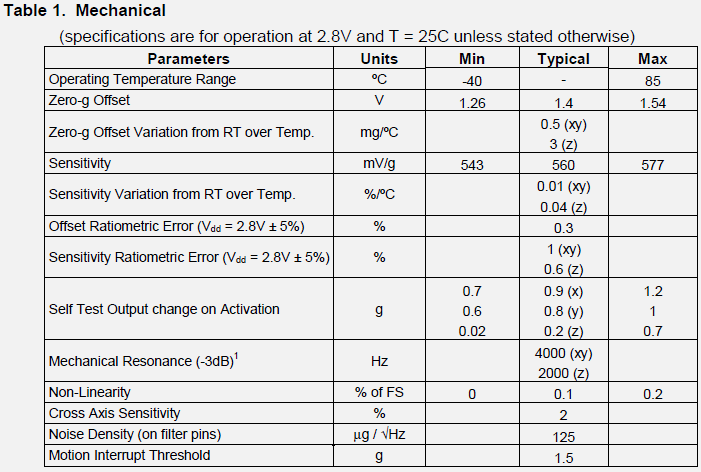
Critical Parameters:
| Parameter | Value | Meaning |
|---|---|---|
| Supply Voltage (Vdd) | 2.2V - 3.6V | Operating voltage range |
| Supply Current | 350 uA (typical) | Current consumption during operation |
| Output Voltage | Vdd/2 +/- sensitivity x acceleration | Centered at half supply voltage |
| Sensitivity | 800 mV/g (typical @ 3.0V) | Output change per g of acceleration |
Example Calculation:
If Vdd = 3.0V and measuring +1g on X-axis:
Vout_x = (3.0V / 2) + (0.8 V/g x 1g)
       = 1.5V + 0.8V
       = 2.3V
1628.3.3 Performance Specifications
Key Performance Metrics:
- Measurement Range: +/-2g
- Maximum measurable acceleration: 2 x 9.81 m/s^2 = 19.62 m/s^2
- Suitable for: Human motion, orientation sensing, gentle impacts
- Sensitivity: 800 mV/g @ Vdd = 3.0V
- Higher sensitivity = better resolution for small accelerations
- Lower range devices typically have higher sensitivity
- Noise Density: ~150 ug/sqrt(Hz)
- Lower noise = better precision
- Impacts minimum detectable acceleration
- Bandwidth: 1600 Hz (typical)
- Maximum frequency of acceleration changes that can be measured
- Important for vibration monitoring, impact detection
1628.3.4 Mechanical Specifications
Package Information:
- Package Type: LGA-16 (Land Grid Array, 16 pins)
- Dimensions: 3mm x 3mm x 1mm
- Weight: ~50 mg
- Mounting: Surface mount (SMD)
Axis Orientation:
- X, Y, Z axes clearly marked on package
- Important for correct installation and interpretation
1628.3.5 Timing Diagrams
Start-up and Response:
- Turn-on Time: Time from power-up to valid output (~2ms typical)
- Response Time: How quickly output changes with acceleration
- Important for applications requiring fast response (e.g., airbag deployment)
1628.3.6 Temperature Characteristics
Temperature Dependency:
- Operating Range: -40C to +85C
- Sensitivity Temperature Coefficient: +/-0.02% / C
- Zero-g Offset Temperature Coefficient: +/-0.5 mg / C
Impact on Design:
Temperature change: 25C to 85C = 60C difference
Zero-g offset drift: 60C x 0.5 mg/C = 30 mg error
1628.3.7 Application Circuit
Supporting Components:
- Decoupling Capacitors: 0.1uF near Vdd pin (noise filtering)
- Output Capacitors: Optional filtering on outputs
- Pull-up/Pull-down: Depending on interface requirements
1628.3.8 Pin Configuration
Pin Functions:
- Vdd: Power supply input
- GND: Ground reference
- X_OUT, Y_OUT, Z_OUT: Analog acceleration outputs
- ST: Self-test pin (applies internal force to verify operation)
- NC: No connection
1628.3.9 Ordering Information
Part Number Variations:
- Different ranges: +/-2g, +/-4g, +/-8g, +/-16g
- Different interfaces: Analog, I2C, SPI
- Different packages: LGA, QFN, DIP
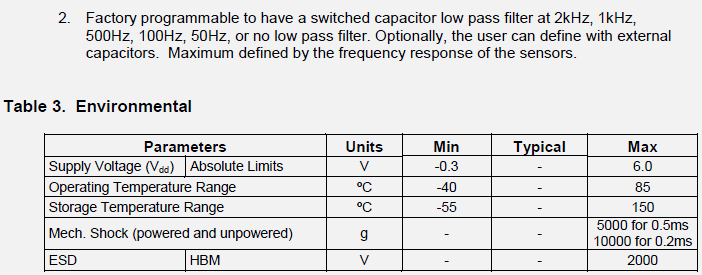
1628.3.10 Recommended Operating Conditions
Critical Operating Parameters:
- Supply Voltage Range: 2.2V - 3.6V (absolute max: -0.3V to 4.0V)
- Storage Temperature: -40C to +125C
- ESD Sensitivity: 2kV HBM (Human Body Model)
1628.4 Key Specification Parameters

NoteVariant View: Datasheet Reading Priority by Project Phase
This flow variant shows which datasheet sections to focus on at different phases of your IoT project, from initial feasibility through production.
1628.4.1 Understanding Measurement Range
Range Selection Criteria:

Trade-off Relationship:
Larger Range -> Lower Sensitivity -> Lower Resolution
Smaller Range -> Higher Sensitivity -> Higher Resolution
1628.4.2 Understanding Accuracy vs Precision

1628.5 Accelerometer Specification Visualizations
The following AI-generated diagrams provide enhanced visualizations of accelerometer specification concepts to supplement the datasheet analysis above.


1628.6 Summary
Key Takeaways from the Accelerometer Case Study:
- Electrical characteristics define power requirements and output behavior
- Supply voltage range determines compatibility
- Ratiometric output simplifies ADC integration
- Current consumption impacts battery life
- Performance specifications determine measurement capability
- Range and sensitivity trade-off (larger range = lower sensitivity)
- Noise density limits minimum detectable signal
- Bandwidth determines frequency response
- Mechanical specifications affect physical integration
- Package type and dimensions for PCB layout
- Axis orientation for correct measurement direction
- Pin configuration for circuit design
- Temperature characteristics require compensation
- Sensitivity and offset drift with temperature
- Operating range must cover deployment environment
- Factory or runtime calibration may be needed
- Application circuits show recommended implementation
- Decoupling capacitors for noise filtering
- Reference designs accelerate development
1628.7 What’s Next
Now that you understand how to read accelerometer datasheets in detail, continue to Sensor Selection Process to learn how to systematically compare multiple components and make optimal selection decisions for your IoT projects.
Related Chapters:
- Specification Sheet Fundamentals - Basic datasheet concepts
- Sensor Selection Process - Component comparison methodology
- Automotive Applications - Industry-specific sensor requirements