162  The Seven-Level IoT Architecture

162.1 Learning Objectives

By the end of this chapter, you will be able to:

  • Apply the 7-Level IoT Reference Model: Map IoT system components to the Cisco reference architecture layers
  • Analyze Layer Functions: Explain the responsibilities of each layer from physical devices to collaboration processes
  • Design Layered Systems: Create IoT architectures with clear separation of concerns between layers
  • Trace Data Flow: Follow data transformation from raw sensor readings through processing to actionable insights
  • Identify Integration Points: Locate interfaces between layers for protocol translation and data transformation

162.2 Seven (7) Level IoT Reference Model

~30 min | Intermediate | P04.C18.U01

Below, each level of the Seven (7) Level IoT Reference Model is discussed in detail, including the core functions, examples, and interactions that illustrate how raw data is transformed into valuable information for end users.

Data flows upward from physical devices through connectivity, edge processing, storage, and abstraction layers to application and human-centric process layers, each adding value and context along the way.

Seven-Layer IoT Reference Model: Data flows upward from physical devices through connectivity, edge processing, storage, and abstraction layers to application and human-centric process layers, each adding value and context along the way.

Original Cisco 7-level IoT reference model showing detailed layer breakdown with physical devices at Layer 1, connectivity at Layer 2, edge computing at Layer 3, data accumulation at Layer 4, data abstraction at Layer 5, application at Layer 6, and collaboration processes at Layer 7

Original 7-Level IoT Reference Model diagram from CP IoT System Design Guide - Standard PNG format

Original Cisco 7-level IoT reference model showing detailed layer breakdown with physical devices at Layer 1, connectivity at Layer 2, edge computing at Layer 3, data accumulation at Layer 4, data abstraction at Layer 5, application at Layer 6, and collaboration processes at Layer 7 - scalable vector format

Original 7-Level IoT Reference Model diagram - Scalable SVG format

Source: CP IoT System Design Guide, Chapter 2 - Architecture

162.2.1 Level 1: Physical Devices and Controllers

Overview

This layer represents the physical “things” within the IoT ecosystem. These devices vary widely in their capabilities, form factors, and locations but are all responsible for generating or receiving data, and often for acting on control signals.

Generic IoT device block diagram illustrating the essential components at Level 1: sensing inputs, analog-to-digital conversion, processing core, wireless connectivity, power management, and actuator outputs - all integrated on a single embedded platform.

Figure 162.1

This generic block diagram shows the typical architecture of an IoT device at Level 1. Key components include sensors for data acquisition, ADC for analog-to-digital conversion, a processing unit (microcontroller or microprocessor), wireless communication modules for connectivity, and power management circuitry - all elements discussed in this section.

  • Endpoint Devices
    • Examples: Sensors (temperature, humidity, pressure), actuators (robotic arms, motors), RFID tags, smart thermostats, fitness trackers.
    • Key Function: Sensing or actuating in the physical environment, sending or receiving data through a network connection.
  • Analog-to-Digital (A/D) Conversion
    • Why It Matters: Many real-world phenomena (e.g., temperature, pressure) exist as analog signals. IoT devices often include embedded A/D converters to transform these signals into digital data.
    • Example: A pipeline pressure sensor continuously converts analog pressure readings to digital form, ready for transmission.
  • Data Generation
    • Approaches: Periodic reporting (e.g., every second, every minute) or event-triggered reporting (e.g., only when a threshold is reached).
    • Example: A greenhouse temperature sensor sends data every five seconds to maintain environmental conditions.
  • Remote Control and Queries
    • Capabilities: Devices can often be queried or controlled over the network, enabling remote adjustments and firmware updates.
    • Example: A factory robot can receive over-the-air software patches to improve performance or address security flaws.

Because IoT devices (Level 1) can differ significantly in power requirements, network capabilities, and operational environments (e.g., industrial sites, home settings, remote outdoor locations), the robustness and scalability of subsequent levels hinge on accommodating this diversity.

NoteKnowledge Check: Physical Device Layer

162.2.2 Level 2: Connectivity

Ethernet connectivity diagram showing wired network topology with IoT devices connected via RJ45 cables to switches providing reliable, high-bandwidth (10/100/1000 Mbps) communication with low latency for stationary industrial and commercial IoT applications
Figure 162.2: Ethernet wired connectivity for IoT devices - reliable high-bandwidth communication protocol
Wireless communication technologies overview showing range-power-bandwidth trade-offs for Wi-Fi (high bandwidth, short range), Bluetooth (low power, personal area), Zigbee (mesh networking, moderate range), LoRa (long range, low bandwidth), and cellular (wide area, variable power) protocols
Figure 162.3: Wireless communication technologies for IoT - Wi-Fi, Bluetooth, Zigbee, LoRa, and cellular protocols

Overview

Level 2 is dedicated to communications and network connectivity, ensuring reliable and timely data transfer among devices, controllers, and the broader network. Although IoT often leverages existing networks, certain legacy or non-IP devices still require gateways or translation for interoperability.

  • Network Protocols & Reliability
    • Common Protocols: Ethernet, Wi-Fi, Bluetooth, Zigbee, Z-Wave, MQTT, TCP/IP.
    • Example: In a smart home, light bulbs might communicate via Zigbee to a central hub, which then translates the messages to Wi-Fi for cloud-based data logging.
  • East-West and North-South Traffic
    • East-West: Data flows between devices within the same network tier (e.g., sensor-to-sensor communication in a local site).
    • North-South: Data flows from lower levels (devices) “upward” to processing levels, and downward from processing layers back to devices.
    • Example: A soil moisture sensor sends data (northbound) to a central server; a control command (southbound) then adjusts irrigation valves.
  • Switching and Routing
    • Role: Directing packets to the correct destination, whether local or remote.
    • Example: A switch in a smart factory routes real-time production data from conveyor belt sensors to an on-site server for analysis.
  • Protocol Translation
    • Why Needed: Devices that use proprietary or legacy protocols may not speak IP natively.
    • Example: A gateway converts serial communication (RS-232) from a decades-old machine into IP-based packets for cloud analytics.
  • Network-Level Security
    • Elements: Encryption, firewalls, virtual private networks (VPNs), identity management.
    • Example: A firewall inspects incoming packets, allowing only authorized maintenance commands to reach a hospital’s IoT-enabled infusion pumps.
  • Self-Learning or Adaptive Networking
    • Purpose: Continuously monitor traffic patterns to optimize performance or detect anomalies (e.g., intrusion, device failures).
    • Example: A predictive algorithm identifies unusual spikes in bandwidth usage by a security camera, flagging potential tampering or hacking attempts.
NoteKnowledge Check: Connectivity and Protocol Selection

162.2.3 Level 3: Edge (Fog) Computing

Overview

Level 3 focuses on processing data closer to where it is generated. Often called fog computing, this approach helps filter, aggregate, and transform high-volume data before sending it to central repositories, reducing network load and enabling real-time insights.

  • High-Volume Data Analysis
    • Challenge: Sensors can generate continuous or burst data streams (e.g., hundreds of samples per second).
    • Example: A manufacturing line with multiple temperature, vibration, and pressure sensors requires real-time checking of thresholds to prevent product defects.
  • Packet-by-Packet Processing
    • Constraint: At this level, processing is typically not session-aware but acts on individual packets or small data chunks.
    • Example: An edge device inspects incoming data from a vibration sensor, looking for sudden spikes indicative of machine misalignment.
  • Data Filtering & Clean-Up
    • Goal: Remove noise, correct anomalies, or combine repeated readings into a single summarized value.
    • Example: A building’s HVAC system might discard sensor readings that fall within normal range and only forward outliers (e.g., suspicious temperature drops).
  • Thresholding & Event Generation
    • Threshold Checks: Trigger immediate alerts if certain limits are exceeded or not met.
    • Event Generation: Send events to higher levels for further action.
    • Example: An edge system at a water facility flags sensor data that indicates unsafe pH levels, instantly alerting operators.
  • Data Distillation
    • Purpose: Distill or aggregate raw data into more compact forms.
    • Example: A city traffic camera might record images at high frequency, but an edge processor only forwards vehicle counts and speeds, saving bandwidth and storage costs.
NoteKnowledge Check: Edge vs Cloud Processing

162.2.4 Level 4: Data Accumulation

Overview

Level 4 is where data-in-motion transitions to data-at-rest. The events and streams arriving from Levels 1-3 become organized, persisted, and made available for query-based operations at higher layers.

  • From “Event-Based” to “Query-Based” Computing
    • Event-Based: Data flows determined by triggers from devices (e.g., sensor reading changes).
    • Query-Based: Higher-level applications access data as needed, rather than receiving a continuous stream.
    • Example: An industrial system captures real-time sensor data in a time-series database; a maintenance app later queries for a specific time window.
  • Selective Storage
    • Objective: Retain only the data necessary for analysis, archiving, or compliance.
    • Example: A smart retail camera system might store daily transaction logs plus alerts for unusual customer traffic patterns, discarding raw video after a short retention.
  • Determining Storage Type
    • Options: Relational databases, big data systems (e.g., Hadoop, Spark), distributed file systems, NoSQL stores.
    • Example: An energy company might use a distributed file system to store massive wind turbine data sets for monthly trend analysis, while short-term operational data sits in a high-speed in-memory cache.
  • Recombining and Recomputing
    • Need: Sometimes data must be combined with previously stored information or reformatted for consistency.
    • Example: A shipping company correlates historical GPS data with new location pings to calculate route efficiency improvements over time.

Through consistent accumulation practices, Level 4 ensures the continuity of data for longer-term and non-real-time analysis.

NoteKnowledge Check: Data Storage Selection

162.2.5 Level 5: Data Abstraction

Overview

IoT deployments often operate at corporate or global scale, employing multiple storage systems and sources of data (including non-IoT databases). Level 5 manages the integration and simplification of this distributed information, so higher-level applications can work seamlessly.

  • Information Integration
    • Need: Pull data from multiple repositories (e.g., real-time sensors, legacy SQL systems, external APIs).
    • Example: A smart city platform merges traffic sensor data, GIS information, and public transit schedules to provide a single view of urban mobility.
  • Schemas and Views
    • Role: Present data in ways that reflect application requirements, masking underlying complexity.
    • Example: A healthcare portal might unify heart rate sensor data, EHR records, and insurance claims into one coherent “patient” view.
  • Reconciliation of Data Differences
    • Challenge: Data may vary in format, units (Celsius vs. Fahrenheit), or semantics (different labels for the same concept).
    • Example: A global weather service might unify temperature readings across different regions and measurement scales.
  • Data Security and Access Controls
    • Why: A single system might serve multiple stakeholders, each needing restricted or specialized data access.
    • Example: An automotive company only allows authorized manufacturing engineers to see certain sensor logs from the production line, while external partners view a limited subset.
  • Filtering, Selecting, and Reformating
    • Goal: Provide only the necessary data to client applications in a consistent format.
    • Example: An agricultural cooperative that processes raw soil moisture data, aerial imagery, and weather forecasts - returning a simplified dataset for farm management apps.

By abstracting and organizing disparate data streams at Level 5, application development (Level 6) becomes more efficient and scalable, ensuring that complex under-the-hood processes remain hidden from everyday users.

NoteKnowledge Check: Data Abstraction Benefits

162.2.6 Level 6: Application

Overview

This level hosts the software applications that interpret, analyze, and act on the data. Freed from the real-time constraints of the network, these applications can present dashboards, generate reports, orchestrate controls, and integrate IoT-derived insights with broader enterprise workflows.

  • Monitoring and Reporting
    • Tools: Dashboards, alert systems, business intelligence (BI) applications.
    • Example: A manufacturing dashboard shows machine performance metrics, highlighting anomalies in real time while also allowing historical trend comparisons.
  • Controlling Devices
    • Methods: Sending commands or adjusting parameters on Level 1 devices (through Levels 2-3).
    • Example: A mobile app enables homeowners to turn on/off lights or lock doors remotely, using data from sensors to verify actions.
  • Combining IoT and Non-IoT Data
    • Value: Enhanced context by merging sensor readings with traditional enterprise data, like ERP or CRM systems.
    • Example: A retailer’s inventory management updates product stock levels based on sensor data tracking crates at loading docks.
  • Industry-Specific Applications
    • Examples: Enterprise Resource Planning (ERP), specialized industry solutions (healthcare, manufacturing), business intelligence (BI) reporting, and system management/control center software.
    • Example: A hospital might run a specialized patient monitoring system that integrates wearable data, bed occupancy rates, and EHR records.

These applications provide user-facing functionalities - real-time alerts, analytics, user interfaces - that rely on well-organized data from the previous layers.

NoteKnowledge Check: Application Layer Integration

162.2.7 Level 7: Collaboration and Processes

Overview

Even the most detailed IoT insights have limited value if they do not lead to action. Level 7 focuses on the people, business processes, and collaboration required to turn data-driven insights into meaningful outcomes.

  • Human and Organizational Engagement
    • Scope: Involving multiple stakeholders - engineers, operators, managers, external partners - in decision-making.
    • Example: A logistics firm orchestrates efforts between fleet managers, drivers, and mechanics when real-time vehicle telemetry shows an imminent maintenance issue.
  • Communication and Coordination
    • Tools: Email, instant messaging, dedicated collaboration platforms, phone calls, or specialized IoT dashboards.
    • Example: City officials, emergency services, and utility companies coordinate via a shared platform when a smart system detects a major water main break.
  • Workflow Integration
    • Objective: Embed IoT data insights into routine or critical organizational processes, ensuring timely reactions.
    • Example: A retailer’s marketing team receives automatic notifications about low stock or sudden sales spikes, prompting promotional campaigns or restocking actions.
  • Beyond a Single Application
    • Why: Many real-world responses span multiple systems, departments, and applications.
    • Example: An agricultural cooperative merges meteorological data (Level 5) and supply chain apps (Level 6), allowing farm managers, distributors, and transportation services to coordinate seamlessly.

By aligning people and processes with the insights generated by IoT applications, Level 7 ensures that the data collected and processed throughout the preceding levels ultimately results in effective action and continuous improvement.

NoteKnowledge Check: Collaboration Layer Value

This variant maps each reference model layer to specific technologies and products, helping students connect abstract concepts to concrete implementations.

%%{init: {'theme': 'base', 'themeVariables': { 'primaryColor': '#2C3E50', 'primaryTextColor': '#fff', 'primaryBorderColor': '#16A085', 'lineColor': '#16A085', 'secondaryColor': '#E67E22', 'tertiaryColor': '#7F8C8D', 'fontSize': '10px'}}}%%
graph TB
    subgraph L7["LAYER 7: Collaboration"]
        T7_1["Slack Alerts"]
        T7_2["Email Workflows"]
        T7_3["Teams Integration"]
    end

    subgraph L6["LAYER 6: Application"]
        T6_1["Grafana Dashboard"]
        T6_2["Mobile App"]
        T6_3["Web Portal"]
    end

    subgraph L5["LAYER 5: Data Abstraction"]
        T5_1["REST API"]
        T5_2["GraphQL"]
        T5_3["Data Lake"]
    end

    subgraph L4["LAYER 4: Accumulation"]
        T4_1["InfluxDB"]
        T4_2["TimescaleDB"]
        T4_3["MongoDB"]
    end

    subgraph L3["LAYER 3: Edge Computing"]
        T3_1["Raspberry Pi"]
        T3_2["AWS Greengrass"]
        T3_3["Azure IoT Edge"]
    end

    subgraph L2["LAYER 2: Connectivity"]
        T2_1["Wi-Fi / Zigbee"]
        T2_2["LoRaWAN"]
        T2_3["MQTT Broker"]
    end

    subgraph L1["LAYER 1: Physical"]
        T1_1["DHT22 Sensor"]
        T1_2["ESP32 MCU"]
        T1_3["Smart Plug"]
    end

    L1 --> L2 --> L3 --> L4 --> L5 --> L6 --> L7

    style L1 fill:#16A085,color:#fff
    style L2 fill:#27AE60,color:#fff
    style L3 fill:#E67E22,color:#fff
    style L4 fill:#2980B9,color:#fff
    style L5 fill:#8E44AD,color:#fff
    style L6 fill:#E74C3C,color:#fff
    style L7 fill:#2C3E50,color:#fff

Figure 162.4: Alternative view: This technology mapping helps practitioners select appropriate tools for each layer. Layer 1 choices (ESP32 vs Arduino) affect Layer 2 options (Wi-Fi vs BLE). Layer 3 edge platforms (Raspberry Pi vs commercial gateways) determine local processing capability. Layer 4 database selection (InfluxDB for time-series vs MongoDB for documents) impacts query patterns. Understanding these dependencies enables coherent system design.

Misconception: “The 7-layer model is unnecessarily complex. Simpler systems should skip layers to reduce complexity.”

Reality: The 7-layer model is a conceptual framework, not a mandate for 7 separate software components. Even simple IoT systems perform all 7 functions - the question is whether you organize them explicitly or let them emerge ad-hoc.

Example - “Simple” Smart Thermostat:

Even a basic smart thermostat performs all 7 layers: - L1: Temperature sensor (DHT22 chip) - L2: Wi-Fi chip transmits data - L3: Microcontroller filters noise from sensor readings (edge processing) - L4: ESP32 stores last 100 readings in flash memory - L5: HTTP endpoint provides /temperature API (abstraction) - L6: Mobile app displays temperature chart - L7: User decides to adjust setpoint

The layers exist whether you acknowledge them or not. The 7-layer model helps you: 1. Identify what’s missing: “Why do we lose data when Wi-Fi fails?” - No Layer 4 storage 2. Troubleshoot systematically: “Dashboard shows wrong units” - Layer 5 abstraction issue 3. Scale efficiently: “Adding Zigbee sensors breaks app” - Need better Layer 5 abstraction

Key Insight: The model reduces complexity by organizing it, not by adding layers that weren’t already there implicitly. A “simple” system that ignores layering becomes more complex when you try to scale, debug, or integrate new devices.

NoteKnowledge Check: Security Across Layers

This chapter connects to multiple learning resources across the book:

Video Deep-Dives (Videos Hub): - “IoT Architecture Explained” - Visual walkthrough of the 7-layer model with real-world examples - “Edge Computing vs Cloud Computing” - When to use Layer 3 vs sending all data to cloud - “Building Scalable IoT Systems” - How reference models enable growth from 10 to 10,000 devices

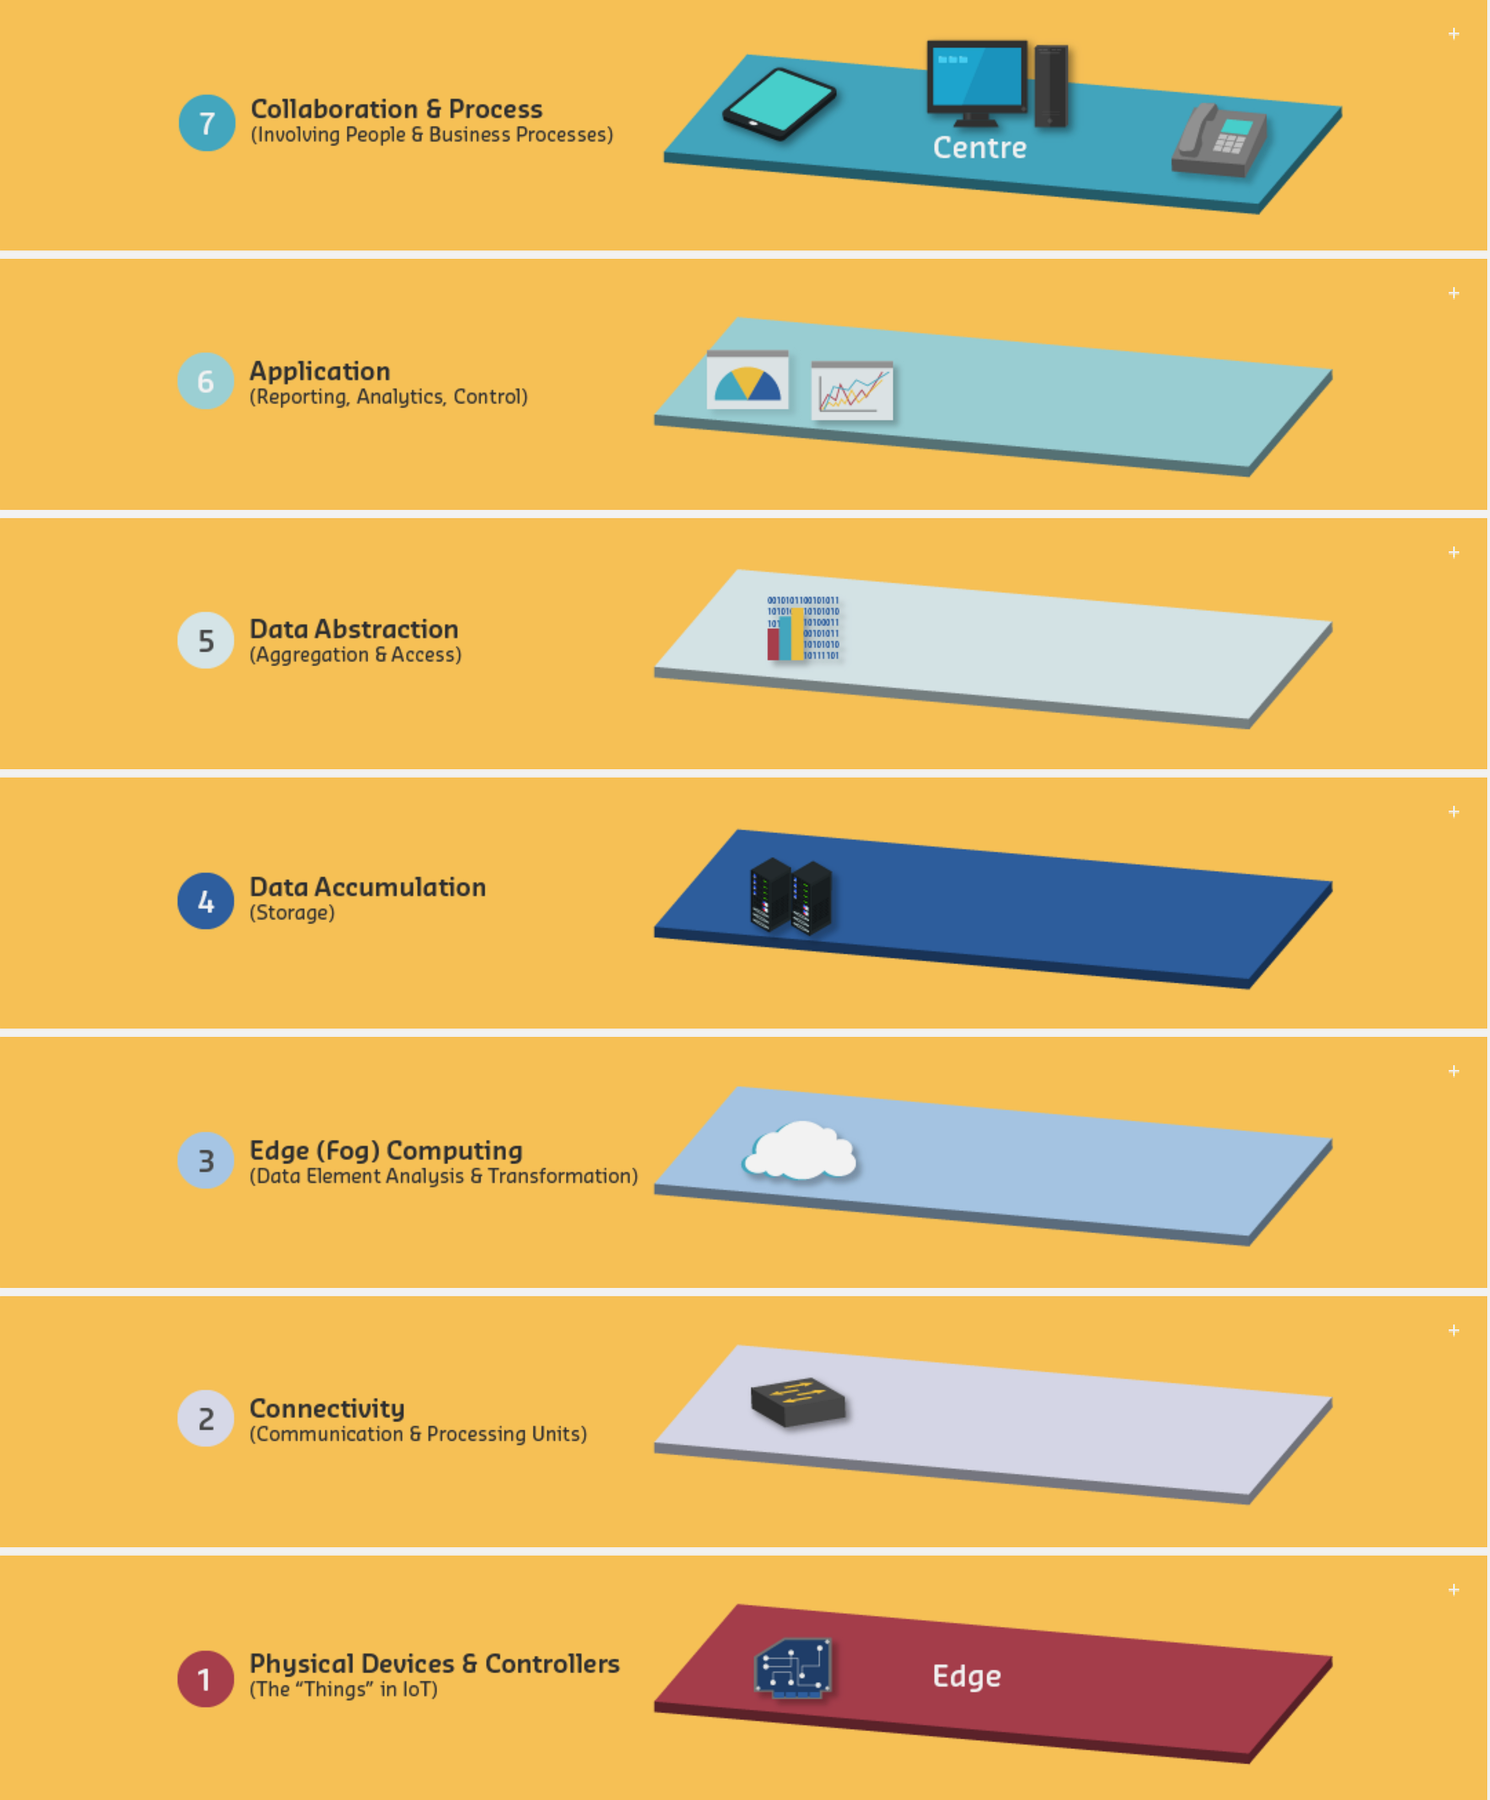
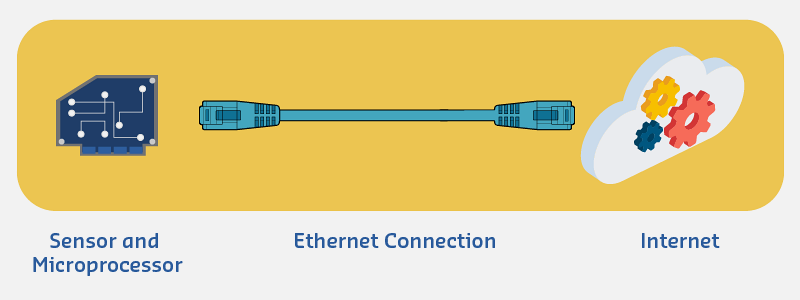
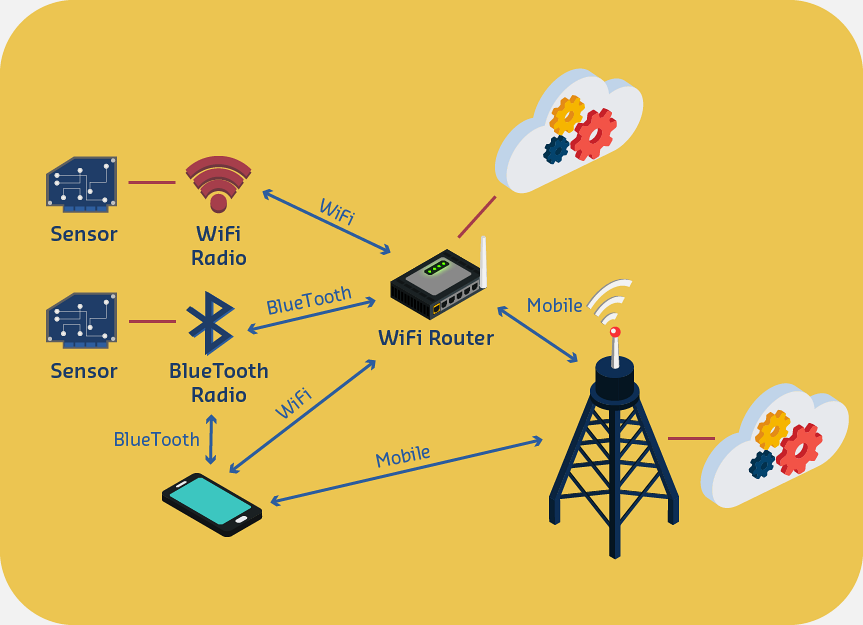
Hands-On Practice (Simulations Hub): - Network Topology Explorer - Visualize different Layer 2 connectivity patterns (star, mesh, tree) - IoT Data Flow Simulator - Trace sensor data through all 7 layers with interactive diagrams - Protocol Comparison Tool - Compare Layer 2 protocols (Wi-Fi, Zigbee, LoRaWAN) for your use case

Self-Assessment (Quizzes Hub): - Architecture Fundamentals Quiz - Test your understanding of reference model concepts - Layer Responsibilities Challenge - Match functions to correct layers - Troubleshooting by Layer - Diagnose problems using systematic layer analysis

Related Technical Chapters: - Edge Computing Patterns - Layer 3 implementation strategies - Data Storage and Databases - Layer 4 storage options (SQL, NoSQL, time-series) - IoT Protocols Overview - Layer 2 protocol selection framework - Stream Processing - How Kafka/Flink fit into Layers 3-4

Common Learning Gaps (Knowledge Gaps Hub): - “When do I need Layer 3 edge processing?” - Answered with latency/bandwidth calculations - “Why can’t apps talk directly to databases?” - Layer 5 abstraction benefits explained - “How do layers map to actual code?” - Implementation examples for each layer

Study Path Recommendation: 1. Complete this chapter on reference models (conceptual foundation) 2. Watch “IoT Architecture Explained” video for visual reinforcement 3. Use Network Topology Explorer simulation to experiment with Layer 2 connectivity 4. Read Edge Computing Patterns for Layer 3 implementation details 5. Take Architecture Fundamentals Quiz to validate understanding

162.3 Summary

In this chapter, you learned the detailed functions of each layer in the Cisco Seven-Level IoT Reference Model:

Layer Name Core Function
1 Physical Devices Sensors, actuators, A/D conversion, data generation
2 Connectivity Protocols, routing, security, protocol translation
3 Edge Computing Filtering, aggregation, thresholding, real-time decisions
4 Data Accumulation Storage, databases, query-based access
5 Data Abstraction Integration, schema views, access controls
6 Application Dashboards, control, enterprise integration
7 Collaboration Human engagement, workflows, cross-team coordination

Key insight: Data flows upward through the stack gaining value at each layer, while control commands flow downward from human decisions to physical actuators.

162.4 What’s Next

Continue to Alternative IoT Reference Architectures to learn about other reference models including IoT-A (European standard) and ITU-T (telecommunications focus), and when to choose each for your IoT deployments.