%%{init: {'theme': 'base', 'themeVariables': { 'primaryColor': '#2C3E50', 'primaryTextColor': '#fff', 'primaryBorderColor': '#16A085', 'lineColor': '#16A085', 'secondaryColor': '#E67E22', 'tertiaryColor': '#ecf0f1'}}}%%
flowchart TB
    subgraph Things["Level 1: Physical Devices & Controllers"]
        Big[Big Things<br/>Computers,<br/>Databases]
        SmallIP[Small IP Things<br/>Webcams, Lights,<br/>Smartphones]
        NonIP[Non-IP Things<br/>Sensors, Locks,<br/>Temperature Gauges]
    end

    subgraph Gateway["Edge Gateway (Level 3)"]
        Big --> Direct[Direct<br/>Connection]
        SmallIP --> Direct
        NonIP --> GW[Gateway<br/>Protocol<br/>Translation]
    end

    subgraph Internet["Internet Connectivity"]
        Direct --> Cloud[Cloud/Fog<br/>Processing]
        GW --> Cloud
    end

    style Big fill:#2C3E50,stroke:#16A085,color:#fff
    style SmallIP fill:#16A085,stroke:#2C3E50,color:#fff
    style NonIP fill:#E67E22,stroke:#2C3E50,color:#fff
    style GW fill:#E67E22,stroke:#2C3E50,color:#fff
    style Direct fill:#16A085,stroke:#2C3E50,color:#fff
    style Cloud fill:#2C3E50,stroke:#16A085,color:#fff
1330 Edge Data Acquisition: Architecture and Device Types
1330.1 Learning Objectives
By the end of this chapter, you will be able to:
- Classify IoT Data Sources: Distinguish between Big Things, Small IP Things, and Non-IP Things in edge architectures
- Understand Device Connectivity Paths: Explain how different device types connect to cloud infrastructure
- Compare Data Generation Rates: Analyze data volumes across device categories and their implications for edge processing
- Design Data Acquisition Strategies: Select appropriate transmission schedules based on device capabilities
1330.2 Prerequisites
Before diving into this chapter, you should be familiar with:
- Edge, Fog, and Cloud Overview: Understanding the three-tier IoT architecture provides context for where edge data acquisition fits
- Sensor Fundamentals: Knowledge of sensor types and characteristics helps understand data acquisition requirements
TipFor Beginners: What is Edge Data Acquisition?
Think of edge data acquisition like a local newspaper reporter versus a national news network.
A local reporter (edge device) collects news from the neighborhood and decides what’s important enough to send to the national headquarters (cloud). They don’t send everything - just the highlights. This saves time, money, and keeps headquarters from being overwhelmed.
The “Edge” is simply where your sensors live:
| Location | Example | Why “Edge”? |
|---|---|---|
| Your thermostat | Living room wall | At the edge of your network |
| Factory sensor | On a machine | Far from the central servers |
| Traffic camera | Roadside pole | Collecting data at the source |
Three types of “Things” at the edge:
- Big Things - Computers, servers (they can talk to the internet directly)
- Small IP Things - Smart bulbs, webcams (they have their own internet connection)
- Non-IP Things - Simple sensors that need a “translator” (gateway) to reach the internet
Why process data at the edge instead of sending everything to the cloud?
| Challenge | Without Edge | With Edge |
|---|---|---|
| Speed | Wait for cloud response | Instant local decisions |
| Battery | Constant transmission drains battery | Send only summaries, save power |
| Bandwidth | Network gets clogged | Only important data travels far |
| Privacy | All your data goes to remote servers | Sensitive data stays local |
Real-world example: A security camera generates 1GB of video per hour. Instead of sending all that to the cloud, edge processing detects “motion” and only uploads the 5-second clips that matter.
1330.3 Introduction to Edge Data Acquisition
Edge data acquisition is the process of collecting, processing, and transmitting sensor data at the network periphery - where physical devices meet the digital infrastructure. This chapter explores the fundamental architecture and device categories that form the foundation of efficient data collection at the IoT edge.
NoteKey Takeaway
In one sentence: Collect raw data at the edge, but only transmit what’s needed - 90% of IoT data is never analyzed.
Remember this rule: If you can’t name who will use the data and how, don’t collect it.
NoteWhy Edge Matters
Traditional cloud-centric architectures require all sensor data to travel to remote servers for processing. Edge data acquisition shifts some processing closer to the source, reducing:
- Latency: Critical for time-sensitive applications (autonomous vehicles, industrial safety)
- Bandwidth: Raw sensor streams can overwhelm network capacity
- Energy: Transmitting data is 10-100x more power-intensive than local processing
- Privacy: Sensitive data can be processed locally without cloud exposure
1330.4 IoT Device Categories
The key sources of data in IoT are the ‘Things’ - the physical devices and controllers located on Level 1 of the IoT Reference Model. Things can be accessed directly to send and receive data, however, to be IoT ‘Things’, they must be connected to the Internet.
1330.4.1 Three Categories of Things
Big Things might be computers and databases. Small IP-enabled Things could include webcams, lights, and smartphones. Non-IP Things may need a Gateway or other device to assist - examples include lights, temperature gauges, locks, and gates.
1330.4.2 Device Characteristics Comparison
| Category | Examples | Connectivity | Data Rate | Processing Capability |
|---|---|---|---|---|
| Big Things | Servers, industrial PLCs | Full IP stack | GB/day | High (full OS) |
| Small IP Things | Smart cameras, lights | Wi-Fi, cellular | MB/day | Medium (embedded) |
| Non-IP Things | Temperature sensors, door locks | Zigbee, BLE, Modbus | KB/day | Low (microcontroller) |
1330.5 Data Generation Patterns
Understanding data generation patterns is essential for designing efficient edge acquisition systems. Different device types produce vastly different data volumes and require different handling strategies.
NoteAlternative View: Data Volume by Device Type
This view shows how data generation rates vary dramatically by device type, driving different edge processing strategies:
%% fig-alt: "Bar chart comparison of data generation rates across IoT device types. Big Things like computers generate gigabytes per day requiring minimal edge processing. Small IP Things like cameras generate megabytes per day benefiting from edge compression and filtering. Non-IP Things like temperature sensors generate kilobytes per day but often require aggregation before transmission. Shows why one-size-fits-all data strategies fail - a camera needs video compression while a temperature sensor needs statistical aggregation."
%%{init: {'theme': 'base', 'themeVariables': { 'primaryColor': '#2C3E50', 'primaryTextColor': '#fff', 'primaryBorderColor': '#16A085', 'lineColor': '#16A085', 'secondaryColor': '#E67E22', 'tertiaryColor': '#ecf0f1'}}}%%
flowchart LR
    subgraph DataVolume["Daily Data Volume"]
        D1["Big Things<br/>Computers<br/>~GB/day"]
        D2["Small IP Things<br/>Cameras<br/>~MB/day"]
        D3["Non-IP Things<br/>Temp Sensors<br/>~KB/day"]
    end

    subgraph Strategy["Edge Strategy"]
        S1["Direct Stream<br/>to Cloud<br/>No reduction"]
        S2["Edge Compression<br/>Video → Clips<br/>100x reduction"]
        S3["Edge Aggregation<br/>Samples → Stats<br/>1000x reduction"]
    end

    D1 --> S1
    D2 --> S2
    D3 --> S3

    style D1 fill:#2C3E50,stroke:#16A085,color:#fff
    style D2 fill:#16A085,stroke:#2C3E50,color:#fff
    style D3 fill:#E67E22,stroke:#2C3E50,color:#fff
    style S1 fill:#7F8C8D,stroke:#2C3E50,color:#fff
    style S2 fill:#16A085,stroke:#2C3E50,color:#fff
    style S3 fill:#27AE60,stroke:#2C3E50,color:#fff
Different device types require different edge processing strategies based on their data generation rates and the value of raw versus processed data.
1330.5.1 Inertial Measurement Example
High-frequency sensors like accelerometers and gyroscopes demonstrate why edge aggregation is critical:
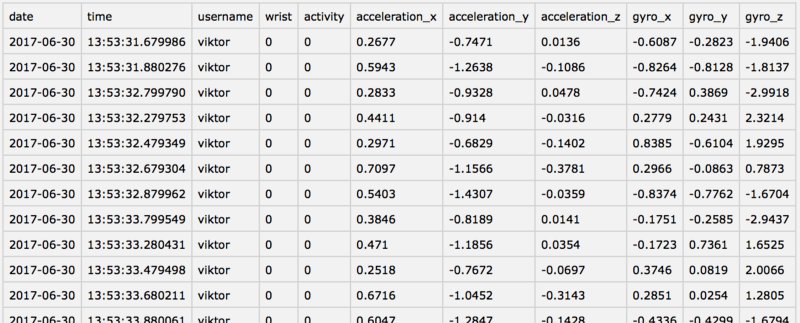
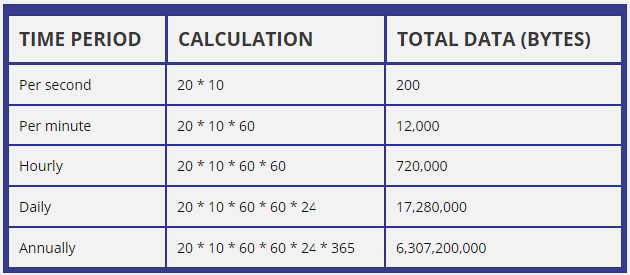
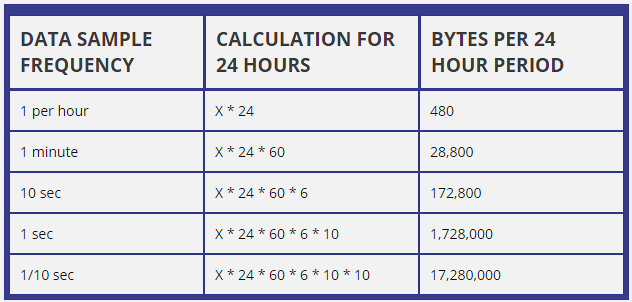
At 100 Hz sampling across 6 axes (3 accelerometer + 3 gyroscope), an IMU generates 600 samples/second. Transmitting raw data would require ~4.8 KB/s - unsustainable for battery-powered devices. Edge aggregation reduces this to statistical summaries at 1 Hz.
1330.6 Power Budget Decision Framework
Device capabilities directly impact acquisition strategies. This decision tree helps determine the optimal approach based on power constraints:
NoteAlternative View: Power Budget Decision Tree
This view helps determine the optimal duty cycle based on power constraints:
%% fig-alt: "Decision tree for IoT power budget optimization. Start with battery capacity, then check if device needs real-time response - if yes use always-on mode with larger battery or power harvesting. If not real-time, determine data criticality. High criticality uses event-triggered wake with short duty cycle. Low criticality uses periodic wake with maximum sleep time. Each path shows expected battery life and trade-offs."
%%{init: {'theme': 'base', 'themeVariables': { 'primaryColor': '#2C3E50', 'primaryTextColor': '#fff', 'primaryBorderColor': '#16A085', 'lineColor': '#16A085', 'secondaryColor': '#E67E22', 'tertiaryColor': '#ecf0f1'}}}%%
flowchart TD
    Start[Battery Capacity<br/>Known] --> RT{Real-time<br/>Response<br/>Needed?}

    RT -->|Yes| Always[Always-On Mode<br/>Large battery or<br/>energy harvesting<br/>Days lifespan]
    RT -->|No| Crit{Data<br/>Criticality?}

    Crit -->|High| Event[Event-Triggered Wake<br/>Sleep until threshold<br/>Months lifespan]
    Crit -->|Low| Periodic[Periodic Wake<br/>Maximum sleep time<br/>Years lifespan]

    Always --> Example1[Smoke detector<br/>Security camera]
    Event --> Example2[Vibration alert<br/>Motion sensor]
    Periodic --> Example3[Temperature logger<br/>Asset tracker]

    style Start fill:#2C3E50,stroke:#16A085,color:#fff
    style Always fill:#E74C3C,stroke:#2C3E50,color:#fff
    style Event fill:#E67E22,stroke:#2C3E50,color:#fff
    style Periodic fill:#27AE60,stroke:#2C3E50,color:#fff
The optimal power strategy depends on application requirements - prioritize accordingly.
1330.7 Knowledge Check
1330.8 Summary
Edge data acquisition architecture is built on understanding three fundamental device categories:
- Big Things: Full-capability computers with direct cloud connectivity - minimal edge processing needed
- Small IP Things: Embedded devices with IP connectivity - benefit from edge compression and filtering
- Non-IP Things: Simple sensors requiring gateways - need edge aggregation for efficient transmission
The acquisition strategy must match device capabilities: high-volume devices (cameras) need compression, low-volume devices (temperature sensors) need aggregation, and non-IP devices need protocol translation through gateways.
1330.9 What’s Next
The next chapter, Edge Data Acquisition: Sampling and Compression, explores the technical details of sampling rates, Nyquist theorem, and compression algorithms for efficient edge data handling.
NoteRelated Chapters
- Edge Data Acquisition: Sampling and Compression - Nyquist theorem and data reduction techniques
- Edge Data Acquisition: Power and Gateways - Power management and gateway functions
- Edge Compute Patterns - Processing patterns at the edge
- Edge Fog Computing - Architecture overview