%% fig-alt: "Epidemic routing timeline showing message replication growth from T=0 with source creating packet P1, T=1 with 2 copies after first encounter, T=2 with 4 copies from parallel spreading, T=3 with destination receiving message but copies persisting, T=4 with continued replication to 8+ copies, resulting in high delivery ratio but high overhead"
%%{init: {'theme': 'base', 'themeVariables': { 'primaryColor': '#2C3E50', 'primaryTextColor': '#fff', 'primaryBorderColor': '#16A085', 'lineColor': '#16A085', 'secondaryColor': '#E67E22', 'tertiaryColor': '#7F8C8D', 'fontSize': '16px'}}}%%
graph TD
    T0["T=0: Source creates P1"] --> T1["T=1: A meets B<br/>2 copies"]
    T1 --> T2["T=2: Parallel spread<br/>4 copies"]
    T2 --> T3["T=3: Destination receives<br/>But copies persist"]
    T3 --> T4["T=4: Continued replication<br/>8+ copies"]
    T4 --> T5["Result: High delivery<br/>High overhead"]

    style T0 fill:#2C3E50,stroke:#16A085,color:#fff
    style T1 fill:#16A085,stroke:#2C3E50,color:#fff
    style T2 fill:#16A085,stroke:#2C3E50,color:#fff
    style T3 fill:#E67E22,stroke:#16A085,color:#fff
    style T4 fill:#E67E22,stroke:#16A085,color:#fff
    style T5 fill:#7F8C8D,stroke:#16A085,color:#fff
256 DTN Epidemic Routing
256.1 Learning Objectives
By the end of this chapter, you will be able to:
- Design Epidemic Routing: Implement message flooding strategies for intermittent networks
- Analyze Replication Trade-offs: Balance delivery ratio against resource consumption
- Apply Buffer Management: Use FIFO, SHLI, and MOFO strategies for constrained devices
- Optimize with Spray-and-Wait: Implement bounded replication for resource efficiency
- Calculate DTN Performance: Estimate buffer requirements and latency for real deployments
256.2 Prerequisites
Before diving into this chapter, you should be familiar with:
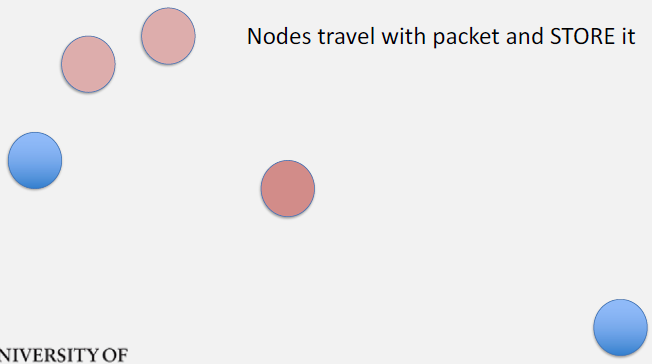
- DTN Fundamentals: Understanding the store-carry-forward paradigm is essential before learning epidemic routing strategies
- Multi-Hop Fundamentals: Multi-hop networking concepts provide background for understanding message propagation
- Networking Basics: Fundamental networking concepts help contextualize DTN’s departure from traditional routing
TipFor Beginners: Epidemic Routing
Epidemic Routing - The Gossip Strategy:
Imagine spreading a rumor: tell everyone you meet, and they tell everyone they meet. Eventually, everyone knows!
Epidemic routing copies messages to every node encountered: - Pro: High delivery probability (many copies = high chance one reaches destination) - Con: Massive overhead (100 nodes = 100 message copies!)
| Term | Simple Explanation | Everyday Analogy |
|---|---|---|
| Epidemic Routing | Give message copy to everyone you meet | Spreading a rumor |
| Spray and Wait | Create limited copies, then wait for destination | Hand flyers to 10 people, they wait for recipient |
| TTL (Time-To-Live) | Message expiration timer | Best-before date on food |
| Buffer Management | Deciding which messages to keep/drop | Cleaning out your inbox |
NoteRelated Chapters
DTN Series: - DTN Fundamentals - Store-carry-forward basics - DTN Social Routing - Context-aware and social-based routing - DTN Applications - Real-world DTN deployments
Background: - Multi-Hop Fundamentals - Multi-hop communication basics - Ad-hoc Fundamentals - Ad-hoc network basics
Learning: - Simulations Hub - DTN simulators
256.3 Epidemic Routing
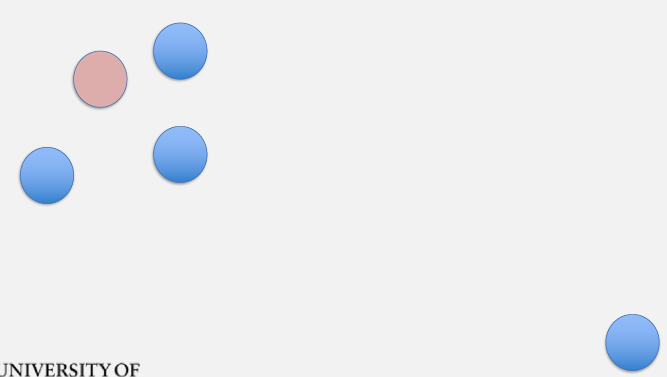
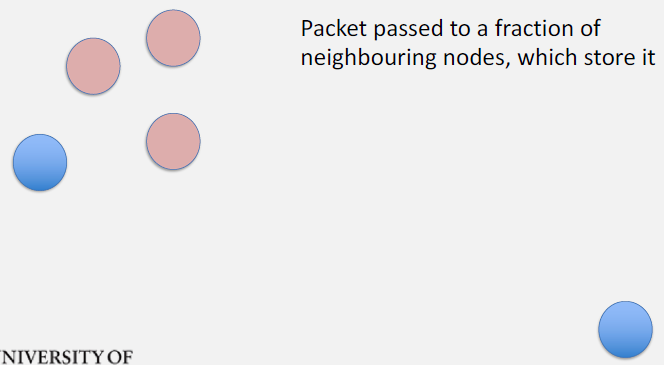
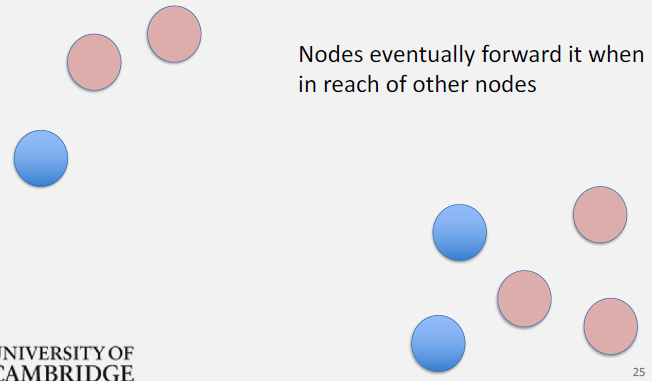
Epidemic routing is a flooding-based DTN protocol where nodes exchange all buffered packets upon contact, spreading messages like an infectious disease.
256.3.1 Epidemic Routing Algorithm
256.3.2 Epidemic Routing Example
Detailed Time Steps:
T=0: Packet P1 originates at Node A - A buffer: {P1} - B, C, D buffers: {}
T=1: A encounters B 1. Exchange summary vectors - A has: {P1} - B has: {} 2. B requests P1 3. A transfers P1 to B - A buffer: {P1} - B buffer: {P1} (new copy) - Replication count: 2
T=2: Multiple simultaneous contacts - B encounters C: C receives P1 - A encounters D: D receives P1 - Replication count: 4
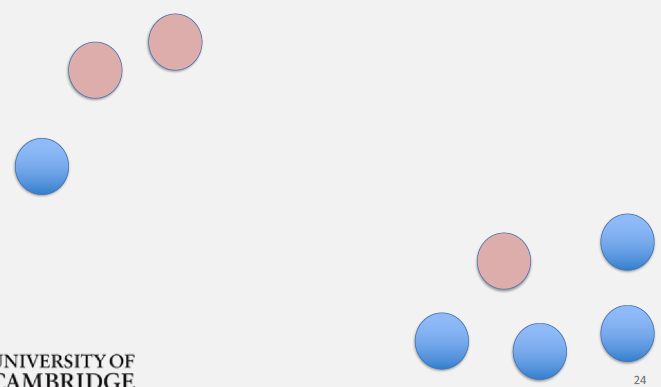
T=3: If C is destination - C receives P1 (successful delivery) - But replicas still exist on A, B, D - Message not removed (continues spreading)
256.3.3 Epidemic Routing Control Parameters
1. Delivery Threshold - Stop forwarding after K successful deliveries - Reduces unnecessary replication - Trade-off: delivery confidence vs overhead
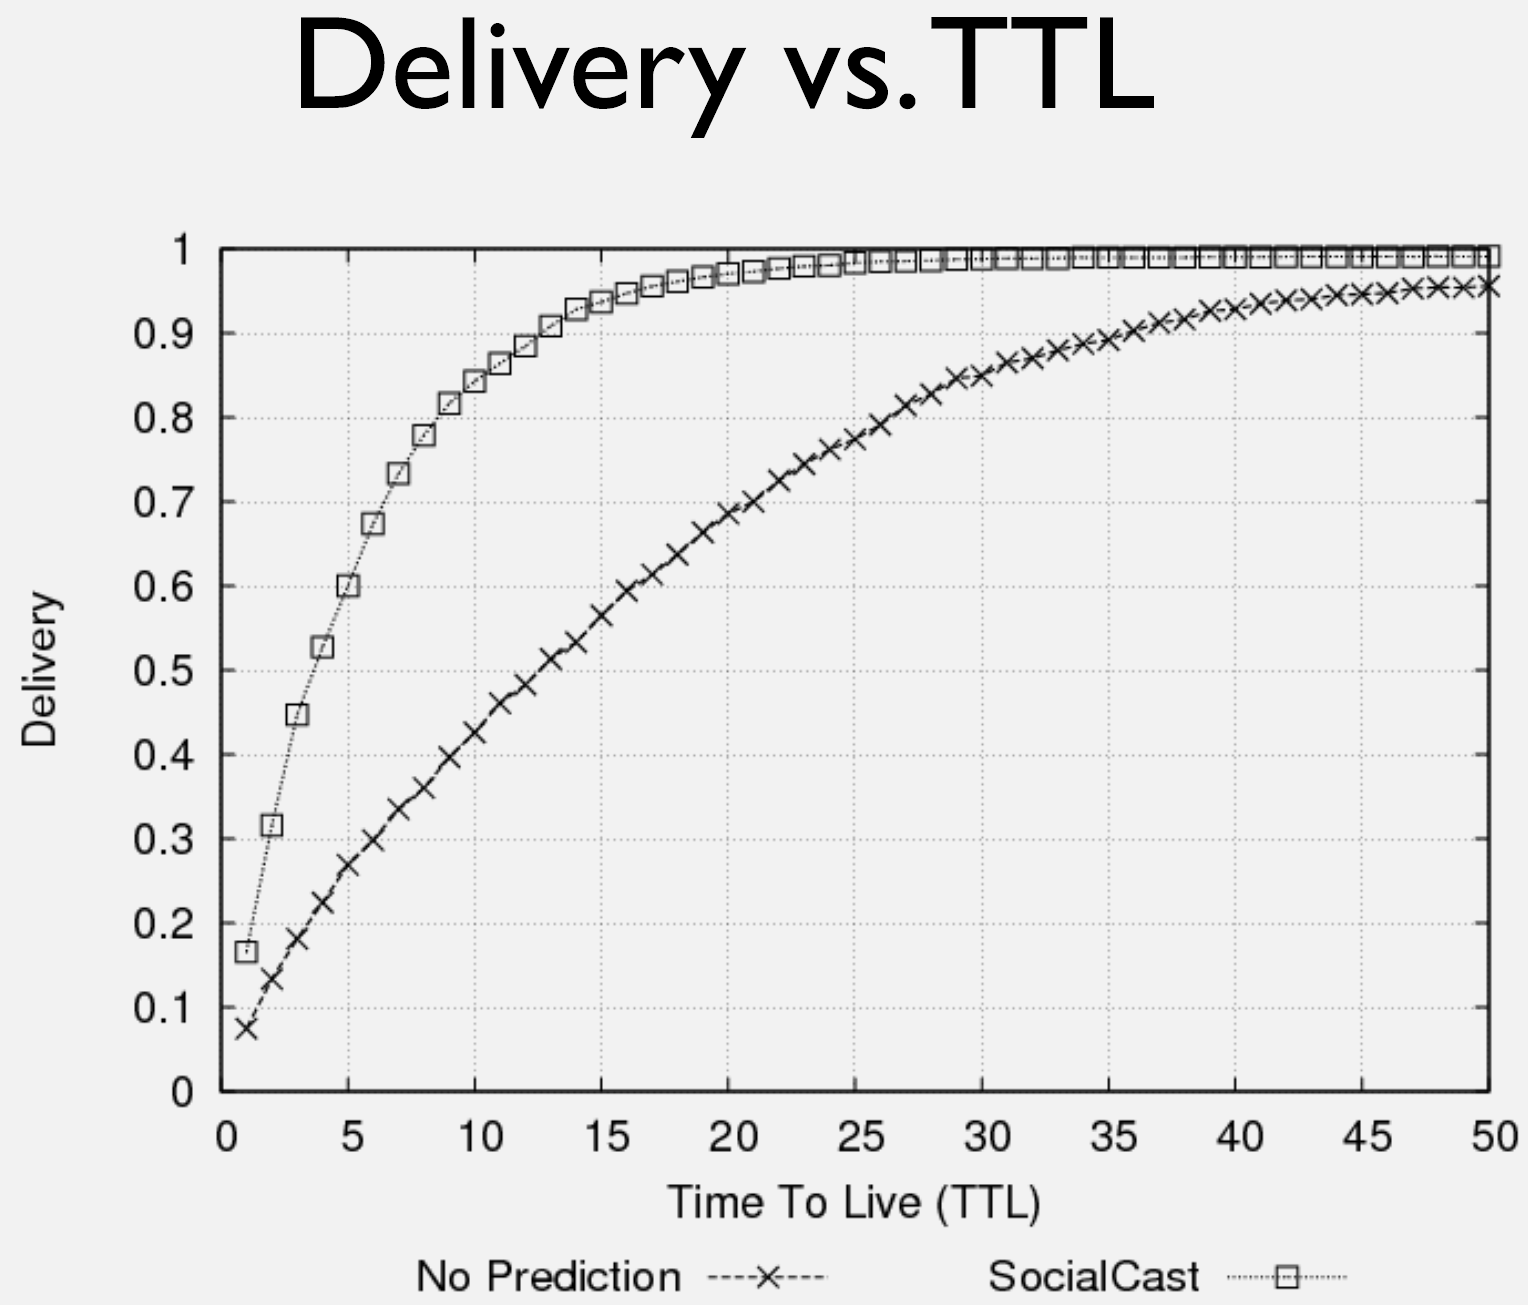
2. Time-To-Live (TTL) - Packets expire after TTL hops or seconds - Prevents infinite propagation - Limits resource consumption
3. Buffer Management - FIFO: Drop oldest packets when buffer full - SHLI (Shortest Lifetime First): Drop packets closest to expiration - MOFO (Most Forwarded First): Drop most-replicated packets
4. Replication Limit - Maximum number of copies allowed - Source creates N replicas, carriers don’t replicate further - Controlled flooding
256.3.4 Epidemic Routing Performance
NoteWorked Example: Epidemic Routing Buffer Sizing
Scenario: A wildlife tracking network monitors 50 elephants in a reserve. Each collar generates location updates that must reach a base station. Calculate required buffer size for 95% delivery confidence.
Given: - 50 elephants with GPS collars - Each collar generates 1 message (200 bytes) per hour - Average inter-encounter time: 4 hours between any two elephants - Messages expire after 72 hours (TTL) - Target: 95% delivery ratio
Steps: 1. Calculate message generation rate: - 50 collars x 1 msg/hour = 50 messages/hour network-wide - Over 72-hour TTL: 50 x 72 = 3,600 messages exist at any time
- Estimate replication factor for 95% delivery:
- With 4-hour average encounter time, each message spreads to:
- After 4h: 2 copies (source + 1 encounter)
- After 8h: 4 copies
- After 16h: 8 copies
- After 32h: 16 copies
- After 64h: 32 copies (64% of herd)
- For 95% delivery, need ~40 copies (80% of herd coverage)
- Calculate per-node buffer:
- Total message-copies at steady state: 3,600 msgs x 20 avg copies = 72,000 copies
- Distributed across 50 nodes: 72,000 / 50 = 1,440 messages per collar
- Memory: 1,440 x 200 bytes = 288 KB minimum buffer
Result: Each collar needs ~300 KB buffer to support epidemic routing with 95% delivery over 72-hour TTL.
Key Insight: Epidemic routing’s replication causes buffer requirements to scale with (message rate x TTL x replication factor / nodes). For resource-constrained wildlife collars, consider Spray-and-Wait (bounded replication) to reduce buffer needs by 80%+.
NoteWorked Example: DTN Latency Estimation for Rural Connectivity
Scenario: A rural health clinic in Kenya uses bus-based DTN to deliver medical test results to village patients. Calculate expected delivery latency.
Given: - 3 buses serve the route daily - Bus route cycle: Village to Hub to Village = 8 hours - Each bus carries DTN node with 50 Mbps Wi-Fi - Clinic uploads results at hub (internet gateway) - Village kiosk downloads when bus passes (30-second contact) - Results file size: 500 KB per patient
Steps: 1. Calculate worst-case latency: - Patient test at clinic, uploaded to hub server - Next bus arrives at hub: 0-8 hours (avg 4 hours) - Bus downloads pending results: instant (server to bus) - Bus travels to village: 4 hours - Total worst case: 8h (wait) + 4h (travel) = 12 hours - Average case: 4h (wait) + 4h (travel) = 8 hours
- Verify contact window sufficiency:
- 30-second contact at 50 Mbps = 1.5 Gb = 187 MB capacity
- If 100 patients have pending results: 100 x 500 KB = 50 MB
- 50 MB << 187 MB: Contact window sufficient
- Calculate throughput:
- 3 buses x 187 MB capacity x 2 trips/day = 1.12 GB/day
- Actual demand: ~500 results/day x 500 KB = 250 MB/day
- System has 4.5x capacity margin
Result: Medical results delivered within 8-12 hours average latency, with ample bandwidth margin for growth.
Key Insight: DTN latency = (wait for carrier) + (carrier travel time) + (contact duration overhead). For scheduled carriers like buses, latency is bounded and predictable. This 8-12 hour delay is acceptable for non-emergency medical results but inadequate for urgent cases (which should use cellular/satellite if available).
256.3.5 Epidemic Routing Optimizations
Spray and Wait:
Phase 1 (Spray): Create L copies
Phase 2 (Wait): Each copy carrier waits for direct destination contact- Limits replication while maintaining good delivery
- Balance: L=10 typical for moderate networks
Encounter-Based Routing (EBR): - Use past encounter history to predict future contacts - Forward to nodes with high encounter rate with destination - “Smart” epidemic routing
Prioritized Epidemic Routing (PREP): - Packets have priority levels - High-priority packets replicate aggressively - Low-priority packets replicate conservatively - Application-driven resource allocation
256.4 Knowledge Check
Test your understanding of epidemic routing concepts.
256.5 Summary
This chapter covered epidemic routing for delay-tolerant networks:
- Epidemic Routing Algorithm: Nodes exchange summary vectors upon contact and transfer missing packets, spreading messages like an infectious disease throughout the network
- Replication Growth: Messages replicate exponentially (2, 4, 8, 16+ copies) as nodes encounter each other, achieving 95-99% delivery ratios
- Control Parameters: TTL limits message lifetime, delivery thresholds stop unnecessary replication, and replication limits cap the number of copies
- Buffer Management: FIFO drops oldest packets, SHLI drops packets closest to expiration, and MOFO drops most-replicated packets when buffers fill
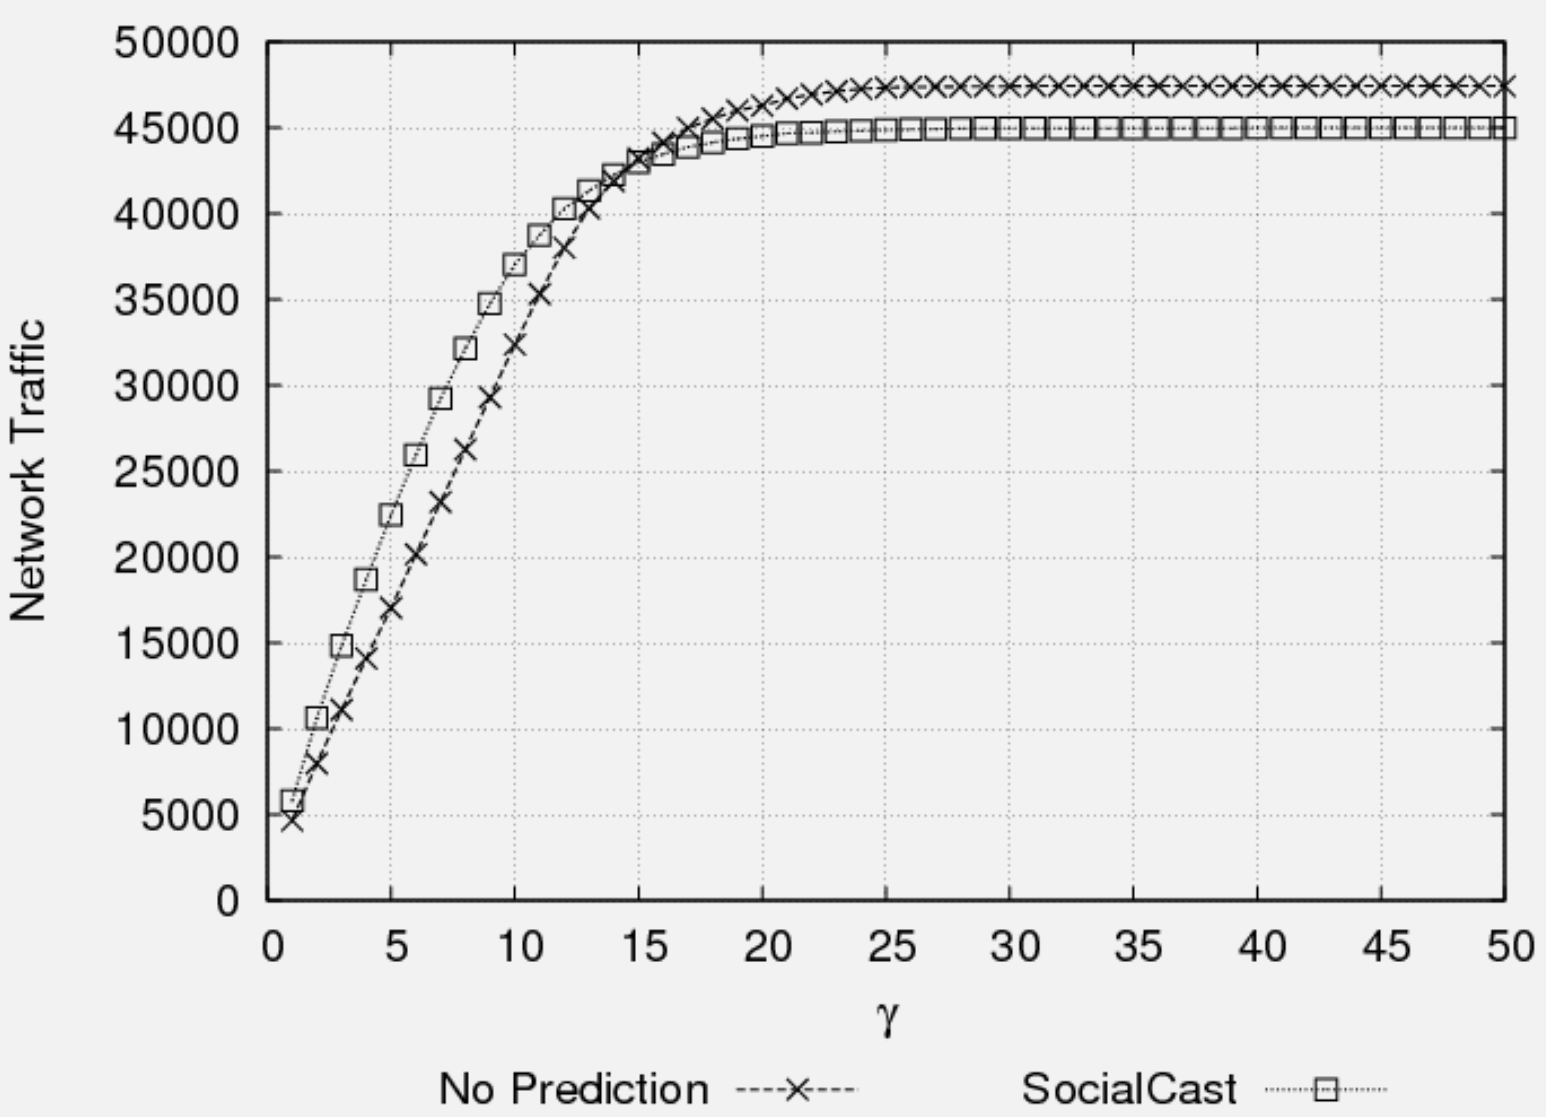
- Performance Trade-offs: Epidemic routing achieves optimal delivery at the cost of 500-1000% overhead in bandwidth, buffer, and energy consumption
- Optimizations: Spray-and-Wait creates bounded L copies, Encounter-Based Routing uses history for smart forwarding, and Prioritized Epidemic Routing allocates resources by application priority
256.6 What’s Next
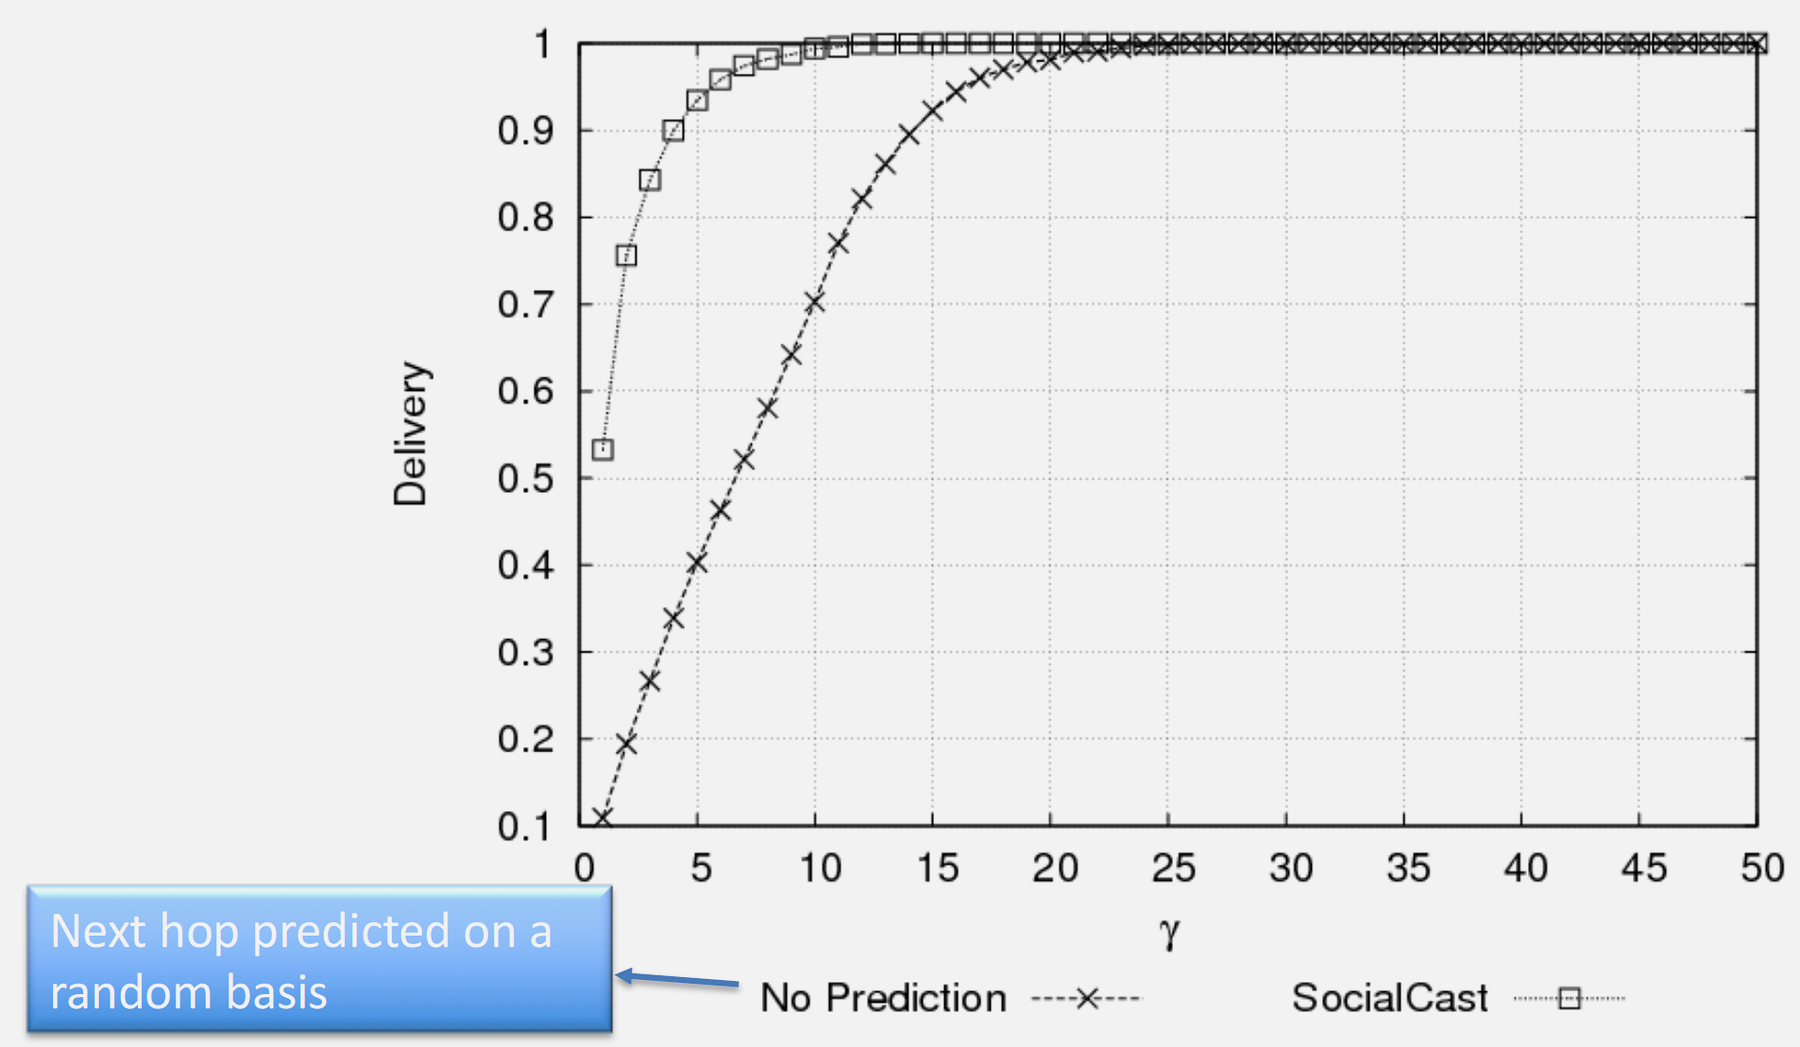
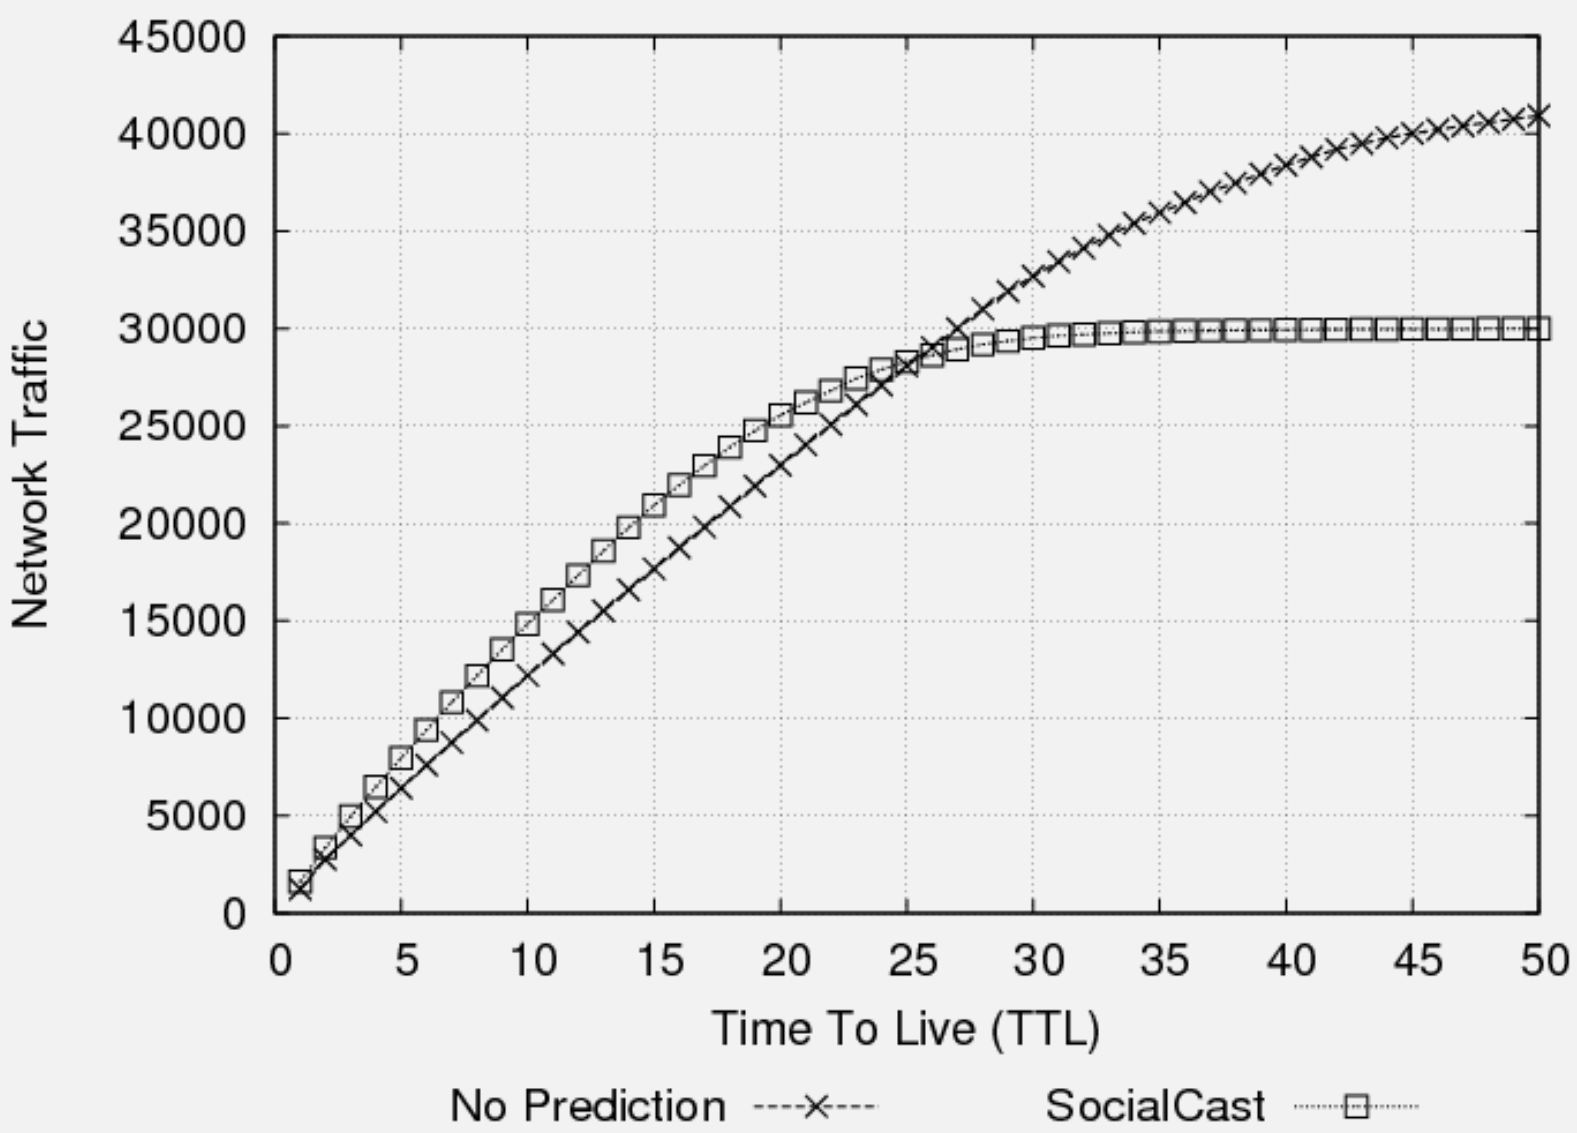
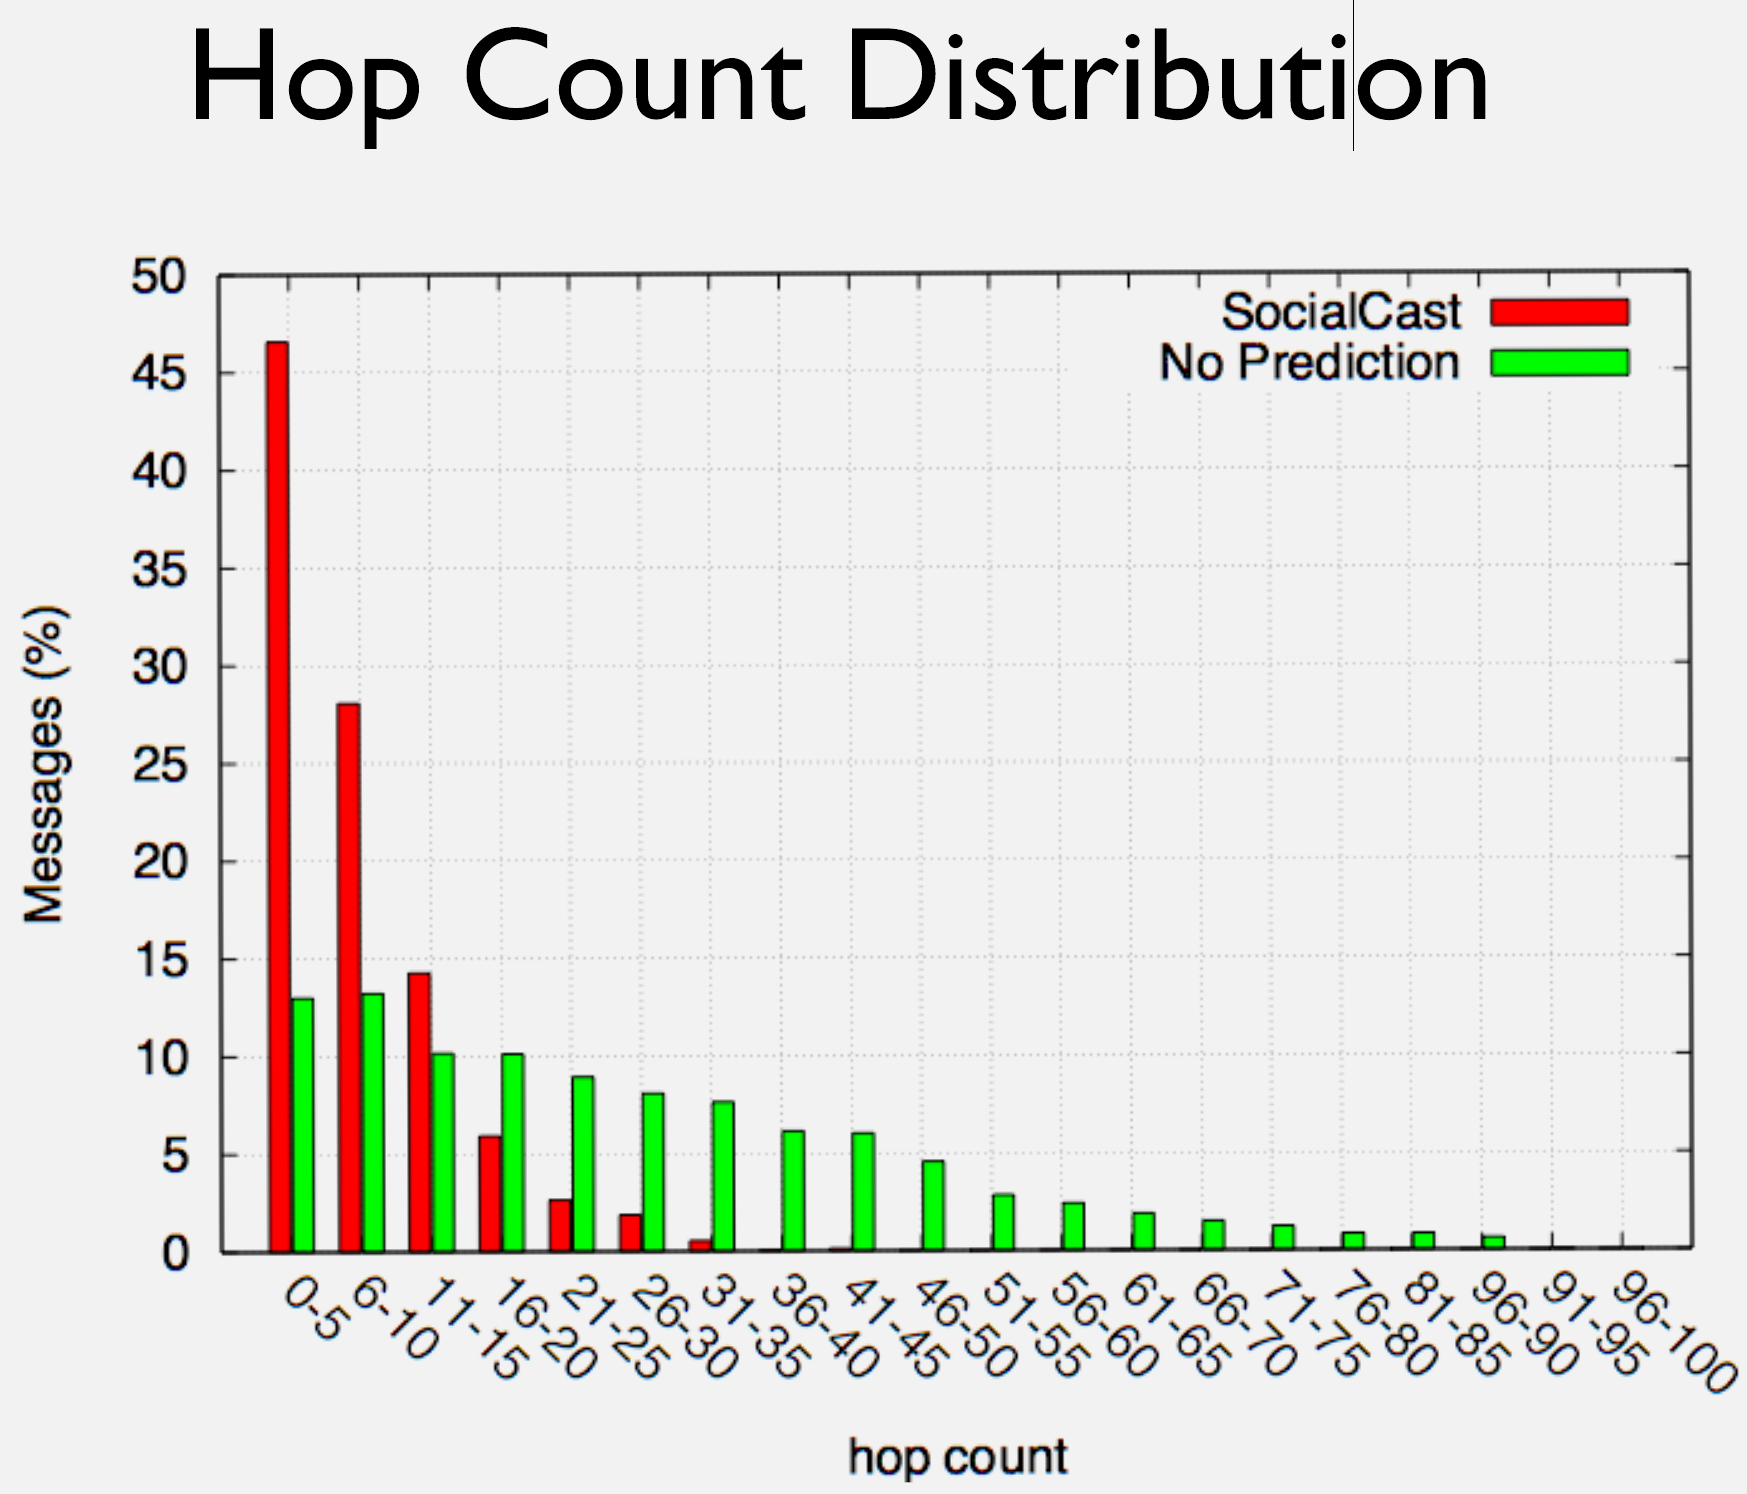
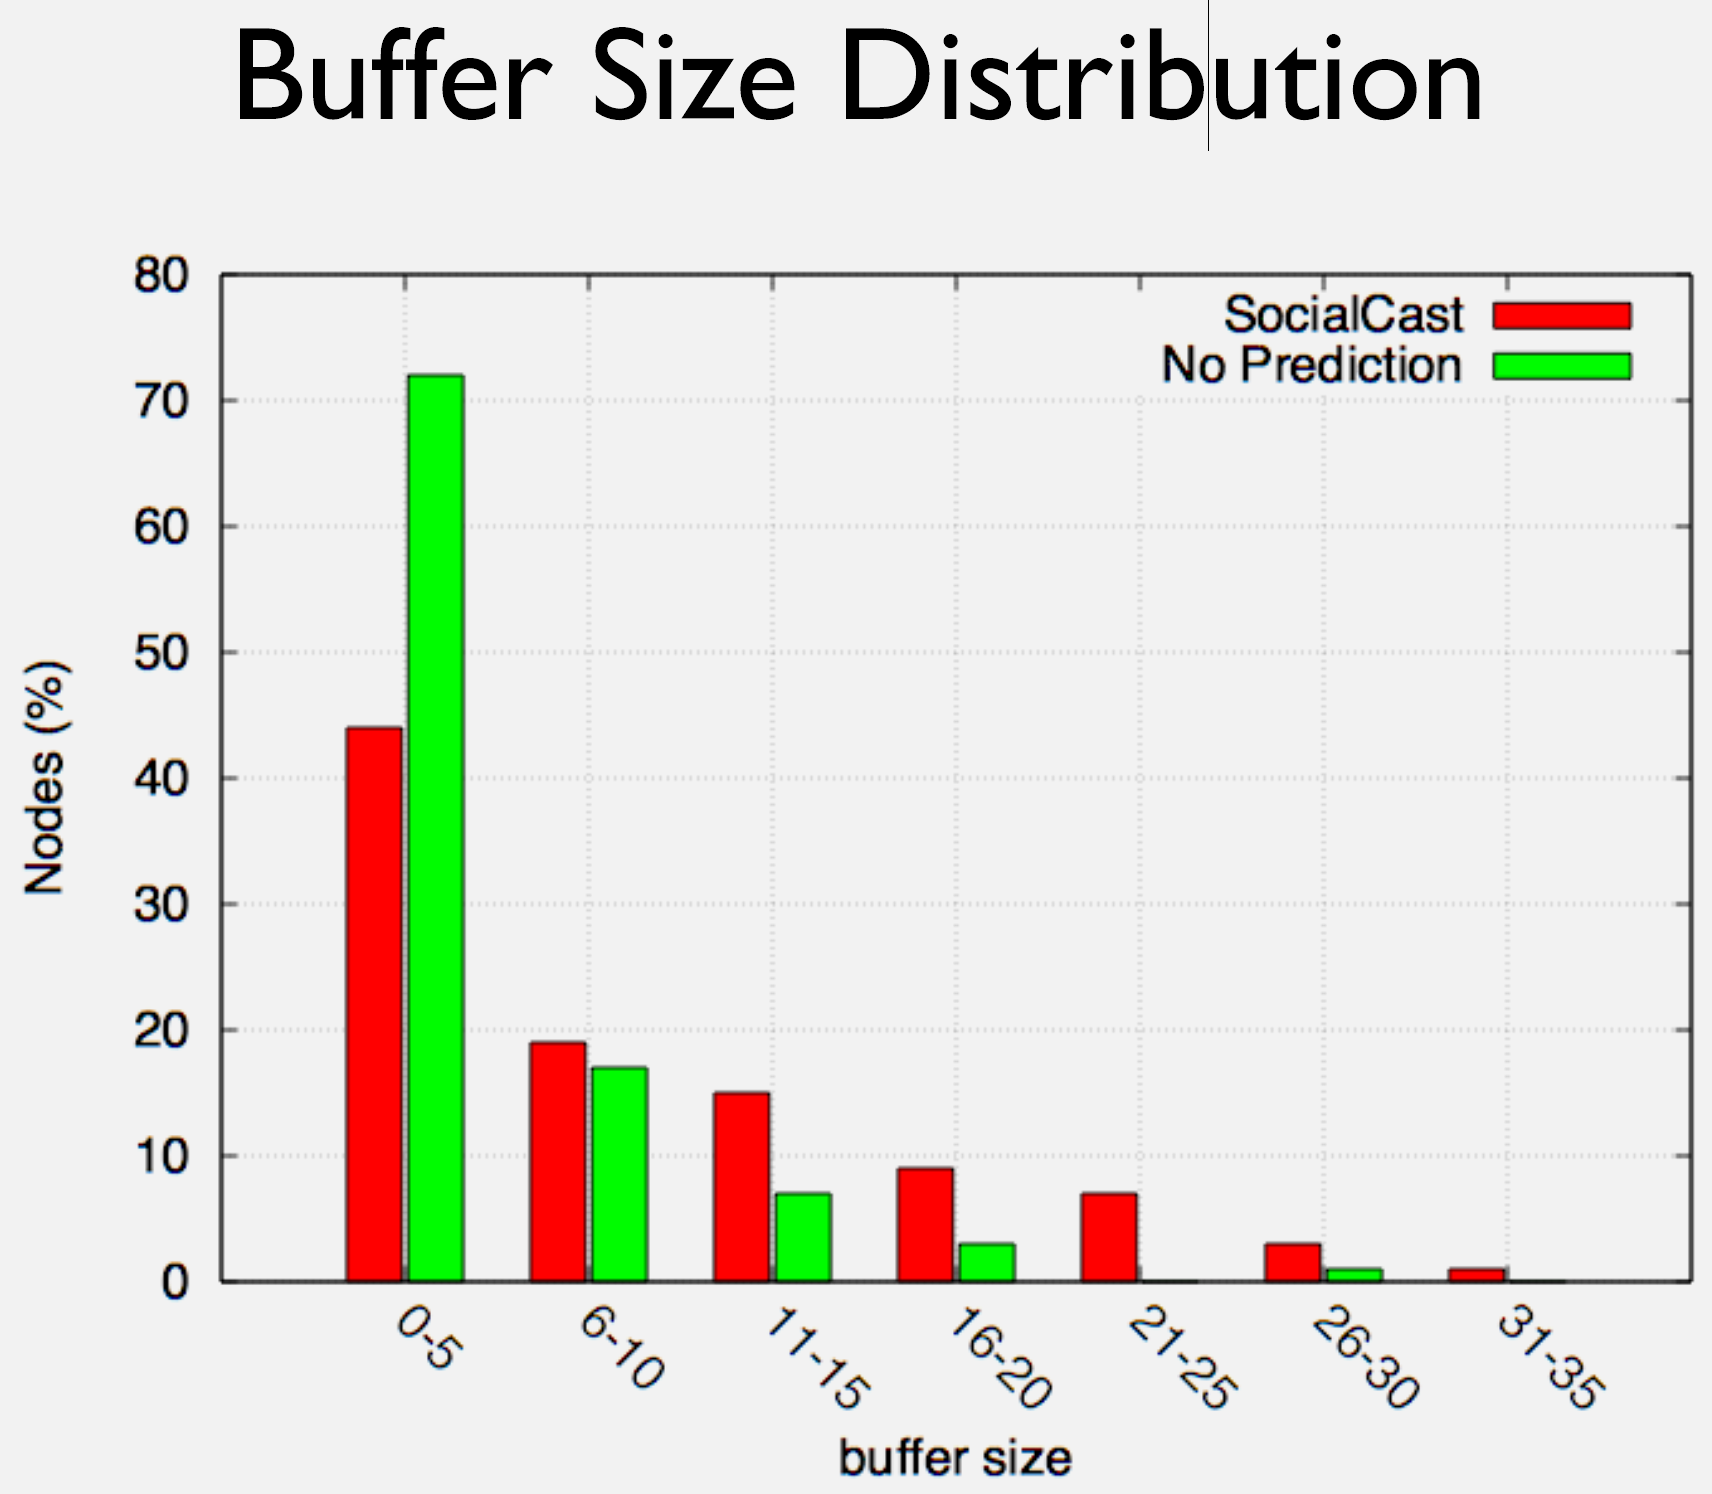
The next chapter explores DTN Social Routing, covering context-aware routing with utility functions and SocialCast’s social network-based forwarding that achieves 88% delivery with only 200% overhead.