%%{init: {'theme': 'base', 'themeVariables': { 'primaryColor': '#2C3E50', 'primaryTextColor': '#fff', 'primaryBorderColor': '#16A085', 'lineColor': '#16A085', 'secondaryColor': '#E67E22', 'tertiaryColor': '#7F8C8D'}}}%%
graph TD
subgraph Building["Office Building - Floor Plan"]
Room1["Room 101<br/>Switch SW1<br/>(Northwest corner)"]
Room2["Room 102<br/>Sensor S1<br/>(12m from SW1)"]
Room3["Room 103<br/>Sensor S2<br/>(25m from SW1)"]
Room4["Room 104<br/>Camera C1<br/>(18m from SW1)"]
Hall["Hallway<br/>Access Point AP1<br/>(Central location)"]
Server["Server Room<br/>Gateway GW1<br/>(45m cable to SW1)"]
end
Room1 -.->|"12m Ethernet<br/>through ceiling"| Room2
Room1 -.->|"25m Ethernet<br/>through conduit"| Room3
Room1 -.->|"18m Ethernet"| Room4
Room1 -.->|"8m Ethernet"| Hall
Room1 -.->|"45m Fiber<br/>through walls"| Server
style Room1 fill:#E67E22,stroke:#2C3E50,stroke-width:2px,color:#fff
style Room2 fill:#16A085,stroke:#2C3E50,stroke-width:2px,color:#fff
style Room3 fill:#16A085,stroke:#2C3E50,stroke-width:2px,color:#fff
style Room4 fill:#16A085,stroke:#2C3E50,stroke-width:2px,color:#fff
style Hall fill:#16A085,stroke:#2C3E50,stroke-width:2px,color:#fff
style Server fill:#2C3E50,stroke:#16A085,stroke-width:2px,color:#fff
style Building fill:#f0f0f0,stroke:#7F8C8D,stroke-width:3px
770 Network Topology Interactive Tools and Visualizer
770.1 Learning Objectives
By the end of this section, you will be able to:
- Use Interactive Visualizers: Experiment with different topology configurations
- Compare Topology Metrics: Observe connection counts, failure modes, and performance
- Visualize Physical Topologies: Understand building floor plans and device placement
- Apply Knowledge to Scenarios: Test understanding through scenario-based questions
770.2 Prerequisites
- Topologies Introduction: Physical vs logical topology concepts
- Topology Types: Understanding of star, mesh, ring, bus, tree characteristics
770.3 Interactive Topology Visualizer
TipInteractive: Network Topology Visualizer
Experiment with different network topologies to understand their characteristics and trade-offs for IoT deployments.
<label style="font-weight: 600;">
  Select Topology:
  <select id="topo-select" onchange="drawTopology()" style="padding: 5px 10px; border-radius: 4px; border: 1px solid #ccc; font-size: 14px;">
    <option value="star">Star</option>
    <option value="mesh">Full Mesh</option>
    <option value="partial-mesh">Partial Mesh</option>
    <option value="tree">Tree (Hierarchical)</option>
    <option value="ring">Ring</option>
    <option value="bus">Bus</option>
  </select>
</label>
<label style="font-weight: 600;">
  Number of Nodes:
  <input type="range" id="node-count" min="3" max="12" value="6" onchange="updateNodeCount(); drawTopology();" style="vertical-align: middle;">
  <span id="node-display" style="display: inline-block; min-width: 25px; font-weight: bold; color: #16A085;">6</span>
</label>
<button onclick="drawTopology()" style="padding: 5px 15px; background: #16A085; color: white; border: none; border-radius: 4px; cursor: pointer; font-weight: 600;">Redraw</button>
<h4 style="margin-top: 0; color: #2C3E50;">Topology Characteristics</h4>
<div id="topo-details"></div>Key Insights for IoT:
- Star topology is ideal for simple deployments where all devices can reach a central gateway (smart homes, office sensors)
- Mesh topology provides self-healing for critical applications but scales poorly beyond ~100 nodes due to connection overhead
- Tree topology efficiently aggregates traffic in large facilities by organizing devices hierarchically
- Partial mesh balances redundancy and cost by protecting only critical communication paths
- Bus and Ring are rarely used in modern wireless IoT but remain common in wired industrial systems (CAN bus, I2C)
Design Rule of Thumb: Start with star for simplicity. Use mesh when reliability trumps cost. Choose tree for large-scale hierarchical deployments.
770.4 Physical Topologies
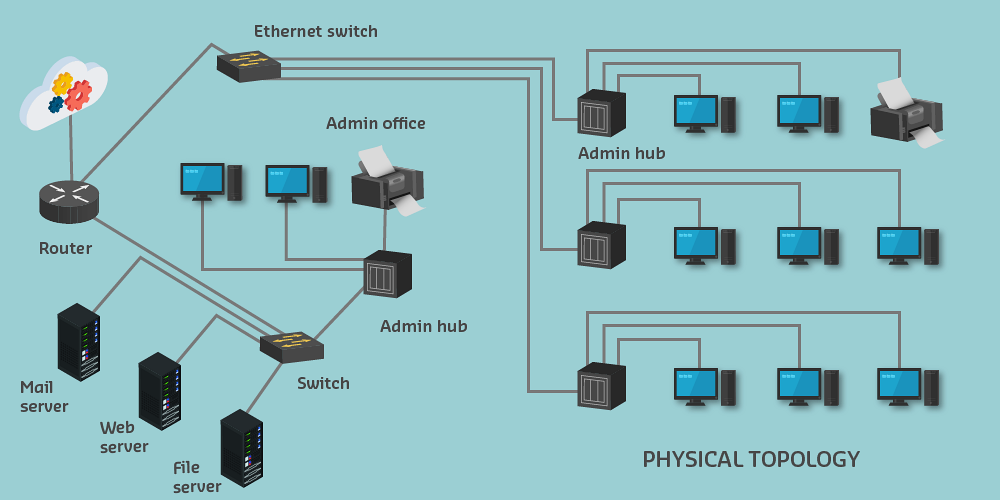
770.4.1 Purpose and Features
Physical topology shows actual layout of network in real space.
Includes: - Building floor plans - Device locations (to scale) - Cable routes and lengths - Wireless coverage areas - Wall materials (for RF planning) - Data points and outlets
770.4.2 Physical Topology Example
Key differences from logical: - Drawn to scale (or dimensioned) - Shows actual physical locations - Includes building structure - Cable routes show actual paths (not straight lines)
770.4.3 IoT Physical Topology Considerations
In IoT environments, physical topology shows:
- Sensor/actuator exact locations
- Temperature sensors on exterior walls
- Motion detectors at entry points
- Smart lights in ceiling grid
- Wireless coverage optimization
- Wi-Fi access point placement
- LoRa gateway coverage areas
- Zigbee mesh node distribution
- Power and connectivity
- PoE (Power over Ethernet) cable runs
- Power outlet locations
- Battery-powered device accessibility
- Environmental factors
- Wall materials (concrete blocks wireless signals)
- Metal structures (interference)
- Distance limitations for protocols
770.5 Knowledge Check Questions
Question 1: Why is a pure star topology usually a poor choice for a multi-floor building automation deployment with concrete walls?
Explanation: B. In real buildings, RF attenuation and floor-to-floor propagation mean a single gateway may not reach all nodes reliably. Mesh/partial-mesh designs add multi-hop paths and self-healing to route around dead zones and failures.
Question 2: In a mesh-based IoT network, what enables “self-healing” after a relay node fails?
Explanation: C. Self-healing comes from distributed routing: when a node or link drops, neighbors detect it and reroute through other relays (often with protocols like AODV-style path discovery in mesh stacks).
Question 3: Why is LoRa often inappropriate for indoor building automation that requires mesh self-healing?
Explanation: A. LoRa excels at long-range, low-power, gateway-centric telemetry, but most LoRaWAN deployments don’t support end-device mesh routing. Building automation often needs dense, indoor, multi-hop resilience (e.g., Zigbee/Thread meshes).
Question 4: A network administrator is documenting an IoT deployment. The physical topology shows sensors scattered across a warehouse floor plan with exact locations and cable runs. The logical topology shows a star pattern with all sensors connected to a central switch. Why might the physical and logical topologies appear so different?
Explanation: Physical and logical topologies serve different purposes and are intentionally different:
Physical Topology (Floor Plan View): - Shows exact locations, cable routes, distances, room layout - Used by installers, facility managers, maintenance
Logical Topology (Network View): - Shows connections, data flow, network hierarchy - Used by network engineers, troubleshooters, architects
Why they differ:
| Aspect | Physical | Logical |
|---|---|---|
| Purpose | Installation & maintenance | Network operation & troubleshooting |
| Scale | Drawn to scale | Not to scale |
| Cable paths | Actual routes (walls, conduits) | Straight lines (connections only) |
| Distance info | Yes (e.g., “25m cable run”) | No |
| Building structure | Walls, rooms, floors | Not shown |
| Focus | WHERE things are | HOW things connect |
770.6 Summary
- Interactive visualizer helps understand topology characteristics through hands-on experimentation
- Connection formulas: Star = n, Ring = n, Mesh = n(n-1)/2, Tree = n-1
- Physical topology shows actual device locations, cable routes, and building layouts
- Logical topology shows network connections independent of physical placement
- Both views needed for complete IoT network documentation
770.7 What’s Next
Continue to Topology Hands-On Lab for a complete ESP32-based simulation where you can build star, mesh, and tree topologies, compare their routing behavior, and test failure scenarios in real code.