%%{init: {'theme': 'base', 'themeVariables': { 'primaryColor': '#E67E22', 'primaryTextColor': '#fff', 'primaryBorderColor': '#D35400', 'lineColor': '#2C3E50', 'secondaryColor': '#16A085', 'tertiaryColor': '#2C3E50', 'noteTextColor': '#2C3E50', 'noteBkgColor': '#ECF0F1', 'textColor': '#2C3E50', 'fontSize': '16px'}}}%%
flowchart TD
    SIGNAL["Analog Signal<br/>Frequency: f"]

    SIGNAL --> CHECK{"Sample Rate<br/>>= 2 x f?"}

    CHECK -->|Yes<br/>Nyquist OK| GOOD["Proper Sampling<br/>Signal reconstructed<br/>correctly"]

    CHECK -->|No<br/>Undersampling| BAD["Aliasing!<br/>High freq appears<br/>as LOW freq"]

    GOOD --> EXAMPLE1["Example:<br/>500 Hz signal<br/>1000 Hz sampling<br/>= Perfect"]

    BAD --> EXAMPLE2["Example:<br/>2 kHz signal<br/>3 kHz sampling<br/>= Appears as 1 kHz!"]

    style SIGNAL fill:#E67E22,stroke:#D35400,color:#fff
    style CHECK fill:#2C3E50,stroke:#1A252F,color:#fff
    style GOOD fill:#16A085,stroke:#138D75,color:#fff
    style BAD fill:#E74C3C,stroke:#C0392B,color:#fff
    style EXAMPLE1 fill:#ECF0F1,stroke:#16A085,color:#2C3E50
    style EXAMPLE2 fill:#ECF0F1,stroke:#E74C3C,color:#2C3E50
604 Nyquist Sampling Theory
604.1 Learning Objectives
By the end of this section, you will be able to:
- Apply Nyquist Theorem: Calculate minimum sampling rates for different signals
- Understand Aliasing: Explain why undersampling causes incorrect frequency representation
- Design Anti-Aliasing Filters: Prevent high-frequency contamination before ADC
- Balance Sampling vs Power: Choose optimal sampling rates for battery-powered IoT devices
- Implement Oversampling: Use extra samples to improve effective resolution
604.2 Prerequisites
Before diving into this chapter, you should be familiar with:
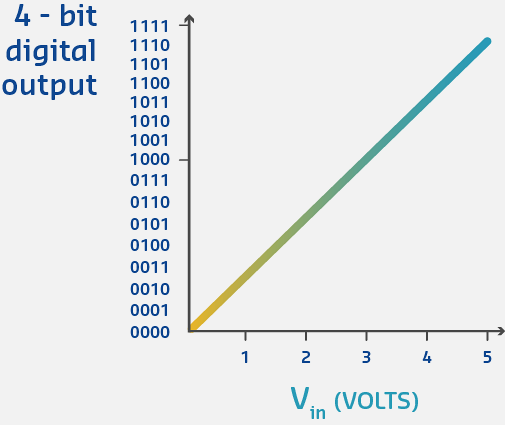
- ADC Fundamentals: Understanding how ADCs convert analog to digital
- Binary Fundamentals: Understanding of resolution and bit depth
- Basic Signal Concepts: Understanding of frequency (Hz) and waveforms
604.3 Nyquist-Shannon Sampling Theorem
To accurately digitize an analog signal, you must sample at least TWICE the highest frequency component.
\[f_{sample} \geq 2 \times f_{max}\]


604.3.1 Why This Matters
Undersampling (too slow) causes aliasing - high frequencies appear as low frequencies!
604.4 Practical Sampling Rate Examples
| Signal Type | Frequency | Minimum Sample Rate | Typical Rate | Reason |
|---|---|---|---|---|
| Temperature | ~0.01 Hz (slow) | 0.02 Hz | 1 Hz | Changes very slowly |
| Audio (human voice) | 300-3,400 Hz | 6,800 Hz | 8,000 Hz | Phone quality |
| Audio (music) | 20-20,000 Hz | 40,000 Hz | 44,100 Hz | CD quality |
| ECG (heart) | 0.5-100 Hz | 200 Hz | 250-500 Hz | Medical-grade clarity |
| Vibration | 10-1,000 Hz | 2,000 Hz | 5,000-10,000 Hz | Safety margin for harmonics |
| Accelerometer (gesture) | 50 Hz | 100 Hz | 200 Hz | Oversampling for noise |
Arduino Uno ADC: - Maximum sample rate: ~9,600 Hz (9.6 kHz) - Practical rate: ~1-5 kHz for stable readings
ESP32 ADC: - Maximum sample rate: ~83 kHz - Practical audio sampling: 16-48 kHz
604.5 Understanding Aliasing
604.6 Sampling Rate vs Power Consumption
WarningTradeoff: Sampling Rate vs. Power Consumption
Option A: High-frequency sampling (1000 Hz): Captures fast transients, supports 500 Hz signal bandwidth, power draw ~5mW continuous (ESP32 ADC at 1kHz), generates 86.4 million samples/day, requires 345 MB/day storage at 32-bit
Option B: Low-frequency sampling (1 Hz): Adequate for slow environmental signals (temperature, humidity), power draw ~0.005mW with sleep between samples, generates 86,400 samples/day, requires 345 KB/day storage
Decision Factors: For battery-powered environmental sensors where signals change over minutes/hours, 1 Hz sampling extends battery life 1000x while capturing all meaningful variation. For vibration analysis, motor monitoring, or audio capture, 1000+ Hz is mandatory to avoid aliasing. A smart approach uses adaptive sampling: high rate during detected events, low rate during quiet periods.
Power vs Sampling Rate: - ESP32 ADC power: ~2mA base + 0.001mA per sample/sec - @ 100 Hz: 2.1mA - @ 1 kHz: 3mA - @ 10 kHz: 12mA - For battery-powered devices: Sample only as fast as needed!
604.7 Anti-Aliasing Filters
TipAnti-Aliasing Filter Strategies
Problem: Real-world signals have infinite frequency components (noise, harmonics). How to ensure f_max before ADC?
Solution: Hardware Anti-Aliasing Filter
- Passive RC low-pass filter:
- R = 10k ohm, C = 1uF → f_cutoff = 15.9 Hz
- Blocks frequencies >50 Hz before ADC sampling at 100 Hz
- Cost: $0.15 (resistor + capacitor)
- Active Sallen-Key filter:
- Op-amp based, sharp roll-off
- 4th-order Butterworth: -80 dB/decade above cutoff
- Cost: $1-2 (op-amp + passives)
Best Practice: 1. Add hardware filter with f_cutoff = f_sample / 4 2. Sample at 2.5-5x desired f_max 3. Apply digital low-pass filter in software for extra margin
Example: 500 Hz vibration monitoring - Hardware filter: f_cutoff = 600 Hz (Sallen-Key 4th-order) - ADC sampling: 2500 Hz (5x oversampling) - Digital filter: 500 Hz FIR low-pass - Result: Aliasing risk <0.01%, reliable defect detection
Anti-Aliasing Filter Formula:
Before the ADC, use a low-pass filter to remove frequencies above f_max:
\[f_{cutoff} = \frac{f_{sample}}{2}\]
Why? If high-frequency noise (>f_sample/2) reaches the ADC, it aliases to lower frequencies, corrupting data.
Example: 1 kHz accelerometer sampling without anti-aliasing filter - Motor emits 1.2 kHz vibration harmonic - Nyquist frequency: 1000 Hz / 2 = 500 Hz - 1.2 kHz signal aliases to: |1200 Hz - 1000 Hz| = 200 Hz - False reading: 200 Hz vibration appears in data (doesn’t exist!) - Solution: Add RC low-pass filter with f_c = 400 Hz before ADC
604.8 Interactive: ADC Sampling and Aliasing Demo
604.9 Knowledge Check: Nyquist Theorem
NoteQuestion 1: Minimum Sampling Rate
You need to sample a 500 Hz signal. What is the minimum sampling rate?
A) 250 Hz B) 500 Hz C) 1000 Hz D) 2000 Hz
Show Answer
Answer: C) 1000 Hz
\[f_{sample} \geq 2 \times f_{max} = 2 \times 500Hz = 1000Hz\]
In practice, use 2.5-5x the signal frequency for better quality.
NoteQuestion 2: Aliasing Effect
What happens when you sample a 2 kHz signal at 3 kHz (below Nyquist rate)?
A) Signal is perfectly reconstructed B) Aliasing occurs - signal appears as 1 kHz C) Signal is lost completely D) Sampling rate is adequate
Show Answer
Answer: B) Aliasing occurs - signal appears as 1 kHz
Nyquist minimum = 2 x 2 kHz = 4 kHz. Sampling at 3 kHz causes aliasing.
The aliased frequency = |2 kHz - 3 kHz| = 1 kHz (incorrect representation).
NoteQuestion 3: Audio Memory Requirements
You’re sampling audio at 44.1 kHz with 16-bit resolution. How much memory is needed for 1 second of mono audio?
A) 44.1 KB B) 88.2 KB C) 176.4 KB D) 22.05 KB
Show Answer
Answer: B) 88.2 KB
\[Memory = Sample\ Rate \times Bytes\ Per\ Sample \times Duration\] \[= 44,100 samples/s \times 2 bytes \times 1s = 88,200 bytes = 88.2 KB\]
For stereo (2 channels), double this to 176.4 KB.
604.10 Summary
This chapter covered the Nyquist-Shannon Sampling Theorem - the fundamental rule for digitizing analog signals:
- Nyquist Theorem: Sample at least 2x the highest frequency component (f_sample >= 2 x f_max)
- Aliasing: Undersampling causes high frequencies to appear as lower frequencies
- Aliased Frequency: f_alias = |f_signal - f_sample| when Nyquist is violated
- Anti-Aliasing Filters: Hardware low-pass filters remove high frequencies before ADC
- Oversampling: Sampling at 2.5-5x f_max provides margin for filter roll-off
- Power Trade-offs: Higher sampling rates consume more power; sample only as fast as needed
Understanding Nyquist is essential for avoiding aliasing artifacts in IoT sensor data.
604.11 What’s Next?
Now that you understand sampling theory, continue to see practical worked examples of ADC and DAC calculations.
Continue to ADC/DAC Worked Examples →
NoteRelated Chapters & Resources
In This Series: - Binary Fundamentals - Binary number systems - ADC Fundamentals - How ADCs convert analog to digital - ADC/DAC Worked Examples - Practical calculations - DAC and PWM Output - Digital-to-analog conversion
Further Learning: - Signal Processing Essentials - Digital signal processing