%% fig-alt: "Threat modeling maturity model showing five progressive stages: Level 1 Ad-hoc where security is addressed only after incidents, Level 2 Repeatable with basic checklists and occasional reviews, Level 3 Defined with formal STRIDE analysis during design phase, Level 4 Managed with continuous threat assessment and metrics tracking, and Level 5 Optimized with automated threat detection and predictive security analytics. Each level includes key practices, tools used, and organizational indicators."
%%{init: {'theme': 'base', 'themeVariables': { 'primaryColor': '#2C3E50', 'primaryTextColor': '#fff', 'primaryBorderColor': '#16A085', 'lineColor': '#16A085', 'secondaryColor': '#E67E22', 'tertiaryColor': '#7F8C8D'}}}%%
flowchart TB
    subgraph L1["LEVEL 1: AD-HOC"]
        L1A["Security after incidents only"]
        L1B["No formal process"]
        L1C["Reactive firefighting"]
    end

    subgraph L2["LEVEL 2: REPEATABLE"]
        L2A["Basic checklists"]
        L2B["Occasional reviews"]
        L2C["Manual documentation"]
    end

    subgraph L3["LEVEL 3: DEFINED"]
        L3A["Formal STRIDE analysis"]
        L3B["Design-phase reviews"]
        L3C["Documented threat models"]
    end

    subgraph L4["LEVEL 4: MANAGED"]
        L4A["Continuous assessment"]
        L4B["Metrics and KPIs"]
        L4C["Automated tooling"]
    end

    subgraph L5["LEVEL 5: OPTIMIZED"]
        L5A["Predictive analytics"]
        L5B["Threat intelligence"]
        L5C["ML-based detection"]
    end

    L1 --> L2 --> L3 --> L4 --> L5

    L1 -.-> T1["Tools: None"]
    L2 -.-> T2["Tools: Spreadsheets"]
    L3 -.-> T3["Tools: Microsoft TMT, OWASP Threat Dragon"]
    L4 -.-> T4["Tools: IriusRisk, ThreatModeler"]
    L5 -.-> T5["Tools: AI/ML platforms, SIEM integration"]

    style L1 fill:#e74c3c,stroke:#c0392b,color:#fff
    style L2 fill:#E67E22,stroke:#d35400,color:#fff
    style L3 fill:#f39c12,stroke:#E67E22,color:#fff
    style L4 fill:#16A085,stroke:#0e6655,color:#fff
    style L5 fill:#2C3E50,stroke:#16A085,color:#fff
1400 STRIDE Framework and Threat Taxonomies
1400.1 Learning Objectives
By the end of this chapter, you will be able to:
- Apply the STRIDE Model: Use Microsoft’s STRIDE framework to systematically identify threats
- Understand Threat Taxonomies: Navigate comprehensive IoT threat classification systems
- Map Threats to Security Properties: Connect STRIDE categories to CIA triad violations
- Model Attack Scenarios: Build attack trees showing step-by-step compromise paths
- Identify Entry Points: Map all attack surfaces across IoT system architecture
NoteRelated Chapters
Threat Modeling Series: - Introduction & Fundamentals - Threat modeling basics and decision trees - Attack Scenarios - Real-world attack patterns - Assessments - Knowledge checks and quizzes - Hands-On Lab - Interactive threat detection simulator
Security Context: - Security Overview - Security landscape - Device Security - Device hardening - Encryption - Cryptographic protection
TipFor Beginners: STRIDE Framework
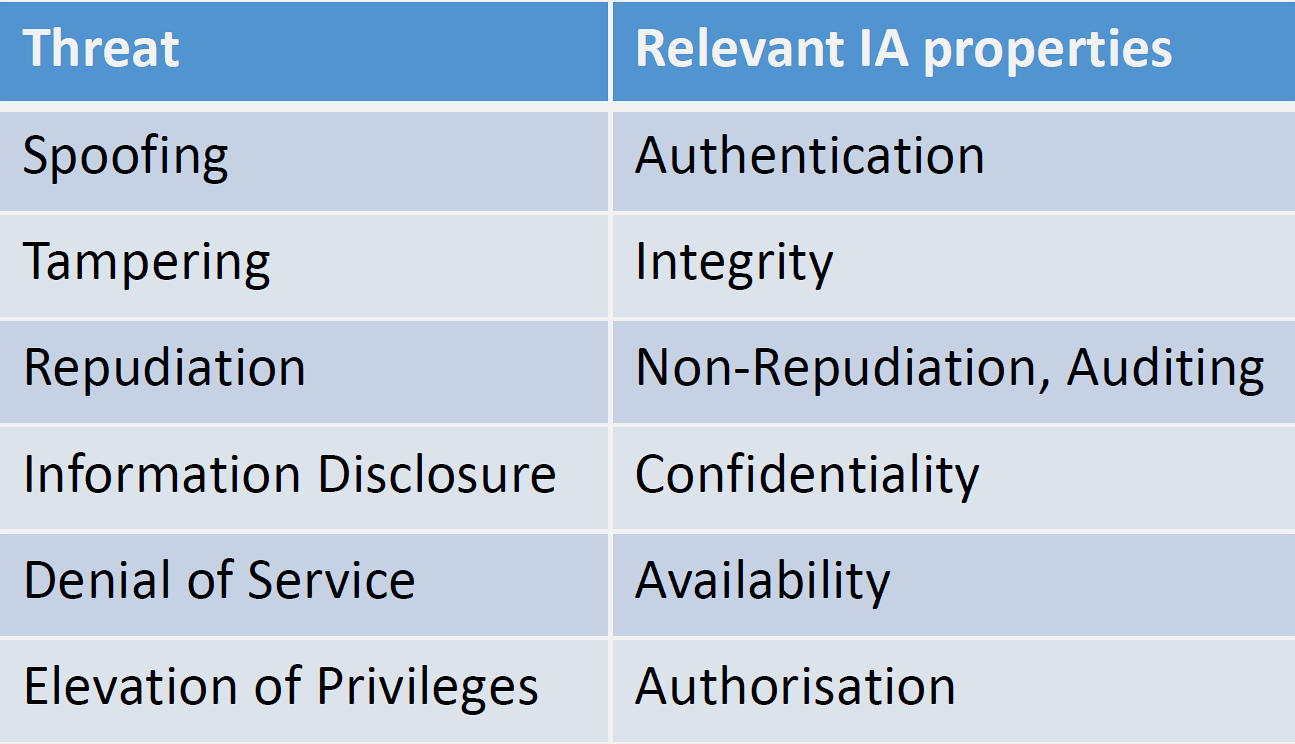
What is STRIDE? STRIDE is Microsoft’s threat modeling framework that helps you systematically identify six types of security threats: Spoofing (fake identity), Tampering (data modification), Repudiation (denying actions), Information disclosure (data leaks), Denial of service (making systems unavailable), and Elevation of privilege (gaining unauthorized access).
Why does it matter? STRIDE provides a checklist to ensure you don’t miss common vulnerability classes. Instead of guessing what might go wrong, you systematically ask: “Can an attacker spoof identity here? Can they tamper with data? Can they deny they did something?” This structured approach catches threats that ad-hoc brainstorming misses.
Key terms: | Term | Maps To | IoT Example | |——|———|————-| | Spoofing | Authentication | Attacker sends fake sensor data pretending to be legitimate device | | Tampering | Integrity | Attacker modifies firmware to inject malware | | Repudiation | Non-repudiation | Malicious user deletes audit logs to hide their actions | | Information Disclosure | Confidentiality | Attacker intercepts unencrypted Wi-Fi to steal passwords | | Denial of Service | Availability | Botnet floods IoT gateway with traffic, making it unresponsive | | Elevation of Privilege | Authorization | Attacker exploits firmware bug to gain root access |
TipMVU: STRIDE Threat Modeling
Core Concept: STRIDE systematically identifies six threat categories (Spoofing, Tampering, Repudiation, Information disclosure, Denial of service, Elevation of privilege) by asking what can go wrong at each component and trust boundary. Why It Matters: Ad-hoc threat analysis misses vulnerability classes; STRIDE’s structured checklist catches 95% of common IoT security flaws. Key Takeaway: Apply STRIDE at every trust boundary (device→gateway, gateway→cloud, user→app) to systematically uncover attack vectors.
1400.2 Threat Modelling Process
Threat Modelling: Structured analysis of system vulnerabilities from an attacker’s perspective to identify risks, quantify likelihood and severity, and prioritize mitigation mechanisms.
1400.2.1 Five-Step Process

NoteAlternative View: Threat Modeling Maturity Stages
This view shows how organizations progress through threat modeling maturity, from reactive to proactive security:
Assessment Questions: - Level 1: Do you only address security after breaches? (Start here) - Level 2: Do you have security checklists but apply them inconsistently? - Level 3: Is threat modeling integrated into your design process? - Level 4: Do you measure and track security metrics continuously? - Level 5: Can you predict and prevent threats before they materialize?
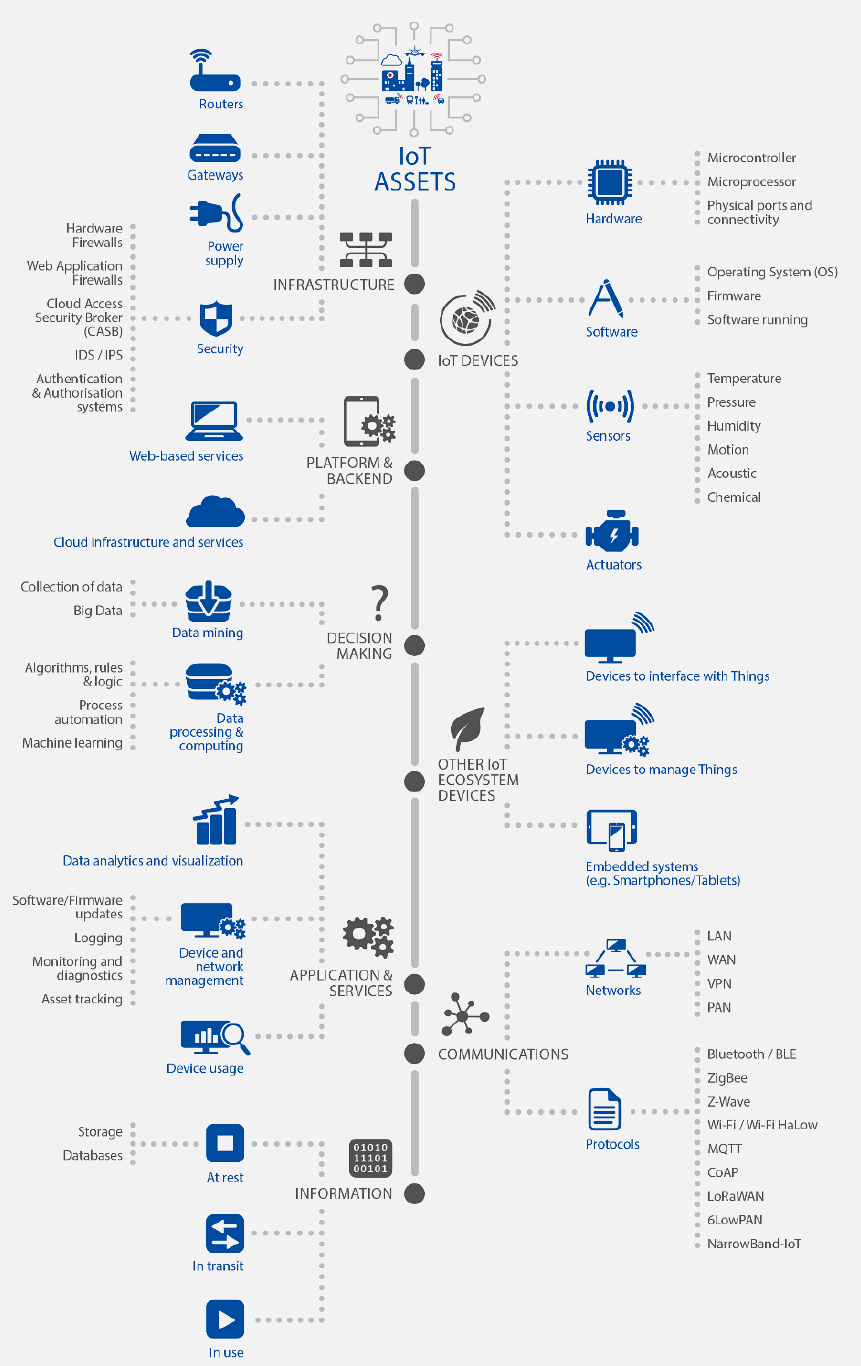
1. Architecture Knowledge: - Identify all components (sensors, gateways, cloud services) - Map communication protocols - Document data storage locations - Understand key entities and their roles
2. Entry Points: - Physical interfaces (UART, JTAG, USB) - Network interfaces (Wi-Fi, Bluetooth, cellular) - Application interfaces (APIs, web portals) - Update mechanisms (OTA firmware)
3. Data Flow Paths: - Source → Processing → Storage → Transmission - Identify where data is encrypted/decrypted - Map authentication and authorization points
4. Trust Boundaries: - IoT device (often least trusted) - Gateway (may be trusted if secured) - Cloud services (typically most trusted) - User/admin interfaces
5. Attack Scenarios: - Based on experience and threat intelligence - Consider Advanced Persistent Threats (APTs) - Model both opportunistic and targeted attacks
1400.3 Threat Taxonomies
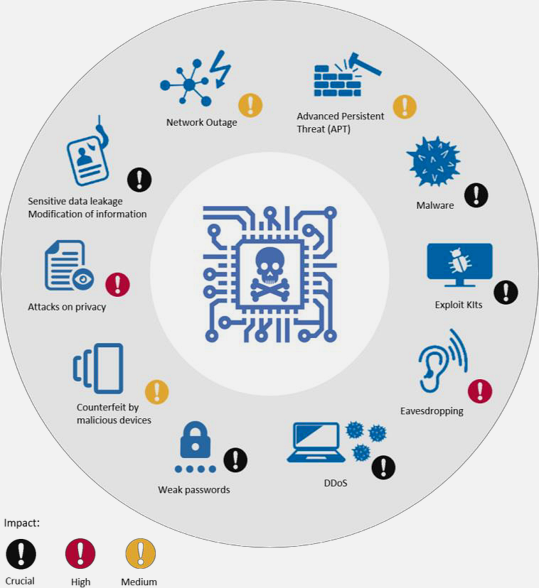
NoteAI-Generated Visual: Threat Categories (Artistic Rendering)

NoteAI-Generated Visual: Technical Threats (Artistic Rendering)

NoteAI-Generated Visual: IoT Threat Landscape

The threat landscape visualization helps security teams understand the breadth of potential attack vectors and prioritize defensive investments based on organizational risk profiles.
NoteAI-Generated Visual: Threat Surface Analysis

NoteAI-Generated Visual: Threat Taxonomy Structure

This structured taxonomy provides a systematic framework for threat identification during security assessments and penetration testing engagements.
1400.3.1 STRIDE (Microsoft)
NoteAlternative Visual: STRIDE Framework (Artistic Rendering)

This artistic rendering emphasizes how the six STRIDE categories interact and overlap in real-world IoT attack scenarios. Understanding these interconnections helps security architects design comprehensive defense strategies.
NoteAlternative Visual: STRIDE Pedagogical Model

This teaching-oriented visualization helps students systematically work through each STRIDE category when analyzing IoT system security.
NoteAlternative Visual: STRIDE Model Detail

STRIDE: Comprehensive threat classification model applicable across IoT system components.

NoteAlternative View: STRIDE-to-Defense Mapping
This view maps each STRIDE threat category to specific defensive controls, showing the complete mitigation strategy:
%% fig-alt: "STRIDE threat-to-defense mapping showing each threat category connected to specific security controls: Spoofing countered by multi-factor authentication, certificates, and biometrics; Tampering countered by digital signatures, checksums, and tamper-evident hardware; Repudiation countered by audit logs, timestamps, and digital signatures; Information Disclosure countered by encryption, access controls, and data masking; Denial of Service countered by rate limiting, redundancy, and DDoS protection; Elevation of Privilege countered by least privilege, RBAC, and sandboxing."
%%{init: {'theme': 'base', 'themeVariables': { 'primaryColor': '#2C3E50', 'primaryTextColor': '#fff', 'primaryBorderColor': '#16A085', 'lineColor': '#16A085', 'secondaryColor': '#E67E22', 'tertiaryColor': '#7F8C8D'}}}%%
flowchart LR
    subgraph THREATS["STRIDE THREATS"]
        S["Spoofing<br/>Identity"]
        T["Tampering<br/>Data"]
        R["Repudiation<br/>Actions"]
        I["Information<br/>Disclosure"]
        D["Denial of<br/>Service"]
        E["Elevation of<br/>Privilege"]
    end

    subgraph DEFENSES["SECURITY CONTROLS"]
        D1["MFA + Certificates<br/>+ Biometrics"]
        D2["Digital Signatures<br/>+ Checksums + TPM"]
        D3["Audit Logs<br/>+ Timestamps + Signing"]
        D4["Encryption<br/>+ ACLs + Masking"]
        D5["Rate Limiting<br/>+ Redundancy + CDN"]
        D6["Least Privilege<br/>+ RBAC + Sandboxing"]
    end

    S --> D1
    T --> D2
    R --> D3
    I --> D4
    D --> D5
    E --> D6

    style S fill:#e74c3c,stroke:#c0392b,color:#fff
    style T fill:#E67E22,stroke:#d35400,color:#fff
    style R fill:#f39c12,stroke:#E67E22,color:#fff
    style I fill:#3498db,stroke:#2980b9,color:#fff
    style D fill:#9b59b6,stroke:#8e44ad,color:#fff
    style E fill:#e74c3c,stroke:#c0392b,color:#fff
    style D1 fill:#16A085,stroke:#0e6655,color:#fff
    style D2 fill:#16A085,stroke:#0e6655,color:#fff
    style D3 fill:#16A085,stroke:#0e6655,color:#fff
    style D4 fill:#16A085,stroke:#0e6655,color:#fff
    style D5 fill:#16A085,stroke:#0e6655,color:#fff
    style D6 fill:#16A085,stroke:#0e6655,color:#fff
IoT-Specific Defense Implementation:
| STRIDE | Primary Defense | IoT Implementation | Cost Impact |
|---|---|---|---|
| Spoofing | Device certificates | X.509 in secure element | +$2-5/device |
| Tampering | Secure boot + TPM | Hardware root of trust | +$3-8/device |
| Repudiation | Blockchain audit | Distributed ledger logging | +$1-2/device |
| Information Disclosure | E2E encryption | TLS 1.3 + encrypted storage | +$1-3/device |
| Denial of Service | Rate limiting | Edge firewall + CDN | +$0.50-2/device |
| Elevation of Privilege | RBAC + sandboxing | Container isolation | +$1-3/device |
STRIDE Mapping to Security Properties:
| STRIDE Category | Security Property | Attack Example |
|---|---|---|
| Spoofing | Authentication | Attacker impersonates legitimate IoT device |
| Tampering | Integrity | Modify sensor readings or firmware |
| Repudiation | Non-Repudiation | Deny sending malicious commands |
| Information Disclosure | Confidentiality | Intercept unencrypted sensor data |
| Denial of Service | Availability | Flood network with requests |
| Elevation of Privilege | Authorization | Gain admin access from user account |
1400.3.2 Open Threat Taxonomy
Four Threat Categories:

Technical Threats (Most Common in IoT):
- Credential discovery (sniffing, brute forcing, cracking)
- Escalation/abuse of system privileges
- Cryptanalysis
- Denial of Service (DoS)
- Data capture/manipulation in transit
- Application exploitation (code injection, reverse engineering, API abuse)
Severity Rating: Each threat rated 1-5 based on likelihood and impact.
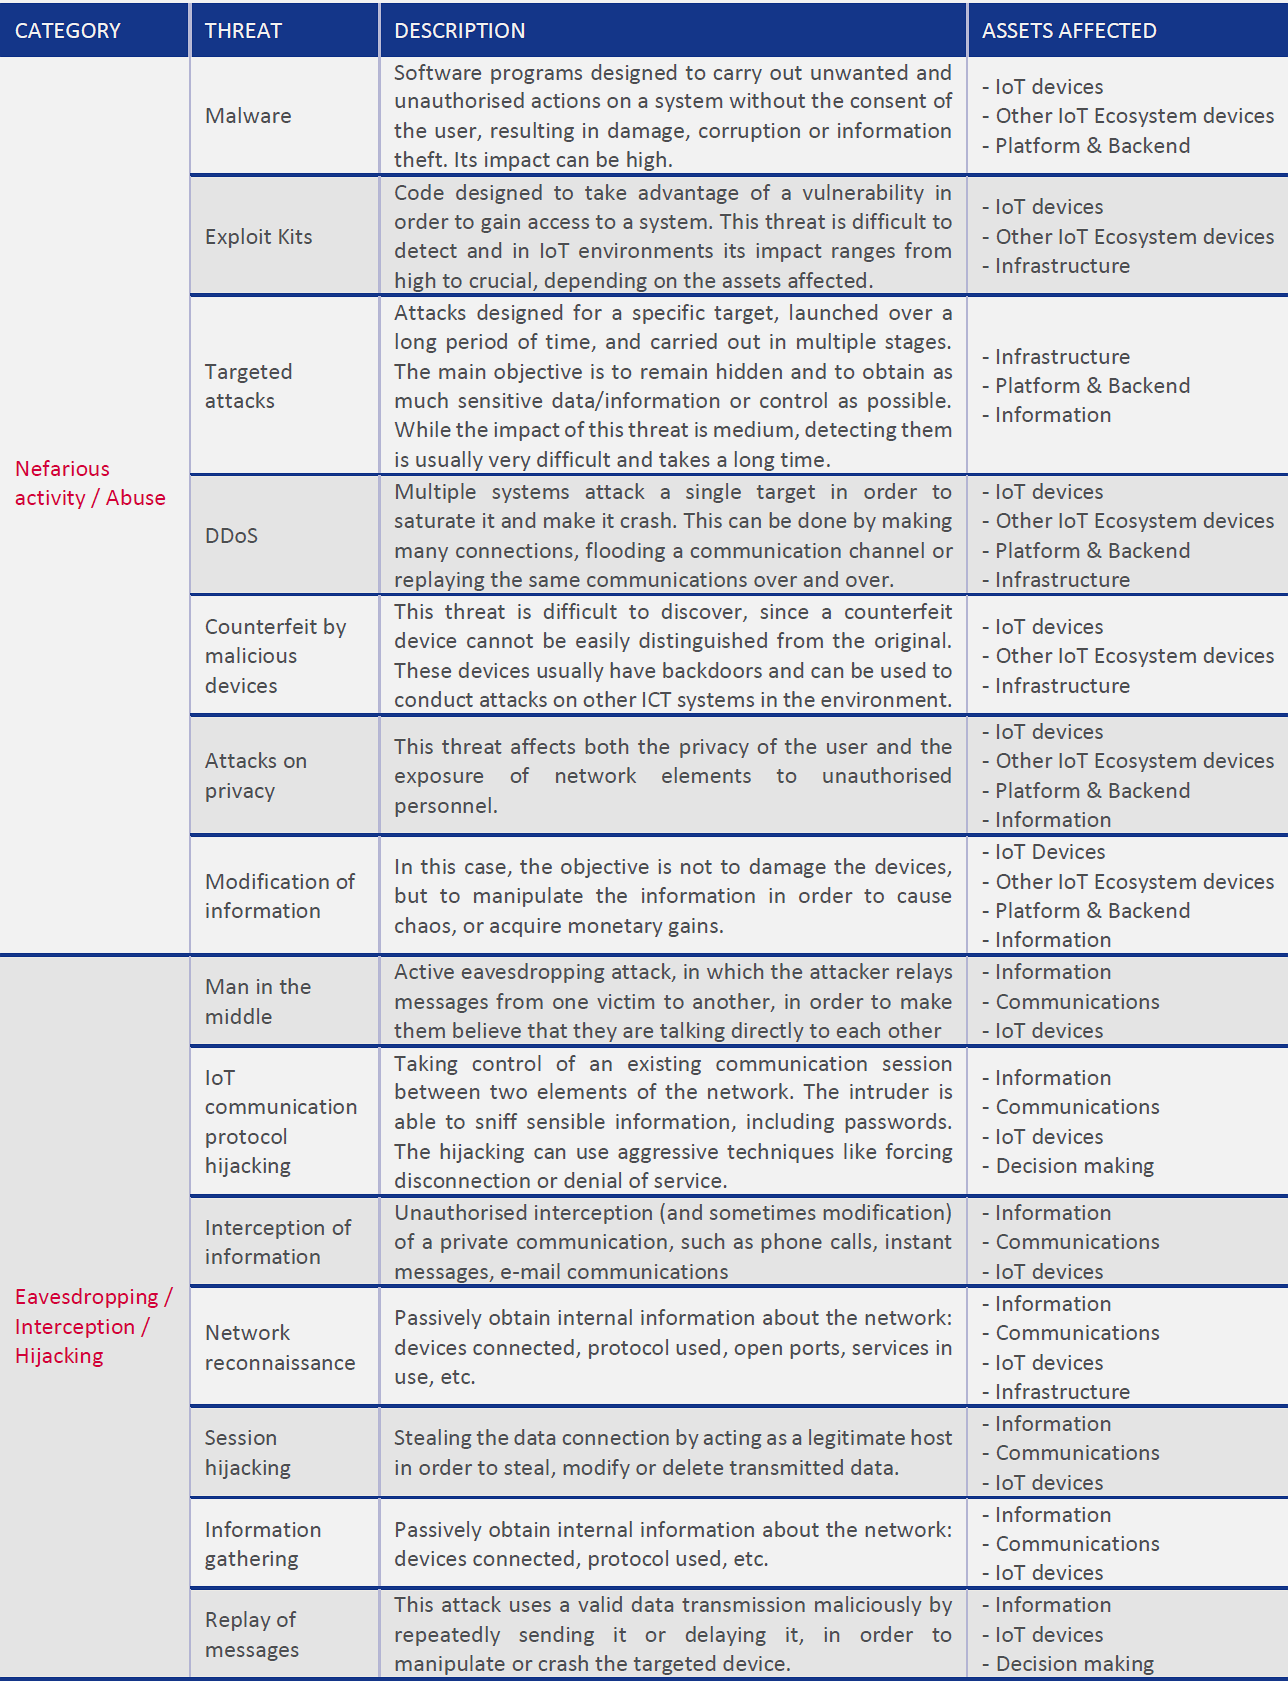
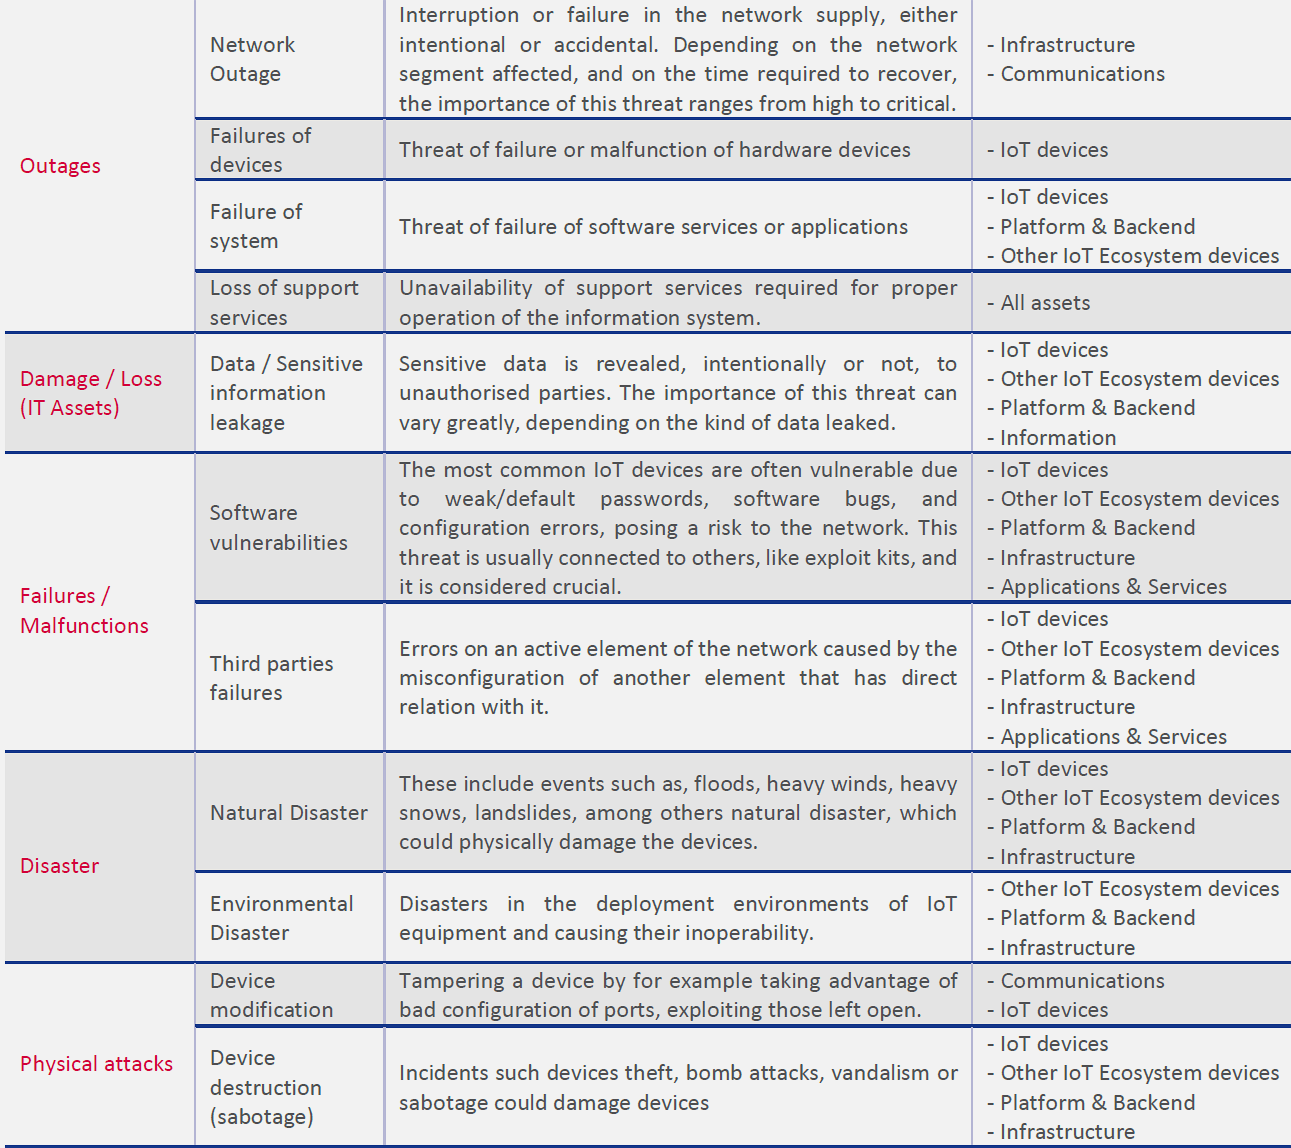
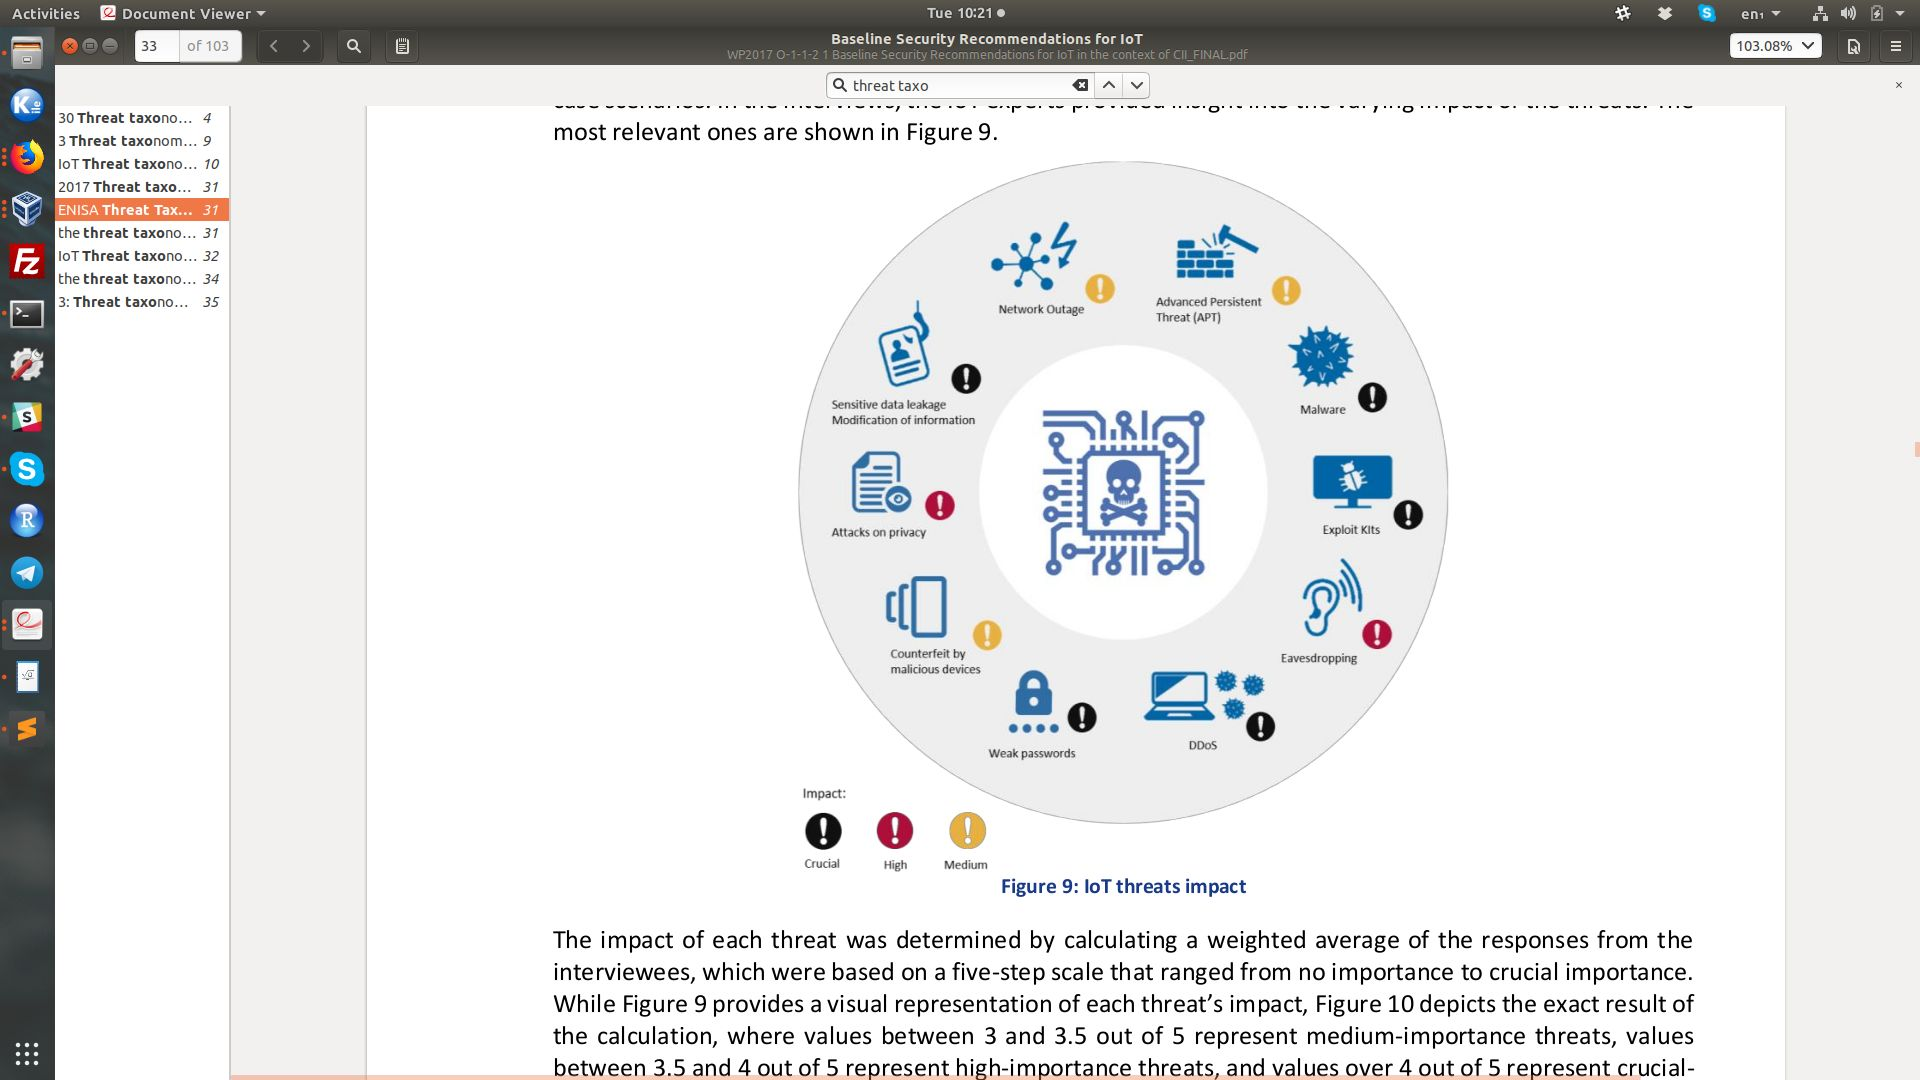
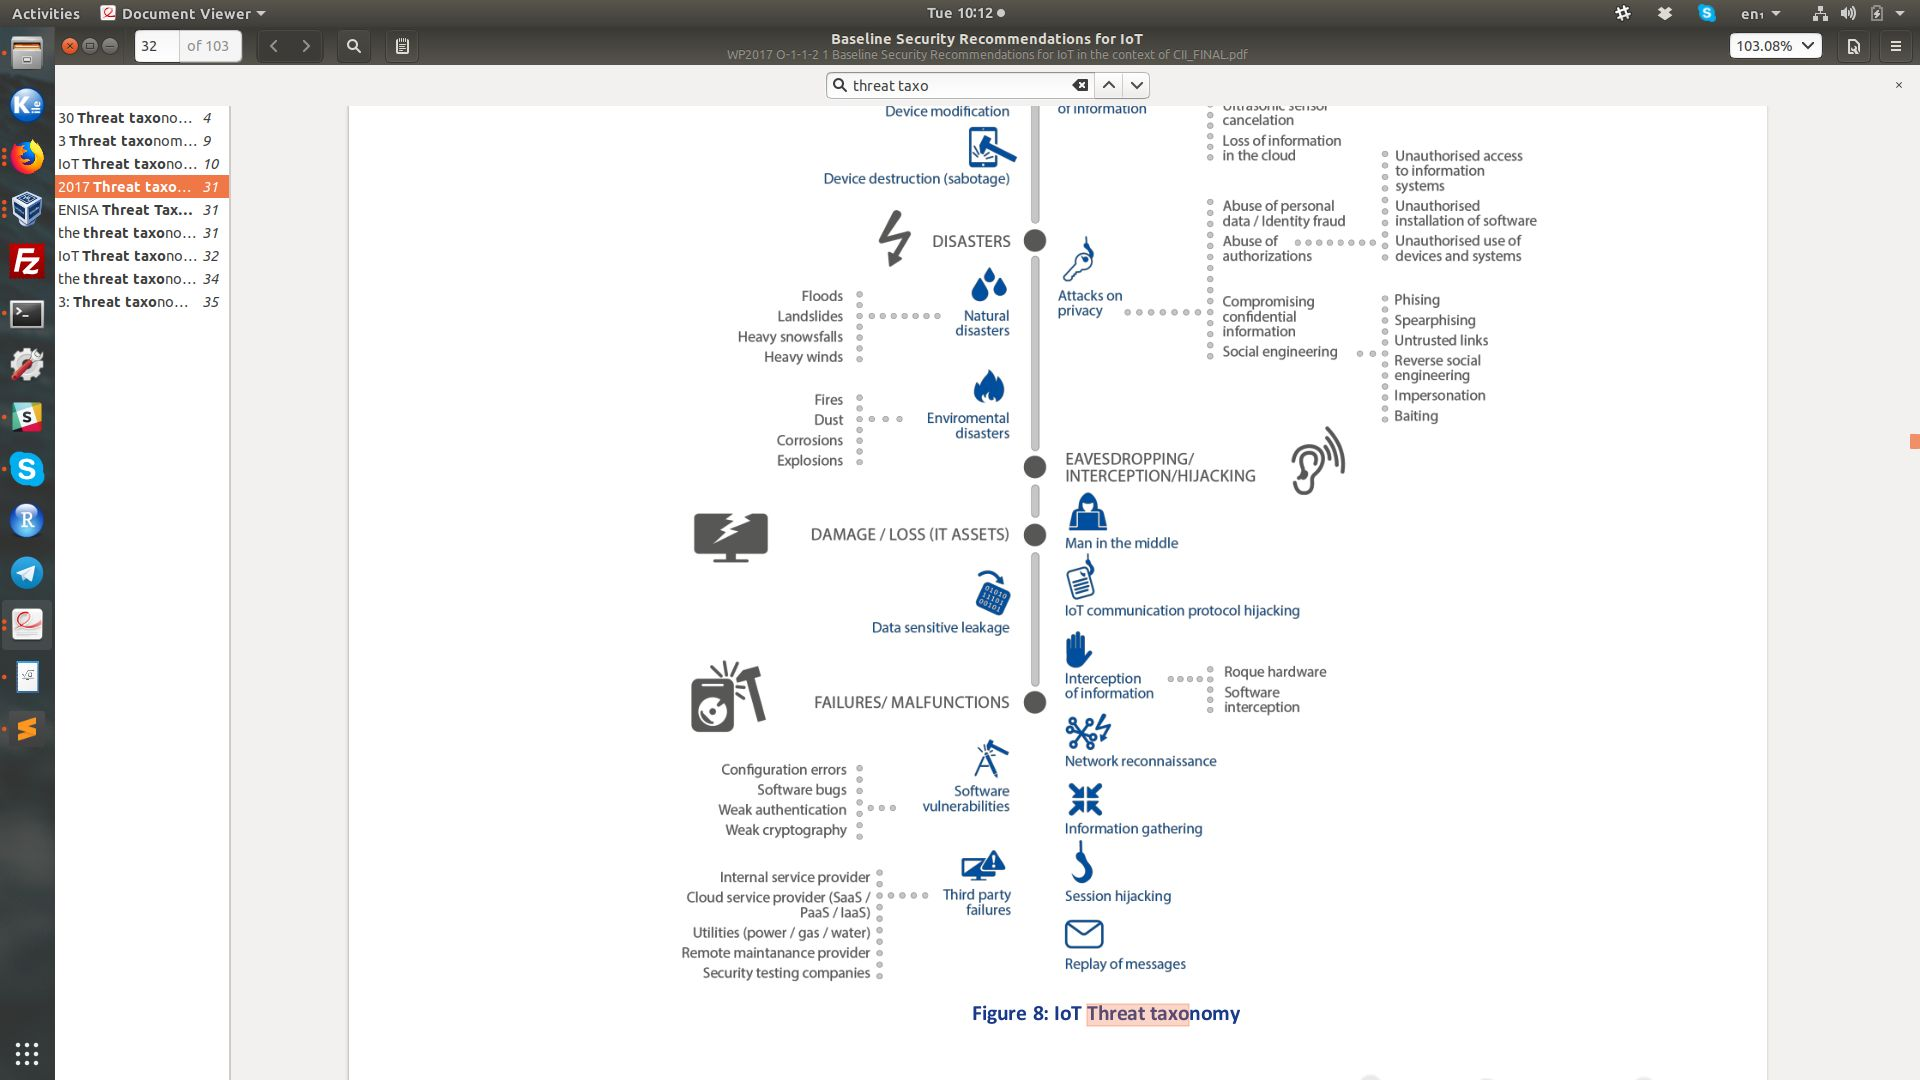
1400.3.3 ENISA IoT Threat Taxonomy
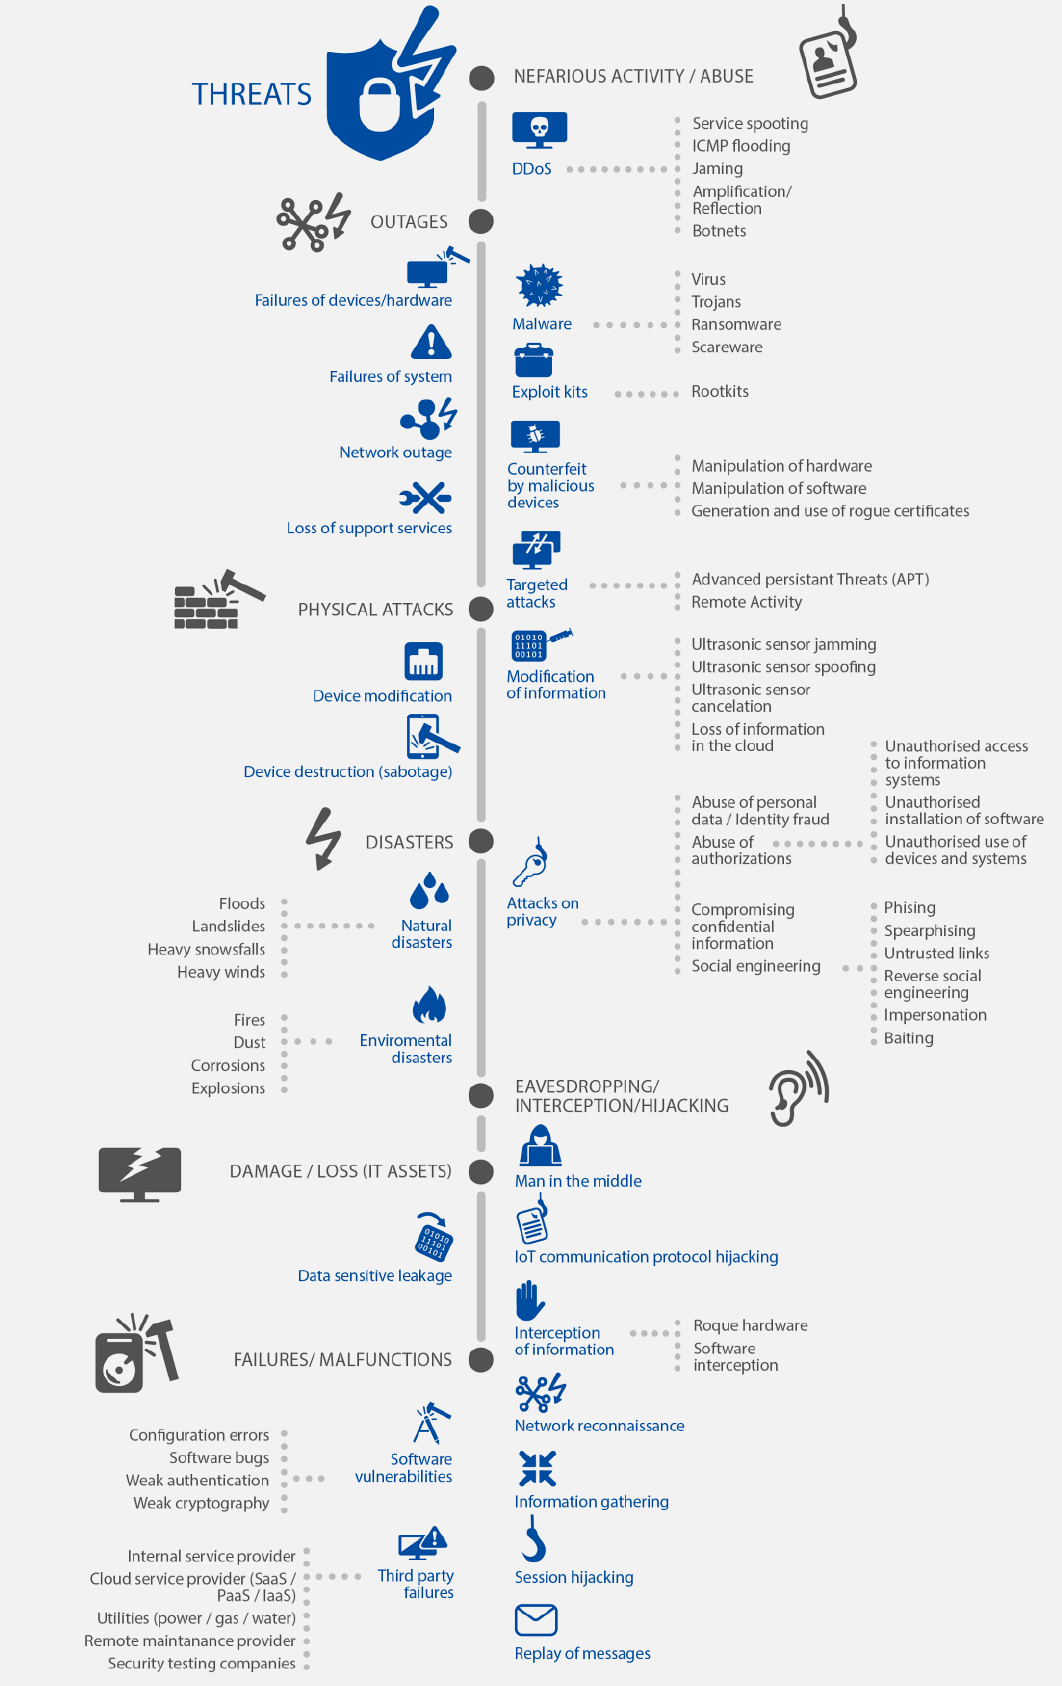
European Union Agency for Cybersecurity (ENISA) provides IoT-specific threat taxonomy.

1400.3.4 IoT Threat Taxonomy: A Structured View
Understanding threats requires systematic categorization across the entire IoT stack. The following mindmap provides a comprehensive view of threats organized by layer:

1400.3.4.1 Attack Surface by IoT Component
Each component in an IoT system presents unique vulnerabilities that attackers can exploit:
| Component | Primary Threats | Impact | Mitigation Priority |
|---|---|---|---|
| Sensors | Spoofing, tampering | Data integrity | Medium |
| MCU/SoC | Side-channel, fault injection | Complete compromise | High |
| Radio | Eavesdropping, jamming | Availability, privacy | High |
| Gateway | MITM, privilege escalation | Network pivot | Critical |
| Cloud API | Injection, auth bypass | Mass compromise | Critical |
| Mobile App | Reverse engineering, credential theft | Account takeover | High |
WarningCritical Insight: The Weakest Link
IoT security is only as strong as the weakest component. A secure cloud API is worthless if device firmware accepts unsigned updates. Defense in depth requires securing every layer.
1400.4 What’s Next
Now that you understand STRIDE and threat taxonomies, continue to:
- Attack Scenarios: See how these threats manifest in real IoT attacks
- Assessments: Test your STRIDE knowledge with quizzes
- Hands-On Lab: Practice threat detection and risk scoring
Or revisit:
- Introduction & Fundamentals: Review threat modeling basics
1400.5 Summary
This chapter covered systematic threat identification using STRIDE and comprehensive threat taxonomies:
STRIDE Framework: Six threat categories that map to security properties - Spoofing attacks authentication - Tampering attacks integrity - Repudiation attacks non-repudiation - Information Disclosure attacks confidentiality - Denial of Service attacks availability - Elevation of Privilege attacks authorization
Threat Modeling Process: Five-step systematic analysis 1. Architecture knowledge (components, protocols, data flows) 2. Entry points (physical, network, application interfaces) 3. Data flow paths (where data is encrypted, authenticated) 4. Trust boundaries (device, gateway, cloud, user interfaces) 5. Attack scenarios (opportunistic and targeted threats)
IoT Attack Surfaces: Multiple layers of vulnerability - Device layer (firmware, debug ports, storage) - Network layer (protocols, wireless, APIs) - Application layer (mobile apps, web dashboards) - Cloud layer (APIs, databases, authentication) - Physical layer (tampering, theft, environmental)
Key Insight: IoT security is only as strong as the weakest link. A secure cloud API is worthless if device firmware accepts unsigned updates. Defense in depth requires securing every layer.
Continue to Attack Scenarios to see how these theoretical threats manifest in real-world IoT breaches.