1393  IoT Attack Scenarios and Risk Assessment

1393.1 Learning Objectives

By the end of this chapter, you will be able to:

  • Analyze Real Attack Scenarios: Understand how IoT systems are compromised in practice
  • Assess Risk Using DREAD: Apply the DREAD framework to score threat severity
  • Prioritize Vulnerabilities: Rank risks by likelihood, impact, and exploitability
  • Use Threat Assessment Tools: Apply interactive tools to evaluate your IoT systemโ€™s risk profile
  • Document Threat Models: Create comprehensive security assessments for IoT deployments

Threat Modeling Series: - Introduction & Fundamentals - Threat modeling basics - STRIDE Framework - Systematic threat identification - Assessments - Quizzes and knowledge checks - Hands-On Lab - Interactive simulator

Security Context: - Security Overview - Security landscape - Device Security - Device hardening - Threats & Vulnerabilities - Attack catalog

What is DREAD? DREAD is a risk scoring framework that helps prioritize which threats to fix first by rating five factors on a 0-10 scale: Damage potential (how bad if exploited), Reproducibility (how easy to replicate attack), Exploitability (how much skill/effort needed), Affected users (how many people impacted), and Discoverability (how easy to find the vulnerability).

Why does it matter? You canโ€™t fix everything at once. DREAD scores help you focus on high-risk vulnerabilities (high score = critical threat) and accept low-risk ones (low score = monitor but donโ€™t panic). A vulnerability with damage=10 but exploitability=2 might be lower priority than damage=7 with exploitability=9.

Key terms: | Factor | Question | Low (0-3) | Medium (4-7) | High (8-10) | |โ€”โ€”โ€“|โ€”โ€”โ€”-|โ€”โ€”โ€”โ€“|โ€”โ€”โ€”โ€”โ€“|โ€”โ€”โ€”โ€”-| | Damage | How bad if exploited? | Minor inconvenience | Service disruption | Data breach, life safety | | Reproducibility | How consistent? | Rarely works | Works sometimes | Works every time | | Exploitability | How hard to exploit? | Expert with custom tools | Skilled attacker | Script kiddie with Metasploit | | Affected users | How many impacted? | Single user | Department/region | Entire user base | | Discoverability | How easy to find? | Requires source code | Public vulnerability DB | Obvious (default password) |

TipMVU: DREAD Risk Scoring

Core Concept: DREAD scores threats on five dimensions (Damage, Reproducibility, Exploitability, Affected users, Discoverability) to create a quantitative risk priority ranking. Why It Matters: Not all threats are equal; fixing low-risk threats wastes resources while critical vulnerabilities remain exploitable. Key Takeaway: Calculate DREAD score = (D+R+E+A+D)/5; prioritize threats with scores >7.0 for immediate remediation.

1393.2 IoT Attack Scenarios

โฑ๏ธ ~18 min | โญโญโญ Advanced | ๐Ÿ“‹ P11.C05.U04

Comprehensive overview of 10 critical IoT attack scenarios including network eavesdropping, sensor manipulation, actuator sabotage, administration system compromise, protocol exploitation, command injection, stepping stone attacks, DDoS botnet creation, power manipulation, and ransomware attacks with attack vectors and impact analysis
Figure 1393.1: IoT attack scenarios overview

1393.2.1 10 Critical IoT Attack Vectors

Graph diagram

Graph diagram
Figure 1393.2: Ten Critical IoT Attack Vectors: From Eavesdropping to Ransomware

1393.2.2 
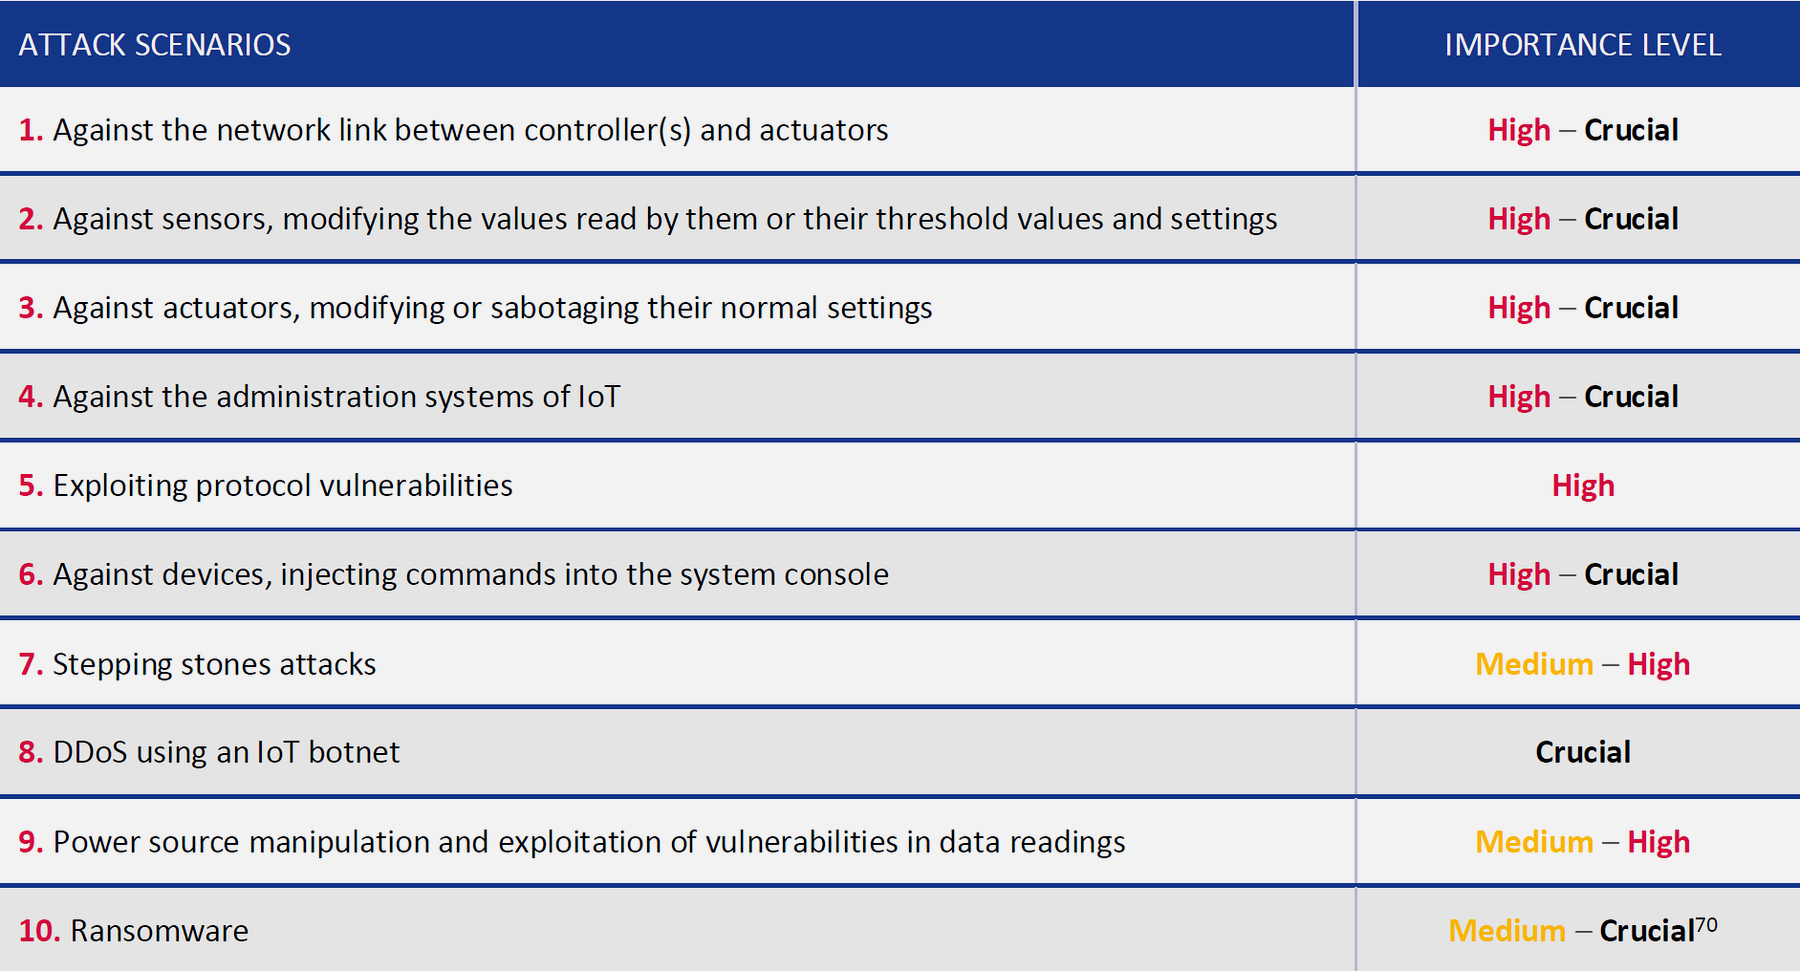
Attack Scenario Details

1. Network Link Eavesdropping

Target: Communication between controllers and actuators

Attack: Passive interception of network traffic to extract sensitive operational information

Impact: - Data leakage - Intelligence gathering for Advanced Persistent Threats (APTs) - Identification of weak spots for future attacks

Mitigation: - End-to-end encryption (TLS/DTLS) - Network segmentation - Intrusion detection systems - Regular traffic analysis


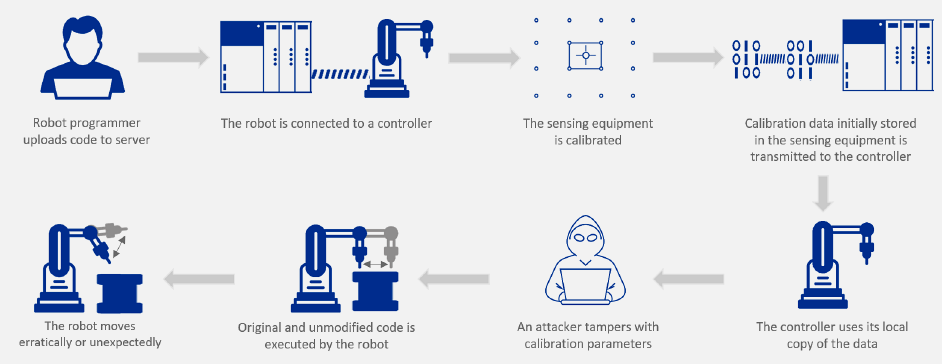
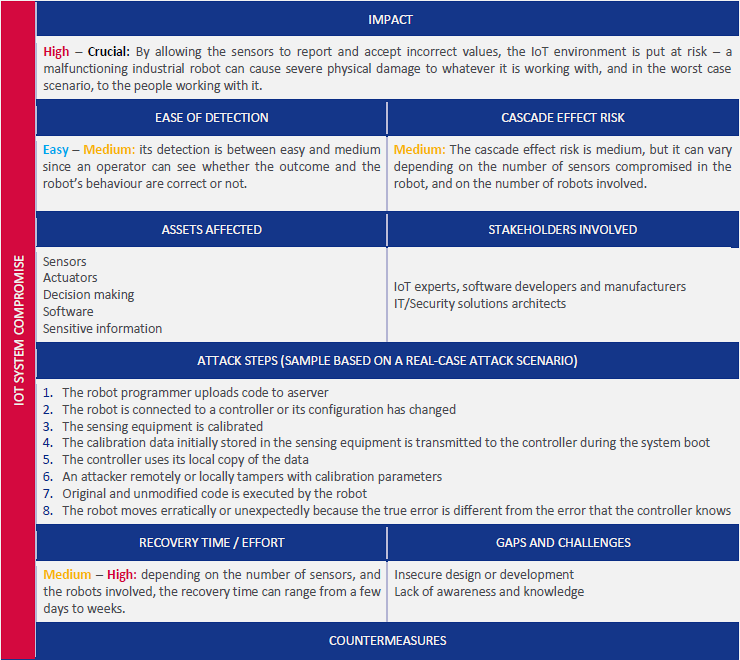
2. Sensor Manipulation

Target: Sensor threshold values and configuration

Attack: Modify calibration parameters to accept out-of-range values

Impact: - Incorrect sensor readings - Safety system failures - Physical damage to equipment (e.g., power spikes)

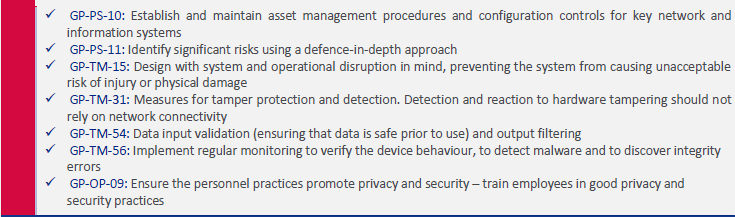
Mitigation: - Tamper-resistant hardware - Integrity checking of configuration - Multiple redundant sensors - Anomaly detection algorithms


3. Actuator Sabotage

Target: Actuator configuration and operational parameters

Attack: Modify settings to cause malfunction or incorrect operation

Impact: - Production disruptions - Safety hazards - Equipment damage - Environmental incidents

Mitigation: - Command authentication - Configuration validation - Physical access controls - Fail-safe mechanisms


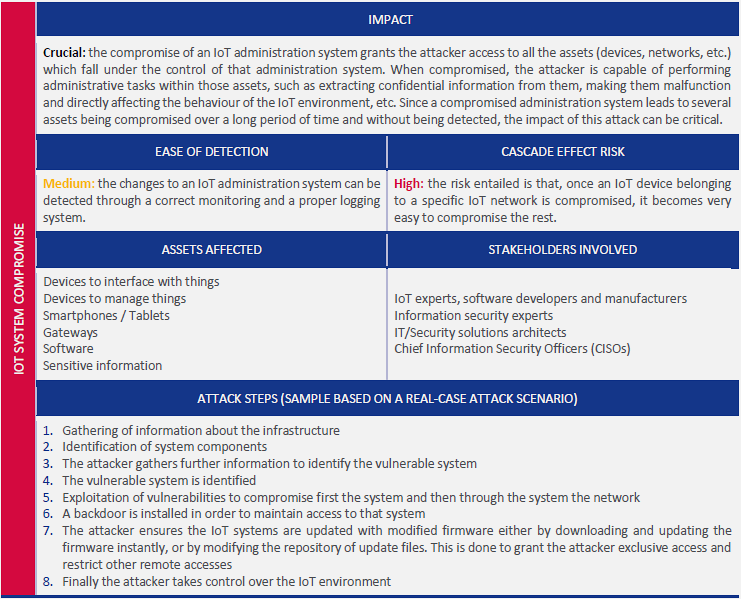
4. Administration System Compromise

Target: IoT device management systems

Attack: Gain full control via weak/default credentials, then modify entire deployment

Impact: - Complete system compromise - Mass device manipulation - Network-wide disruption - Cascading failures

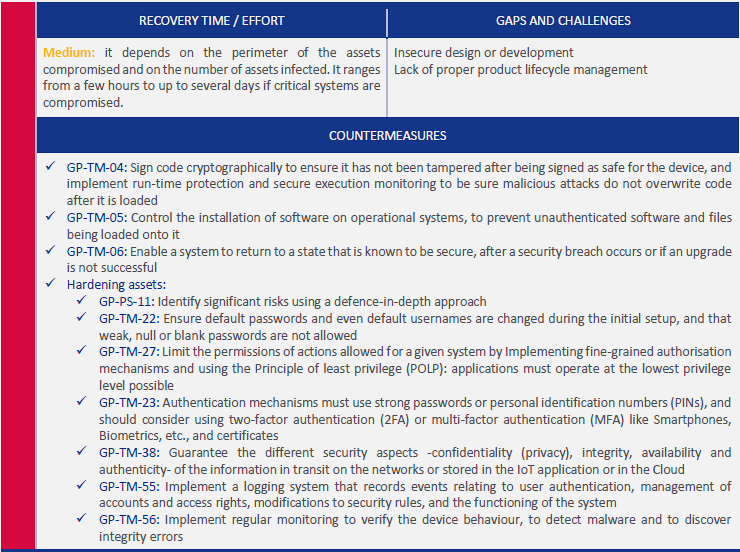
Mitigation: - Strong authentication (MFA) - Regular credential rotation - Principle of least privilege - Network segmentation


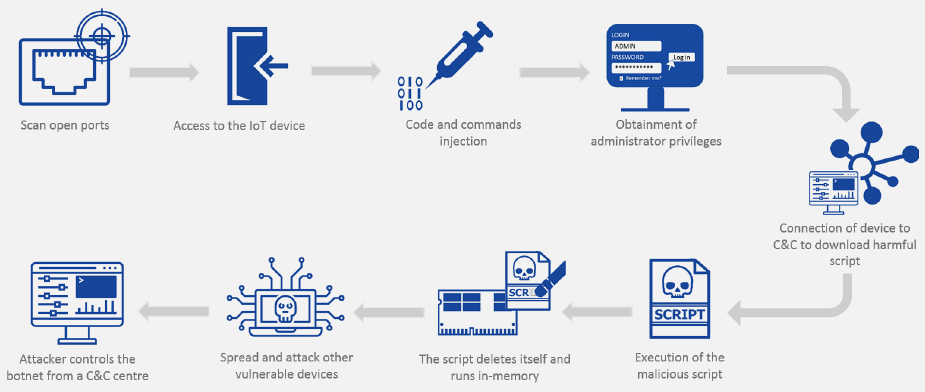
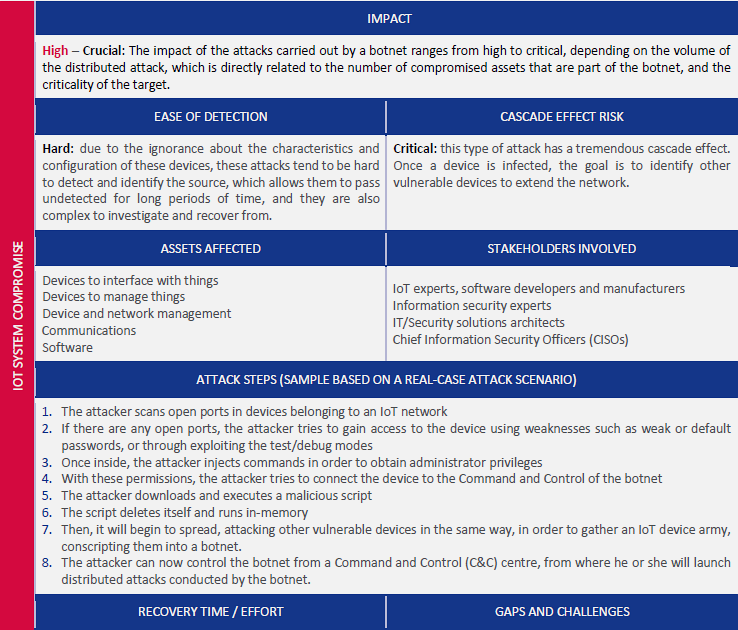
8. DDoS Using IoT Botnet

Target: External services using compromised IoT devices

Attack: Mirai-style botnet creation for distributed attacks

Impact: - Service unavailability for victims - Network bandwidth exhaustion - Reputation damage - Legal liability

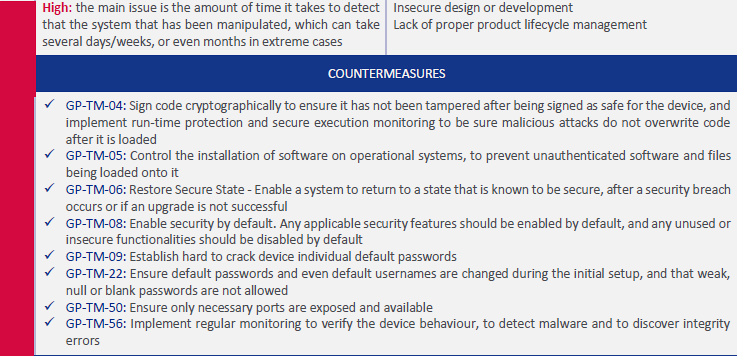
Mitigation: - Secure default configurations - Automatic security updates - Network traffic monitoring - Bot detection systems


10. Ransomware

Target: IoT devices and data

Attack: Malware blocks access to data/functionality until ransom paid

Impact: - Critical service disruption - Safety risks (medical devices, thermostats, power grids) - Financial losses - Public safety threats

Mitigation: - Regular backups - Offline recovery systems - Security patching - User awareness training

1393.3 Critical Attack Scenario Analysis

1393.3.1 Scenario 1: IoT Administration System Compromise

Scenario 1
Figure 1393.3: Attack scenario 1: Administration system compromise
Scenario 1 Threat 1
Figure 1393.4: Attack scenario 1: Threat 1
Scenario 1 Threat 2
Figure 1393.5: Attack scenario 1: Threat 2

Objective: Gain persistent control over IoT devices through gateway compromise.

Graph diagram

Graph diagram
Figure 1393.6: Administration System Compromise Attack: Seven-Stage Chain from Reconnaissance to Full Device Control

Attack Steps:

  1. Reconnaissance: Network scanning to identify IoT devices and services
  2. Intelligence Gathering: Determine device models, firmware versions, vulnerabilities
  3. Exploitation: Leverage weak credentials, unpatched vulnerabilities
  4. Network Compromise: Gain access to gateway or management system
  5. Persistence: Install backdoor, create accounts, disable logging
  6. Firmware Update: Push malicious firmware to maintain control
  7. Full Control: Remote access, data theft, device manipulation

Countermeasures:

  • Network segmentation (separate IoT from corporate network)
  • Strong authentication and authorization
  • Regular security audits and penetration testing
  • Intrusion detection and prevention systems
  • Firmware signature verification
  • Incident response planning

1393.3.2 Scenario 2: Value Manipulation in IoT Devices

Scenario 2
Figure 1393.7: Attack scenario 2: Value manipulation overview
Scenario 2 Threat 1
Figure 1393.8: Attack scenario 2: Threat 1
Scenario 2 Threat 2
Figure 1393.9: Attack scenario 2: Threat 2

Objective: Manipulate sensor calibration to cause industrial robot malfunction.

Graph diagram

Graph diagram
Figure 1393.10: Sensor Value Manipulation Attack: Calibration Interception to Safety Incident Chain

Attack Steps:

  1. Intercept Calibration: Capture calibration data during boot or reconfiguration
  2. Modify Thresholds: Change acceptable ranges for sensor readings
  3. Inject Modified Data: Send manipulated calibration to controller
  4. Wrong Decisions: Robot makes incorrect decisions based on bad sensor data
  5. Safety Incident: Erratic movements, equipment damage, personnel injury

Countermeasures:

  • Encrypted calibration data transmission
  • Digital signatures on configuration files
  • Integrity checks (hash verification)
  • Redundant sensors with cross-validation
  • Anomaly detection (detect out-of-pattern behavior)
  • Physical tamper detection

1393.3.3 Scenario 3: Botnet Creation via Command Injection

Scenario 3
Figure 1393.11: Attack scenario 3: Botnet creation overview
Scenario 3 Threat 1
Figure 1393.12: Attack scenario 3: Threat 1
Scenario 3 Threat 2
Figure 1393.13: Attack scenario 3: Threat 2

Objective: Build IoT botnet (Mirai-style) for DDoS attacks.

Graph diagram

Graph diagram
Figure 1393.14: Mirai-Style Botnet Attack: Eight-Stage Chain from Scanning to DDoS Launch

Attack Steps:

  1. Scanning: Identify Internet-exposed IoT devices with open ports (23, 22, 80)
  2. Brute Force: Try default credentials (admin/admin, root/12345, etc.)
  3. Command Injection: Inject shell commands to gain admin privileges
  4. Malware Download: Connect to Command & Control (C&C) to download malicious payload
  5. In-Memory Execution: Run malware in RAM (no disk traces), delete after loading
  6. Propagation: Scan for more vulnerable devices, replicate attack
  7. Botnet Formation: Thousands of compromised devices controlled by C&C
  8. DDoS Launch: Coordinated attack against victim infrastructure

Real-World Example: Mirai Botnet - Compromised 600,000+ IoT devices - Used 62 default credential combinations - Launched massive DDoS (620 Gbps against Krebs on Security) - Targeted DNS provider Dyn, disrupting major websites

Countermeasures:

  • Pre-Deployment:
    • Eliminate default credentials
    • Disable unnecessary services (Telnet)
    • Implement firewall rules
    • Enable automatic updates
  • Runtime:
    • Network traffic monitoring
    • Anomaly detection (unusual scanning activity)
    • Rate limiting outbound connections
    • Quarantine compromised devices
  • Post-Compromise:
    • Incident response procedures
    • Device reflashing/factory reset
    • Network forensics
    • Patch vulnerable firmware
Geometric diagram of a comprehensive risk assessment framework for IoT security. The visualization shows the risk calculation process combining threat likelihood, vulnerability severity, and asset value to produce risk scores. Color-coded risk levels from green (low) through yellow (medium) to red (critical) help prioritize security investments. The framework includes quantitative metrics for business impact assessment.
Figure 1393.15: Risk Assessment Framework - Geometric visualization of IoT security risk calculation

This risk assessment framework provides a systematic approach to evaluating and prioritizing IoT security threats based on quantifiable metrics.

Artistic representation of the threat modeling process showing data flow diagrams, trust boundaries, and threat identification points. The visualization guides security analysts through the systematic process of identifying threats, from initial system decomposition through trust boundary mapping to final threat enumeration. Attack trees branch from identified threat nodes showing potential exploitation paths.
Figure 1393.16: Threat Modeling Process - Artistic guide to systematic threat identification
Artistic diagram showing STRIDE-based threat modeling applied to an IoT system architecture. Each component in the system is analyzed against all six STRIDE categories, with threat identification annotations and recommended countermeasures. The visualization demonstrates how to systematically apply STRIDE across device, network, gateway, and cloud layers.
Figure 1393.17: STRIDE Threat Modeling Applied - Systematic analysis across IoT layers
Geometric matrix visualization mapping STRIDE threat categories against IoT system components. The matrix format allows quick identification of which threat types apply to each component, with severity indicators and recommended controls. Rows represent STRIDE categories while columns represent device, network, gateway, cloud, and application components.
Figure 1393.18: STRIDE Threat Matrix - Geometric component-by-threat mapping

1393.4 Worked Example: Vulnerability Risk Assessment

โฑ๏ธ ~15 min | โญโญโญ Advanced | ๐Ÿ“‹ P11.C05.U05

TipWorked Example: Smart Lock Vulnerability Risk Assessment

Context: A security researcher discovers a buffer overflow vulnerability in a popular smart lockโ€™s firmware that could allow remote code execution. The manufacturer must assess the risk and decide on remediation strategy.

Given:

  • Vulnerability: Buffer overflow in BLE command handler allowing remote code execution
  • Affected devices: 50,000 deployed smart locks in residential and commercial buildings
  • Exploitation requirements: Network access (BLE range ~30m) + crafted packet sequence
  • Potential impact: Unauthorized entry, credential theft, malware injection, physical security breach

1393.4.1 Step 1: CVSS 3.1 Base Score Calculation

The Common Vulnerability Scoring System (CVSS) provides a standardized method for rating vulnerability severity.

Graph diagram

Graph diagram
Figure 1393.19: CVSS 3.1 Base Score Components: Exploitability Metrics, Impact Metrics, and Scope Calculation
CVSS Metric Value Score Justification
Attack Vector (AV) Network (N) 0.85 Exploitable over BLE network, no physical contact needed
Attack Complexity (AC) Low (L) 0.77 No special conditions required, straightforward exploit
Privileges Required (PR) None (N) 0.85 Attacker needs no prior authentication
User Interaction (UI) None (N) 0.85 Victim doesnโ€™t need to perform any action
Scope (S) Changed (C) - Compromised lock affects physical security beyond the device
Confidentiality (C) High (H) 0.56 Complete disclosure of lock codes, user schedules, access logs
Integrity (I) High (H) 0.56 Attacker can modify lock state, add unauthorized codes
Availability (A) Low (L) 0.22 Lock can be temporarily disabled but core function recoverable

CVSS Calculation:

\[\text{Impact} = 1 - [(1 - C) \times (1 - I) \times (1 - A)]\] \[\text{Impact} = 1 - [(1 - 0.56) \times (1 - 0.56) \times (1 - 0.22)]\] \[\text{Impact} = 1 - [0.44 \times 0.44 \times 0.78] = 1 - 0.151 = 0.849\]

For Changed Scope: \[\text{Adjusted Impact} = 7.52 \times (\text{Impact} - 0.029) - 3.25 \times (\text{Impact} - 0.02)^{15}\] \[\text{Adjusted Impact} = 7.52 \times 0.820 - 3.25 \times 0.829^{15} = 6.17 - 0.27 = 5.90\]

\[\text{Exploitability} = 8.22 \times AV \times AC \times PR \times UI\] \[\text{Exploitability} = 8.22 \times 0.85 \times 0.77 \times 0.85 \times 0.85 = 3.89\]

\[\text{Base Score} = \min[1.08 \times (\text{Impact} + \text{Exploitability}), 10]\] \[\text{Base Score} = \min[1.08 \times (5.90 + 3.89), 10] = \min[10.57, 10] = \boxed{9.9}\]

Result: CVSS 9.9 (Critical) - Immediate action required


1393.4.2 Step 2: Risk Quantification (Annual Loss Expectancy)

Converting the technical vulnerability score to business risk using quantitative analysis:

Risk Factor Value Source/Justification
Probability of exploit within 1 year 10% Based on vulnerability disclosure timelines, attacker motivation for physical access targets
Average loss per breach event $5,000 Includes: property theft ($2,500 avg), liability ($1,500), reputation/customer churn ($1,000)
Expected loss per device $500 0.10 ร— $5,000 = $500
Total fleet at risk 50,000 devices Current deployment footprint

Fleet Risk Calculation:

\[\text{Annual Loss Expectancy (ALE)} = \text{Probability} \times \text{Impact} \times \text{Fleet Size}\] \[\text{ALE} = 0.10 \times \$5,000 \times 50,000 = \boxed{\$25,000,000}\]

Additional Risk Factors:

  • Regulatory fines: Up to $50,000 per incident under various consumer protection laws
  • Class action liability: Estimated $5-15M if breach affects >1,000 users
  • Brand damage: 12-18% customer churn post-breach (industry average)
  • Insurance premiums: 40% increase after disclosed vulnerability

1393.4.3 Step 3: Remediation Cost-Benefit Analysis

Graph diagram

Graph diagram
Figure 1393.20: Smart Lock Remediation Cost-Benefit Analysis: Investment vs Risk Reduction ROI

Remediation Cost Breakdown:

Cost Category Amount Details
Development $500,000 Security fix development, code review, vulnerability hardening
Testing & QA $200,000 Regression testing, security validation, penetration testing
OTA Infrastructure $300,000 Secure update distribution, rollback capability, monitoring
Customer Support $250,000 Update notifications, troubleshooting, documentation
Per-device deployment $25/device OTA bandwidth, device testing, success verification
Total (50K devices) $2,500,000 Fixed costs + (50,000 ร— $25)

Risk Reduction Analysis:

\[\text{Risk Reduction} = 95\%\] (industry standard for critical patch) \[\text{Residual Risk} = \$25M \times 0.05 = \$1.25M\] (accounts for patch failures, unupdated devices) \[\text{Avoided Loss} = \$25M \times 0.95 = \$23.75M\]

Return on Investment (ROI):

\[\text{ROI} = \frac{\text{Avoided Loss} - \text{Remediation Cost}}{\text{Remediation Cost}} \times 100\] \[\text{ROI} = \frac{\$23.75M - \$2.5M}{\$2.5M} \times 100 = \frac{\$21.25M}{\$2.5M} \times 100 = \boxed{850\%}\]


1393.4.4 Final Answer: Executive Decision Summary

Factor Value Interpretation
CVSS Base Score 9.9 (Critical) Top 1% severity - requires immediate response
Annual Risk Exposure $25 million Unacceptable business risk
Remediation Cost $2.5 million ~10% of risk exposure
Risk Reduction 95% $23.75M avoided losses
ROI of Patching 850% (10:1 return) Exceptionally favorable investment
Residual Risk $1.25 million Acceptable with insurance/monitoring
Decision IMMEDIATE PATCH REQUIRED Within 30-day responsible disclosure window

Timeline Recommendation:

Phase Duration Action
Day 1-7 Week 1 Emergency security patch development
Day 8-14 Week 2 Internal QA and penetration testing
Day 15-21 Week 3 Beta rollout to 1,000 devices, monitoring
Day 22-30 Week 4 Full fleet OTA deployment
Day 31+ Ongoing Monitor patch success rate, support non-updated devices

Key Insight: This quantified risk analysis transforms a technical vulnerability into a clear business decision. The 10:1 ROI makes immediate patching not just a security imperative but a financially sound investment. Without quantification, security investments often lose priority to revenue-generating projects.

1393.5 Interactive Threat Assessment Tool

Evaluate the security posture of your IoT deployment:

WarningDisclaimer

This tool provides educational guidance only. For production deployments, conduct formal threat modeling (STRIDE, DREAD) and engage professional security auditors.

1393.6 Whatโ€™s Next

Now that you understand attack scenarios and risk assessment, continue to:

  • Assessments: Test your knowledge with comprehensive quizzes
  • Hands-On Lab: Practice threat detection with an interactive simulator

Or explore mitigation strategies:

1393.7 Summary

This chapter explored real-world IoT attack scenarios and risk assessment methodologies:

Critical Attack Scenarios: How IoT systems are actually compromised - Default credentials enable botnet recruitment (Mirai) - Firmware vulnerabilities allow remote code execution - Man-in-the-middle attacks intercept unencrypted traffic - Physical access leads to device compromise - Supply chain attacks inject malware at manufacturing

DREAD Risk Scoring: Quantitative threat prioritization - Damage: Impact if exploited (0-10 scale) - Reproducibility: Consistency of exploit - Exploitability: Skill/effort required - Affected users: Scale of impact - Discoverability: Ease of finding vulnerability

Risk = (D + R + E + A + D) / 5

Worked Examples: Applying DREAD to real vulnerabilities - Smart lock firmware bug: DREAD = 8.2 (critical priority) - Environmental sensor default password: DREAD = 7.4 (high priority) - Thermostat weak encryption: DREAD = 6.0 (medium priority)

Interactive Threat Assessment: Hands-on risk evaluation tool helps you score your own IoT systemโ€™s vulnerabilities and generate actionable remediation plans.

Key Insight: Threat modeling isnโ€™t just theoretical - it directly maps to how attackers actually compromise IoT systems. Understanding these patterns helps you design effective defenses.

Continue to the Assessments chapter to test your understanding or jump to the Hands-On Lab for practical experience.