%% fig-alt: "Three-layer IoT architecture showing perception layer at bottom with sensors and actuators, network layer in middle with Wi-Fi/Zigbee/MQTT, and application layer at top with mobile apps and cloud services"
flowchart TB
    subgraph Application["<b>Application Layer</b><br/>User Interface & Business Logic"]
        A1["Mobile App"]
        A2["Cloud Dashboard"]
        A3["Analytics Engine"]
    end

    subgraph Network["<b>Network Layer</b><br/>Communication & Connectivity"]
        N1["Wi-Fi Router"]
        N2["Zigbee Gateway"]
        N3["MQTT Broker"]
    end

    subgraph Perception["<b>Perception Layer</b><br/>Physical Devices"]
        P1["Temperature Sensor"]
        P2["Smart Lock"]
        P3["Motion Detector"]
    end

    Perception -->|Data uplink| Network
    Network -->|Commands downlink| Perception
    Network -->|Internet| Application
    Application -->|Control| Network

    style Application fill:#16A085,color:#fff
    style Network fill:#2C3E50,color:#fff
    style Perception fill:#E67E22,color:#fff
1487 Design Model for IoT: Introduction & Reference Architectures
1487.1 Learning Objectives
After completing this section, you will be able to:
- Understand fundamental IoT architectural models and frameworks
- Apply layered architecture patterns to IoT system design
- Compare three-layer vs five-layer architectures
- Understand the IoT-A reference model
- Evaluate trade-offs in different architectural choices
1487.2 Prerequisites
Before diving into this chapter, you should be familiar with:
- IoT Reference Models: Understanding of basic IoT architectural concepts provides the foundation for applying design models and frameworks
- Communication Networks: Knowledge of networking protocols helps you understand how the network layer fits into overall IoT design models
- Sensor Fundamentals: Familiarity with sensors and actuators is essential for understanding the perception layer in IoT design models
- User Experience Design: UX design principles inform the human-centered design thinking approach presented in this chapter
TipFor Beginners: What is a Design Model?
Think of a design model like a blueprint for building a house.
Before construction starts, architects create blueprints showing where walls go, how plumbing connects, and where electrical wires run. Design models for IoT are similar—they’re organized frameworks that show how all the pieces of your system fit together.
Why do we need design models?
| Without a Model | With a Model |
|---|---|
| “Let’s just start coding!” | “Here’s how sensors connect to the cloud” |
| Random architecture | Organized layers with clear responsibilities |
| Hard to scale or maintain | Easy to add features, troubleshoot issues |
| Team confusion | Everyone speaks the same language |
The three-layer model (simplest IoT architecture):
%%{init: {'theme': 'base', 'themeVariables': { 'primaryColor': '#2C3E50', 'primaryTextColor': '#fff', 'primaryBorderColor': '#16A085', 'lineColor': '#E67E22', 'secondaryColor': '#7F8C8D', 'fontSize': '12px'}}}%%
flowchart LR
    subgraph UserActions["User Experience"]
        U1["User taps<br/>'Turn on light'"]
        U5["User sees<br/>'Light is ON'"]
    end

    subgraph AppLayer["Application Layer"]
        A1["App sends<br/>command request"]
        A2["App receives<br/>status update"]
    end

    subgraph NetLayer["Network Layer"]
        N1["MQTT broker<br/>routes message"]
        N2["Gateway<br/>translates protocol"]
    end

    subgraph PercLayer["Perception Layer"]
        P1["Smart bulb<br/>receives command"]
        P2["Light turns ON<br/>confirms state"]
    end

    U1 --> A1
    A1 --> N1
    N1 --> N2
    N2 --> P1
    P1 --> P2
    P2 -.->|"State change"| N2
    N2 -.-> N1
    N1 -.-> A2
    A2 --> U5

    style U1 fill:#16A085,stroke:#2C3E50,stroke-width:2px,color:#fff
    style U5 fill:#16A085,stroke:#2C3E50,stroke-width:2px,color:#fff
    style A1 fill:#16A085,stroke:#2C3E50,stroke-width:1px,color:#fff
    style A2 fill:#16A085,stroke:#2C3E50,stroke-width:1px,color:#fff
    style N1 fill:#2C3E50,stroke:#16A085,stroke-width:1px,color:#fff
    style N2 fill:#2C3E50,stroke:#16A085,stroke-width:1px,color:#fff
    style P1 fill:#E67E22,stroke:#2C3E50,stroke-width:1px,color:#fff
    style P2 fill:#E67E22,stroke:#2C3E50,stroke-width:1px,color:#fff
Real-world analogy:
| Layer | House Analogy | IoT Example |
|---|---|---|
| Perception | Light switches, thermostats | Temperature sensor, smart lock |
| Network | Electrical wires in walls | Wi-Fi, Zigbee, MQTT broker |
| Application | Control panel, smartphone app | Mobile app showing “72°F” |
Design thinking for IoT (5 phases):
- Empathize 👂 — Understand what users actually need
- Define 📝 — Clearly state the problem to solve
- Ideate 💡 — Brainstorm many possible solutions
- Prototype 🔧 — Build quick, cheap test versions
- Test 🧪 — Get real feedback, iterate
Key insight: A design model isn’t just theory—it’s your roadmap. Without it, building IoT systems is like constructing a house by randomly stacking bricks and hoping it turns out okay.
1487.3 Introduction
Designing IoT systems requires a structured approach that addresses the unique challenges of integrating physical devices, network connectivity, data processing, and user interaction. Unlike traditional software systems, IoT designs must consider hardware constraints, real-time requirements, energy efficiency, scalability, and the physical environment.
This chapter explores established design models and frameworks that provide systematic approaches to IoT system development. These models help architects and developers make informed decisions about system structure, component interactions, and technology choices.
NoteAcademic Resource: Edinburgh IoT Design - Preferred Wearable Technology Locations
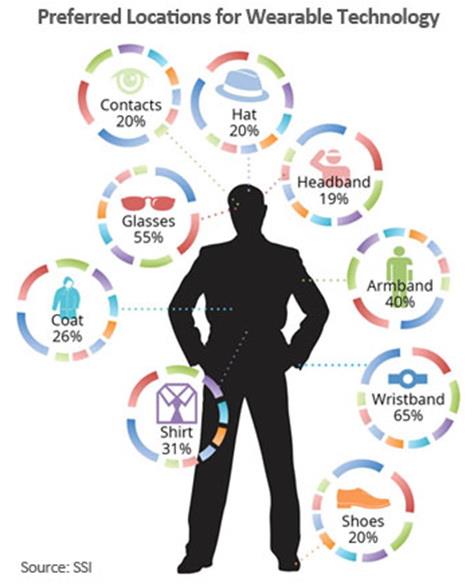
This market research data informs IoT design decisions: - Wrist dominates (65%): Design for familiar watch/band form factor - Glasses potential (55%): Smart eyewear is an emerging opportunity (despite Google Glass setback) - Smart clothing interest (31% shirt, 26% coat): E-textiles show market potential - Contact lenses low (20%): Invasive approaches face adoption barriers
Source: University of Edinburgh - Principles and Design of IoT Systems (SSI survey)
1487.4 IoT Reference Architectures
1487.4.1 Three-Layer Architecture
The most basic IoT architecture consists of three layers:
%% fig-alt: "Three-layer IoT architecture diagram showing perception layer at bottom with sensors and actuators collecting raw data, network layer in middle with IoT gateway and network infrastructure processing and routing data, and application layer at top with cloud platform and user applications providing services. Arrows show data flowing upward from devices through network to cloud, and control commands flowing downward from applications through network to devices."
graph TB
    subgraph app[" "]
        direction LR
        cloud["Cloud Platform<br/>Data Storage & Analytics"]
        ui["User Applications<br/>Mobile & Web Apps"]
    end

    subgraph net[" "]
        direction LR
        gateway["IoT Gateway<br/>Protocol Translation"]
        router["Network Infrastructure<br/>Wi-Fi, Cellular, LPWAN"]
    end

    subgraph percep[" "]
        direction LR
        sensors["Sensors<br/>Temp, Humidity, Motion"]
        actuators["Actuators<br/>Locks, Valves, Motors"]
    end

    percep -->|Raw Data| net
    net -->|Processed Data| app
    app -->|Commands| net
    net -->|Control Signals| percep

    classDef layer1 fill:#E67E22,stroke:#2C3E50,color:#fff
    classDef layer2 fill:#2C3E50,stroke:#2C3E50,color:#fff
    classDef layer3 fill:#16A085,stroke:#2C3E50,color:#fff

    class percep layer1
    class net layer2
    class app layer3
%%{init: {'theme': 'base', 'themeVariables': {'primaryColor':'#2C3E50','primaryTextColor':'#fff','primaryBorderColor':'#16A085','lineColor':'#16A085','secondaryColor':'#E67E22','tertiaryColor':'#7F8C8D','noteBkgColor':'#FFF9C4','noteBorderColor':'#E67E22'}}}%%
sequenceDiagram
    participant Sensor as Perception Layer<br/>(Temperature Sensor)
    participant Gateway as Network Layer<br/>(IoT Gateway)
    participant Cloud as Application Layer<br/>(Cloud Platform)
    participant User as User Interface

    Note over Sensor,User: Typical IoT Data Flow Timeline

    Sensor->>Sensor: Sample temperature (25.3C)
    activate Sensor
    Sensor->>Gateway: Raw ADC value (0x3F2)
    deactivate Sensor
    Note right of Sensor: ~10ms

    activate Gateway
    Gateway->>Gateway: Convert to Celsius
    Gateway->>Gateway: Apply calibration
    Gateway->>Cloud: MQTT publish: temp=25.3C
    deactivate Gateway
    Note right of Gateway: ~100ms

    activate Cloud
    Cloud->>Cloud: Store in time-series DB
    Cloud->>Cloud: Check threshold rules
    Cloud-->>User: Update dashboard
    deactivate Cloud
    Note right of Cloud: ~500ms

    User->>Cloud: Request last 24h history
    Cloud->>User: Return temperature chart

    Note over Sensor,User: Total latency: ~600ms (typical)
{fig-alt=“Sequence diagram showing IoT data flow timeline through three layers: Perception Layer sensor samples temperature and sends raw ADC value to Gateway (10ms), Network Layer gateway converts and publishes via MQTT (100ms), Application Layer cloud stores data and updates dashboard (500ms), totaling approximately 600ms end-to-end latency”}
Perception Layer: Physical devices that sense and interact with the environment - Sensors, actuators, RFID tags, embedded controllers - Responsible for data acquisition and physical control - Constrained by power, memory, and processing capabilities
Network Layer: Communication infrastructure connecting devices to applications - Gateways, routers, protocol translators - Handles data transmission, protocol conversion, edge processing - Manages connectivity across different network technologies
Application Layer: Services and interfaces for users and systems - Cloud platforms, analytics engines, dashboards - Provides business logic, data storage, and user interaction - Supports high-level decision making and system management
1487.4.2 Five-Layer Architecture
A more detailed model adds middleware and business layers:
%% fig-alt: "Five-layer IoT architecture showing perception layer at bottom with sensors and RFID collecting data, network layer with Wi-Fi/Zigbee/LoRaWAN protocols, middleware layer processing data and managing devices, application layer with domain-specific apps for smart home and healthcare, and business layer at top with enterprise systems and business intelligence. Solid arrows show data flowing upward through sense, transport, process, and domain logic stages. Dashed arrows show control flowing downward through business rules, commands, control signals, and actions."
flowchart TB
    B["<b>Business Layer</b><br/>Enterprise Systems, BI, Decision Support"]
    A["<b>Application Layer</b><br/>Smart Home, Healthcare, Agriculture Apps"]
    M["<b>Middleware Layer</b><br/>Data Processing, Device Management, Service Orchestration"]
    N["<b>Network Layer</b><br/>Wi-Fi, Zigbee, LoRaWAN, MQTT, CoAP"]
    P["<b>Perception Layer</b><br/>Sensors, Actuators, RFID, Embedded Controllers"]

    P -->|"Sense & Actuate"| N
    N -->|"Transport & Route"| M
    M -->|"Process & Manage"| A
    A -->|"Domain Logic"| B

    B -.->|"Business Rules"| A
    A -.->|"Commands"| M
    M -.->|"Control"| N
    N -.->|"Actions"| P

    style B fill:#8E44AD,color:#fff
    style A fill:#16A085,color:#fff
    style M fill:#3498DB,color:#fff
    style N fill:#2C3E50,color:#fff
    style P fill:#E67E22,color:#fff
1487.4.3 Alternative View: Architecture Selection Decision Guide
This decision-oriented view helps system designers choose between three-layer and five-layer architectures based on project requirements. The choice depends on scale, integration needs, and organizational complexity rather than technical preferences alone.
%%{init: {'theme': 'base', 'themeVariables': { 'primaryColor': '#2C3E50', 'primaryTextColor': '#fff', 'primaryBorderColor': '#16A085', 'lineColor': '#16A085', 'secondaryColor': '#E67E22', 'tertiaryColor': '#7F8C8D', 'fontSize': '11px'}}}%%
flowchart TD
    START([IoT Architecture Decision]) --> Q1{Scale of<br/>deployment?}

    Q1 -->|"< 100 devices"| Q2{Enterprise<br/>integration?}
    Q1 -->|"> 100 devices"| FIVE["5-Layer Architecture<br/>Scalable, enterprise-ready"]

    Q2 -->|No| THREE["3-Layer Architecture<br/>Simple, rapid development"]
    Q2 -->|Yes| Q3{Multiple<br/>teams involved?}

    Q3 -->|No| THREE
    Q3 -->|Yes| FIVE

    THREE --> RESULT1["Best for:<br/>- Prototypes<br/>- Single-purpose systems<br/>- Small deployments<br/>- Startup MVPs"]

    FIVE --> RESULT2["Best for:<br/>- Enterprise IoT<br/>- Multi-vendor systems<br/>- Regulatory compliance<br/>- Complex integrations"]

    style START fill:#2C3E50,stroke:#16A085,color:#fff
    style THREE fill:#16A085,stroke:#2C3E50,color:#fff
    style FIVE fill:#E67E22,stroke:#2C3E50,color:#fff
    style RESULT1 fill:#E8F5E9,stroke:#16A085,color:#2C3E50
    style RESULT2 fill:#FFF3E0,stroke:#E67E22,color:#2C3E50
Business Layer: Enterprise systems, business intelligence, and decision support Application Layer: Domain-specific applications (smart home, healthcare, agriculture) Middleware Layer: Data processing, device management, service orchestration Network Layer: Communication protocols and network management Perception Layer: Physical devices and sensors
1487.4.4 IoT-A Reference Model
The IoT Architecture (IoT-A) reference model, developed by the European FP7 project, provides a comprehensive framework:
%% fig-alt: "IoT-A reference model diagram showing four primary architectural views arranged vertically: functional view defining services and processes, information view modeling data structures and information flow, deployment view showing hardware and software topology, and operational view managing system lifecycle. Below these views is a cross-cutting concerns layer containing security, privacy, trust, and management that applies to all views. Dashed arrows show relationships: functional view implements deployment, information view models functional view, operational view operates deployment, and cross-cutting layer applies to all views."
graph TB
    subgraph views["IoT-A Reference Model Views"]
        direction TB
        func["<b>Functional View</b><br/>Services, Processes,<br/>Capabilities"]
        info["<b>Information View</b><br/>Data Models,<br/>Information Flow"]
        deploy["<b>Deployment View</b><br/>Hardware, Software,<br/>Network Topology"]
        ops["<b>Operational View</b><br/>System Operation,<br/>Lifecycle Management"]
    end

    subgraph cross["Cross-Cutting Concerns"]
        direction LR
        sec["Security"]
        priv["Privacy"]
        trust["Trust"]
        mgmt["Management"]
    end

    func -.->|"Implements"| deploy
    info -.->|"Models"| func
    ops -.->|"Operates"| deploy

    cross -.->|"Applies to all views"| views

    style func fill:#16A085,color:#fff
    style info fill:#3498DB,color:#fff
    style deploy fill:#E67E22,color:#fff
    style ops fill:#2C3E50,color:#fff
    style cross fill:#E74C3C,color:#fff
Key aspects of IoT-A: - Functional View: What the system does (services, processes) - Information View: What information is managed - Deployment View: How components are deployed - Operational View: How the system operates - Cross-cutting concerns: Security, privacy, trust, management
1487.5 What’s Next
Continue to Design Facets & Calm Technology to learn about the 8 facets of IoT design and principles for ambient computing.