%% fig-alt: "Component comparison scorecard framework showing weighted scoring system. Requirements are listed with weights based on project priority. Each candidate component is scored 1-5 on each requirement. Total score is calculated as sum of weight times score for each requirement. Highest total score wins. Example shows power budget weighted 40%, accuracy weighted 30%, cost weighted 20%, interface weighted 10%. Helps make objective component selection decisions."
%%{init: {'theme': 'base', 'themeVariables': { 'primaryColor': '#2C3E50', 'primaryTextColor': '#fff', 'primaryBorderColor': '#16A085', 'lineColor': '#16A085', 'secondaryColor': '#E67E22', 'tertiaryColor': '#ECF0F1'}}}%%
flowchart LR
    subgraph Requirements["Weighted Requirements"]
        R1["Power Budget<br/>Weight: 40%"]
        R2["Accuracy<br/>Weight: 30%"]
        R3["Cost<br/>Weight: 20%"]
        R4["Interface<br/>Weight: 10%"]
    end

    subgraph Score["Candidate Scoring"]
        S1["Component A<br/>Power: 5, Acc: 4<br/>Cost: 3, Int: 4<br/>Total: 4.3"]
        S2["Component B<br/>Power: 3, Acc: 5<br/>Cost: 4, Int: 3<br/>Total: 3.9"]
    end

    Requirements --> Score
    S1 --> Winner["Best Fit:<br/>Component A"]

    style R1 fill:#2C3E50,stroke:#16A085,color:#fff
    style R2 fill:#16A085,stroke:#2C3E50,color:#fff
    style R3 fill:#E67E22,stroke:#2C3E50,color:#fff
    style R4 fill:#7F8C8D,stroke:#2C3E50,color:#fff
    style Winner fill:#27AE60,stroke:#2C3E50,color:#fff
1627 Specification Sheet Fundamentals
1627.1 Learning Objectives
By the end of this chapter, you will be able to:
- Define what a specification sheet is: Understand the purpose and importance of datasheets in component selection
- Navigate datasheet sections: Identify and locate key sections (electrical characteristics, timing diagrams, pinouts)
- Decode technical vocabulary: Interpret common abbreviations and terminology used in datasheets
- Understand specification types: Distinguish between typical, minimum, maximum, and absolute maximum values
1627.2 Prerequisites
Before diving into this chapter, you should be familiar with:
- Electronics Basics: Fundamental understanding of voltage, current, resistance, and power is essential for interpreting electrical specifications correctly
- Analog and Digital Electronics: Knowledge of signal types, ADC/DAC conversion, and logic levels helps you understand interface specifications and timing requirements
1627.3 Getting Started (For Beginners)
TipWhat is a Specification Sheet? (Simple Explanation)
Analogy: A datasheet is like a nutrition label for electronics.
Just like food labels tell you calories, ingredients, and serving size, datasheets tell you voltage, power consumption, and operating conditions!

NoteThe Five Most Important Things to Find
When you first open a datasheet, look for these five things:
| What to Find | Why It Matters | Example |
|---|---|---|
| Operating Voltage | Must match your power supply | 3.3V or 5V? |
| Current Draw | Will your battery last? | 20mA active, 1uA sleep |
| Pinout Diagram | How to wire it up | Which pin is power? |
| Communication Interface | How it talks to your MCU | I2C? SPI? UART? |
| Accuracy/Range | Does it meet your needs? | +/-0.5C, -40 to 125C |

NoteAlternative View: Component Comparison Scorecard
This view shows a systematic approach to comparing multiple components:
Weight your requirements by project priority, then score each candidate systematically.
1627.4 Key Vocabulary Decoder
CautionDatasheet Abbreviations Explained
Datasheets use technical abbreviations. Here’s your cheat sheet:
| Term | Meaning | Plain English |
|---|---|---|
| Vcc / Vdd | Supply voltage | The power it needs |
| GND / Vss | Ground | The 0V reference |
| Icc / Idd | Supply current | How much current it uses |
| Typ | Typical value | What you’ll usually see |
| Min / Max | Limits | Never go below/above this |
| Abs Max | Absolute maximum | Exceed this = damage! |
| NC | No connection | This pin does nothing |
Warning Pattern:

TipReal Example: Checking a Temperature Sensor
You’re choosing between two temperature sensors. Here’s how to compare:
| Specification | Sensor A | Sensor B | Your Need |
|---|---|---|---|
| Voltage | 3.3V | 5V | 3.3V |
| Current | 200uA | 50mA | Low power |
| Accuracy | +/-0.5C | +/-2C | +/-1C |
| Range | -40 to 125C | 0 to 50C | Outdoor |
| Interface | I2C | Analog | Have ADC… |
Winner: Sensor A - Matches voltage, lower power, better accuracy, wider range!
NoteSelf-Check Questions
Before diving deeper, test your understanding:
- What does “Vcc: 3.0V - 3.6V” mean?
- Hint: It’s a range, not one number
- If a sensor draws 20mA and you have a 2000mAh battery, how long will it last?
- Hint: Simple division… if running continuously
- What’s the difference between “Max” and “Abs Max”?
- Hint: One is recommended limit, one is “you’ll break it”
Answers explored in the chapter below!
1627.5 Introduction
NoteCross-Hub Connections
This chapter connects to multiple learning resources across the IoT textbook:
Learning Hubs:
- Simulations Hub - Interactive circuit simulators to test component specifications before purchase
- Knowledge Gaps Hub - Common misconceptions about datasheet interpretation and component selection
- Videos Hub - Practical demonstrations of reading real datasheets
Related Content:
- Sensor Fundamentals - Deep dive into sensor parameters (accuracy, resolution, range)
- Electronics Basics - Electrical fundamentals needed to interpret voltage/current specifications
- Hardware Prototyping - Applying datasheet knowledge to select components for projects
- Energy Management - Power budget calculations using datasheet current specifications
Specification Sheet (Datasheet): A technical document provided by manufacturers that details the characteristics, capabilities, and operating parameters of a component or sensor.
Understanding how to read and interpret specification sheets is a critical skill for IoT developers:
- Component Selection: Choose the right sensor for your application requirements
- Circuit Design: Design proper supporting circuitry (power, signal conditioning)
- Performance Prediction: Estimate accuracy, power consumption, and behavior
- Troubleshooting: Diagnose problems by comparing actual vs specified performance
- Cost Optimization: Balance performance requirements with component costs

1627.6 Anatomy of a Specification Sheet

1627.6.1 Standard Datasheet Sections
Most datasheets follow a similar organization:
| Section | What You’ll Find | When to Use It |
|---|---|---|
| Overview/Features | Product description, key highlights | Initial screening |
| Electrical Characteristics | Voltage, current, power specs | Circuit design |
| Performance Specifications | Range, accuracy, resolution | Application fit |
| Pin Configuration | Pinout diagrams, pin functions | PCB layout |
| Timing Diagrams | Signal timing, startup sequences | Interface design |
| Application Circuits | Reference designs, component values | Implementation |
| Mechanical | Package dimensions, footprint | PCB design |
| Ordering Information | Part numbers, variants | Purchasing |
1627.7 Knowledge Check
Test your understanding of datasheet fundamentals.
1627.8 Summary
Key Takeaways:
Datasheets are essential - They are the definitive source of truth for component behavior and requirements
Five critical items to find first:
- Operating voltage range
- Current consumption (active and sleep)
- Pinout diagram
- Communication interface
- Accuracy and measurement range
Understand specification types:
- Typical: Expected average performance (not guaranteed)
- Min/Max: Guaranteed operating limits
- Absolute Maximum: Damage threshold (never exceed)
Standard sections help you navigate any datasheet - learn the common organization
Always design for worst-case (Max specs), not typical values
1627.9 What’s Next
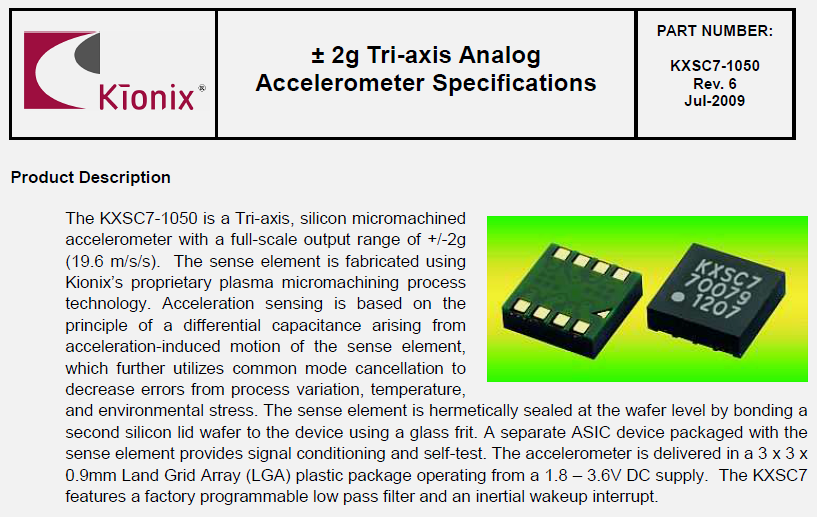
Now that you understand the fundamentals of specification sheets, continue to Accelerometer Case Study for a detailed walkthrough of reading a real-world sensor datasheet. This practical example will reinforce the concepts covered here with specific parameter interpretation and calculations.
Related Chapters:
- Accelerometer Case Study - Detailed datasheet analysis example
- Sensor Selection Process - Component comparison and selection
- Automotive Applications - Industry-specific requirements