%%{init: {'theme': 'base', 'themeVariables': { 'primaryColor': '#2C3E50', 'primaryTextColor': '#fff', 'primaryBorderColor': '#16A085', 'lineColor': '#16A085', 'secondaryColor': '#E67E22', 'tertiaryColor': '#fff', 'fontSize': '16px'}}}%%
flowchart LR
    A[Problem] --> B{Understand User}
    B --> C[Research]
    C --> D[Brainstorm Solutions]
    D --> E[Quick Prototype]
    E --> F{Test with Users}
    F -->|Learn| B
    F -->|Success| G[Build Real Product]

    style A fill:#E67E22,stroke:#2C3E50,color:#fff
    style G fill:#16A085,stroke:#2C3E50,color:#fff
1637 Design Thinking Introduction
1637.1 Learning Objectives
By the end of this chapter, you will be able to:
- Understand Design Thinking Methodology: Explain the seven-phase design thinking process and why it matters for IoT product development
- Apply the Problem Statement Formula: Use the “[User] needs [need] because [insight]” framework to define user-centered problems
- Recognize Common IoT Product Failures: Identify why building without user research leads to product failure
- Adopt a Prototyping Mindset: Understand why cheap, fast prototypes validate ideas before expensive development
1637.2 Prerequisites
Before diving into this chapter, you should be familiar with:
- IoT Applications and Use Cases: Understanding diverse IoT application domains provides context for empathizing with users and identifying real-world problems worth solving
- IoT Reference Models: Knowledge of IoT system architectures helps during the ideation phase when proposing technical solutions
- Human-Computer Interaction Basics: Understanding user experience principles informs the empathize and test stages
NoteKey Takeaway
In one sentence: Spend 35% of your time understanding users before building anything - the #1 reason IoT products fail is building something nobody wants.
Remember this rule: Talk to 5 real users before writing any code. If you can’t find 5 people who want your solution, you don’t have a product - you have a hobby project.
1637.3 Getting Started (For Beginners)
TipWhat is Design Thinking? (Simple Explanation)
Analogy: Design thinking is like being a detective solving a mystery before building a solution.
Instead of jumping straight to “let’s build a smart thermostat!”, you first ask: - Who has a problem? (the user) - What’s really bothering them? (the pain point) - What have others tried? (existing solutions) - How can we test our ideas cheaply? (prototypes)
NoteAlternative View: Design Thinking Stages with Time Investment
This timeline variant shows the recommended time allocation for each design thinking phase, helping teams budget appropriately for user research versus building.
%%{init: {'theme': 'base', 'themeVariables': { 'primaryColor': '#2C3E50', 'primaryTextColor': '#fff', 'primaryBorderColor': '#16A085', 'lineColor': '#16A085', 'secondaryColor': '#E67E22', 'tertiaryColor': '#ECF0F1', 'fontSize': '11px'}}}%%
flowchart LR
    subgraph E["EMPATHIZE (20%)"]
        E1["User interviews<br/>Observation<br/>2 weeks"]
    end

    subgraph D["DEFINE (15%)"]
        D1["Problem statement<br/>Personas<br/>1.5 weeks"]
    end

    subgraph I["IDEATE (10%)"]
        I1["Brainstorming<br/>Sketching<br/>1 week"]
    end

    subgraph P["PROTOTYPE (25%)"]
        P1["Paper → Lo-fi → Hi-fi<br/>Iterative builds<br/>2.5 weeks"]
    end

    subgraph T["TEST (30%)"]
        T1["User testing<br/>Iteration cycles<br/>3 weeks"]
    end

    E --> D --> I --> P --> T
    T -.->|"Insights"| E

    style E fill:#16A085,stroke:#2C3E50
    style D fill:#16A085,stroke:#2C3E50
    style I fill:#E67E22,stroke:#2C3E50
    style P fill:#2C3E50,stroke:#16A085
    style T fill:#2C3E50,stroke:#16A085
TipFor Kids: Meet the Sensor Squad!
Design Thinking is like being a detective and an inventor at the same time - first you figure out what problem to solve, then you create something amazing to solve it!
1637.3.1 The Sensor Squad Adventure: The Playground Problem Solvers
One day, the Sensor Squad received an unusual mission from their friend Emma: “My school playground has a problem, but I’m not sure exactly what it is. Can you help?”
“We could start building something right away!” suggested an eager young robot nearby. But Sammy the Temperature Sensor had a better idea. “Wait! Before we build anything, we need to understand the problem first. Let’s be detectives!”
The Sensor Squad went to Emma’s school playground and started watching and asking questions - this is called “Empathizing.” Lux the Light Sensor noticed that kids avoided the swings on sunny afternoons. “Interesting! I sense the metal swing chains get super hot in the sun - too hot to hold!” Motio the Motion Detector observed that kids stopped playing by 2 PM even though recess wasn’t over. “I’m detecting a pattern - everyone goes to the shady area when the sun gets intense!”
“Now we understand the REAL problem,” announced Pressi the Pressure Sensor. “It’s not that the playground is boring - it’s that it gets too hot to use in the afternoon!” The Squad wrote this down as their Problem Statement: “Kids need a way to play comfortably in the afternoon because the playground equipment gets too hot in the sun.”
Now came the fun part: brainstorming solutions! The team drew wild ideas on paper: A giant robot umbrella? Spray-on cooling paint? A sensor that warns kids when equipment is too hot? “Let’s not pick just one idea yet,” said Sammy wisely. “Let’s test our favorites quickly and cheaply!”
They built three quick prototypes: (1) Cardboard shade structures held up with sticks, (2) A simple thermometer flag that shows red when things are too hot, and (3) A sign pointing to cool equipment. They tested each one with real kids during recess!
The winning idea? A combination! Kids loved the temperature flags (powered by sensors like Sammy!) AND the simple shade structures. Emma’s school built real versions, and now kids can play all afternoon. The Sensor Squad learned that the best inventions come from understanding people first!
1637.3.2 Key Words for Kids
| Word | What It Means |
|---|---|
| Empathize | Understanding how other people feel and what problems they have - like putting yourself in someone else’s shoes |
| Problem Statement | A clear sentence that explains exactly what problem you’re trying to solve and who has that problem |
| Brainstorm | Coming up with as many ideas as possible without judging them - even silly ideas might lead to great solutions! |
| Prototype | A quick, simple version of your idea that you build just to test if it works - made from paper, cardboard, or anything handy |
1637.3.3 Try This at Home!
Be a Design Thinker Detective
Pick a “problem” in your house or school and use Design Thinking to solve it:
Empathize (10 min): Watch and ask questions. Example: “I notice Mom always loses her keys.” Ask her: “When do you usually lose them? How does it make you feel?”
Define (5 min): Write a problem statement: “[Person] needs [what they need] because [the reason].” Example: “Mom needs a way to always find her keys because she’s rushing in the morning and forgets where she put them.”
Brainstorm (10 min): Draw at least 5 different solutions - no judging! A key-finding robot? A special hook? A beeping keychain? Keys that glow in the dark?
Prototype (15 min): Pick your best idea and make a super simple version. Use paper, cardboard, LEGO, or whatever you have!
Test (10 min): Let the person try your prototype. Ask them what they like and what could be better.
This is exactly what professional inventors and engineers do! The secret is to spend MORE time understanding the problem than building the solution. Many inventions fail because people built something cool that nobody actually needed!
NoteWhy Engineers Need Design Thinking
The #1 reason IoT products fail: Building something nobody wants.
| Without Design Thinking | With Design Thinking |
|---|---|
| “Let’s add Bluetooth!” | “Do users need Bluetooth?” |
| “More features = better” | “What’s the one thing they need?” |
| “I think users want…” | “Let me ask users what they want” |
| “We’ll test when it’s done” | “Let’s test with paper prototypes” |
Real Example: Smart Water Bottle
%%{init: {'theme': 'base', 'themeVariables': { 'primaryColor': '#E67E22', 'primaryTextColor': '#fff', 'primaryBorderColor': '#2C3E50', 'lineColor': '#E67E22', 'secondaryColor': '#E67E22', 'tertiaryColor': '#fff'}}}%%
flowchart TD
    A[Idea: Smart Water Bottle] --> B[Build Everything]
    B --> C[Add Bluetooth]
    C --> D[Add App]
    D --> E[Add LED Display]
    E --> F[Add Temperature Sensor]
    F --> G[Launch]
    G --> H[Nobody Buys It]

    style H fill:#E67E22,stroke:#2C3E50,color:#fff
%%{init: {'theme': 'base', 'themeVariables': { 'primaryColor': '#16A085', 'primaryTextColor': '#fff', 'primaryBorderColor': '#2C3E50', 'lineColor': '#16A085', 'secondaryColor': '#16A085', 'tertiaryColor': '#fff'}}}%%
flowchart TD
    A[Talk to Users] --> B{Do they forget<br/>to drink?}
    B -->|Yes| C[Paper Prototype:<br/>Glowing Reminder]
    B -->|No| A
    C --> D[Test with 5 People]
    D --> E{Does it help?}
    E -->|Yes| F[Build Simple Version]
    E -->|No| A
    F --> G[Real Users Love It!]

    style G fill:#16A085,stroke:#2C3E50,color:#fff
CautionThe Problem Statement Formula
A good problem statement follows this pattern:
[User] needs [need] because [insight].
| Component | Bad Example | Good Example |
|---|---|---|
| User | “People” | “Office workers aged 25-45” |
| Need | “A smart device” | “A way to remember to drink water” |
| Insight | “They’re lazy” | “They lose track of time in meetings” |
Complete Examples: - Bad: “People need a smart water bottle.” - Good: “Office workers need reminders to hydrate because back-to-back meetings make them forget.”
%%{init: {'theme': 'base', 'themeVariables': { 'primaryColor': '#2C3E50', 'primaryTextColor': '#fff', 'primaryBorderColor': '#16A085', 'lineColor': '#16A085', 'secondaryColor': '#E67E22', 'tertiaryColor': '#fff'}}}%%
flowchart LR
    A[Vague Problem] --> B[Add User Specificity]
    B --> C[Add Context/Insight]
    C --> D[Specific Problem Statement]

    A2["People need<br/>a device"] -.->|Bad| A
    D2["Office workers aged 25-45<br/>need hydration reminders<br/>because meetings make<br/>them forget"] -.->|Good| D

    style A fill:#E67E22,stroke:#2C3E50,color:#fff
    style D fill:#16A085,stroke:#2C3E50,color:#fff
From Vague to Specific: Good problem statements shift from technology-focused generalities to user-focused specifics that identify who, what, and why.
TipQuick Prototyping Mindset
You don’t need working electronics to test an idea!
| Prototype Level | Time | Cost | What You Learn |
|---|---|---|---|
| Paper sketch | 10 min | $0 | Does the concept make sense? |
| Cardboard mockup | 1 hour | $5 | Is the size/shape right? |
| 3D print + LEDs | 1 day | $20 | Does it look professional? |
| Working prototype | 1 week | $100+ | Does the technology work? |
Rule: Don’t build expensive prototypes until cheap ones validate the idea!
NoteSelf-Check Questions
Before diving deeper, test your understanding:
- Why should you interview users before building an IoT device?
- Hint: What if you build something nobody wants?
- What are the five stages of design thinking?
- Hint: E-D-I-P-T
- Why start with paper prototypes instead of working electronics?
- Hint: Time and cost…
Answers explored in the chapter below!
1637.3.4 Design Thinking Visualizations
The following AI-generated diagrams illustrate key design thinking concepts and methodologies for IoT product development.


1637.4 Introduction to Design Thinking for IoT
Design thinking is a human-centered, iterative approach to problem-solving that emphasizes understanding user needs, challenging assumptions, and rapidly prototyping solutions. Applied to IoT development, design thinking helps create products that solve real problems rather than implementing technology for its own sake.
TipMVU: User-Centered IoT Design
Core Concept: Spend 35% of project time understanding users before building - use the formula “[User] needs [need] because [insight]” to define problems worth solving. Why It Matters: The #1 reason IoT products fail is building something nobody wants; hardware mistakes are expensive to fix post-launch, making early user validation critical. Key Takeaway: Talk to 5 real users before writing any code - if you cannot find 5 people who want your solution, you have a hobby project, not a product.
TipDefinition
Design thinking for IoT is a structured, user-centered methodology for developing Internet of Things solutions that combines empathy for users, creative ideation, rapid prototyping, and iterative testing to create meaningful, functional, and desirable products.
1637.4.1 Why Design Thinking Matters for IoT
User-Centered Focus: Technology serves users, not the reverse. Design thinking keeps user needs central throughout development.
Problem Definition: Many IoT projects fail because they solve the wrong problem. Design thinking ensures deep problem understanding before solutions.
Iteration Over Perfection: Rapid prototyping and testing prevents investing heavily in flawed concepts.
Cross-Disciplinary Collaboration: IoT requires hardware, software, networking, and UX expertise—design thinking facilitates team collaboration.
Risk Reduction: Validating assumptions early through prototypes reduces expensive late-stage failures.
WarningCommon Misconception: “We Can Skip User Research—We Know What Users Want”
The Myth: “Our team has IoT expertise, we’ve built products before, and we understand the problem space. User research will just slow us down—let’s start building!”
The Reality: This assumption causes 42% of IoT product failures according to CB Insights’ analysis of 101 startup autopsies. The top failure reason: “No market need” (making products users don’t want).
Quantified Real-World Example:
A smart home startup in 2019 skipped user research and built a $2.3M smart mirror with features the team thought were “obvious needs”: - Weather forecast display - Calendar integration - News headlines - Fitness tracking
What happened: - Manufacturing: 5,000 units produced at $460/unit - Sales after 12 months: 347 units (7% of inventory) - Customer returns: 28% (high even among purchasers) - Company outcome: Shutdown after 18 months, $2.1M loss
What user research would have revealed (discovered through post-mortem interviews): - Primary user concern: Mirror fogging from shower steam (87% of users) - Desired feature #1: Quick morning routine (3-minute bathroom visits) - Actual usage pattern: Users checked phones BEFORE looking at mirror (94%) - Key insight: Users didn’t want another screen—they wanted a better MIRROR with minimal distractions
The correct solution (validated by competitor who DID user research): - Simple mirror with voice control (hands-free while brushing teeth) - ONE data point: Current time and weather icon (not full forecast) - Optional: Toothbrush timer and lighting adjustments - Price: $179 vs $460 - Result: 15,000+ units sold in first year
Why this happens: Engineers and designers create mental models based on their own needs, not actual user contexts. The smart mirror team consisted of tech enthusiasts who loved data dashboards—but their target users (busy families) had completely different morning routines.
The Fix: Spend 2-5% of project budget on user research (interviews, observations, prototypes). For the smart mirror example, 10 user interviews ($3,000) would have saved $2.1M in losses. ROI: 70,000%.
Validation checkpoint: If you can’t name 3 specific users you’ve interviewed and quote their exact pain points, you’re building assumptions, not solutions.
NoteCross-Hub Connections: Design Thinking Resources
Interactive Tools & Simulations: - Simulations Hub - Network Topology Visualizer (Exercise 2: test mesh vs star topologies) - Simulations Hub - IoT Protocol Comparison Tool (Exercise 3: evaluate LoRaWAN vs Zigbee for parking sensors)
Knowledge Assessment: - Quiz Hub - Design Strategies section: Test understanding of prototyping fidelity levels, timeline estimation, and risk mitigation - Knowledge Gaps Hub - “Requirements vs Specifications” - Common confusion addressed with examples
Video Tutorials: - Videos Hub - Design Thinking section: - “IDEO Design Thinking Process” (16 min) - Real-world shopping cart redesign demonstration - “IoT User Journey Mapping” (12 min) - Step-by-step empathy mapping and persona creation - “Hardware Prototyping Workflow” (8 min) - Breadboard to PCB to Production timeline
Application Examples: Try applying design thinking to real scenarios: 1. Smart Medication Reminder (Exercise 1 in this chapter) - Then check Knowledge Gaps Hub “Why Simple Solutions Work” 2. Construction Wearable (Exercise 2) - Cross-reference with Simulations Hub Power Budget Calculator 3. Smart Parking (Exercise 3) - Validate protocol selection with Protocol Comparison Tool
Self-Check Pathway: 1. Complete Understanding Checks in this chapter 2. Test knowledge with Quiz Hub Design Strategies questions 3. Identify gaps with Knowledge Gaps Hub Design section 4. Practice with Simulations Hub interactive tools
1637.5 The Design Thinking Process
1637.5.1 Seven-Phase Framework for IoT
Design thinking for IoT extends the traditional five-stage process with two critical phases that address the unique challenges of bringing physical, connected products to market.
1. Empathize: Understanding users and their context through observation and engagement.
2. Define: Synthesizing research into clear problem statements using “How Might We” frameworks.
3. Ideate: Generating diverse potential solutions through creative techniques like brainstorming, Crazy 8s, and mind mapping.
4. Prototype: Building quick, cheap representations—paper prototypes for interfaces, breadboard circuits for hardware, Wizard of Oz for complex behaviors.
5. Test: Gathering real user feedback through think-aloud protocols, A/B testing, and usability metrics.
6. Implement: Building the real product using MVP (Minimum Viable Product) approach with iterative development.
7. Iterate: Continuous improvement through analytics, monitoring, and user feedback loops.
Note: This process is non-linear; insights from later stages often require revisiting earlier ones. IoT products typically iterate 3-5 times through the prototype-test-implement cycle before achieving product-market fit.
%%{init: {'theme': 'base', 'themeVariables': { 'primaryColor': '#2C3E50', 'primaryTextColor': '#fff', 'primaryBorderColor': '#16A085', 'lineColor': '#16A085', 'secondaryColor': '#E67E22', 'tertiaryColor': '#fff', 'fontSize': '15px'}}}%%
flowchart TD
    Start([IoT Product Idea]) --> Empathize

    Empathize[1. EMPATHIZE<br/>User interviews<br/>Observations<br/>Empathy maps] --> Define
    Define[2. DEFINE<br/>Problem statement<br/>POV framework<br/>HMW questions] --> Ideate
    Ideate[3. IDEATE<br/>Brainstorming<br/>Crazy 8s<br/>Mind mapping] --> Prototype
    Prototype[4. PROTOTYPE<br/>Paper mockups<br/>Breadboard circuits<br/>Wizard of Oz] --> Test
    Test[5. TEST<br/>Think-aloud protocol<br/>A/B testing<br/>Usability metrics] --> Decision{Validated?}

    Decision -->|No - Major pivot| Empathize
    Decision -->|No - Minor changes| Prototype
    Decision -->|Yes| Implement

    Implement[6. IMPLEMENT<br/>MVP approach<br/>Iterative dev<br/>Production build] --> Monitor{Monitor<br/>Performance}

    Monitor -->|Issues found| Test
    Monitor -->|New insights| Define
    Monitor -->|Ready| Iterate

    Iterate[7. ITERATE<br/>Analytics review<br/>User feedback<br/>Continuous improvement] --> Next{Next<br/>Version?}

    Next -->|New features| Ideate
    Next -->|Refinement| Prototype
    Next -->|Stable| Maintain([Market Product])

    Test -.->|New insights| Define
    Prototype -.->|Technical blockers| Ideate

    style Start fill:#16A085,stroke:#2C3E50,color:#fff
    style Maintain fill:#16A085,stroke:#2C3E50,color:#fff
    style Empathize fill:#2C3E50,stroke:#16A085,color:#fff
    style Define fill:#2C3E50,stroke:#16A085,color:#fff
    style Ideate fill:#2C3E50,stroke:#16A085,color:#fff
    style Prototype fill:#2C3E50,stroke:#16A085,color:#fff
    style Test fill:#2C3E50,stroke:#16A085,color:#fff
    style Implement fill:#2C3E50,stroke:#16A085,color:#fff
    style Iterate fill:#2C3E50,stroke:#16A085,color:#fff
    style Decision fill:#E67E22,stroke:#2C3E50,color:#fff
    style Monitor fill:#E67E22,stroke:#2C3E50,color:#fff
    style Next fill:#E67E22,stroke:#2C3E50,color:#fff
NoteVariant View: Design Thinking as Time Investment
This timeline variant shows how design thinking phases translate to actual time and resource allocation in a typical IoT product development cycle, helping teams plan realistic schedules.
%% fig-cap: "Design Thinking Time Investment by Phase"
%% fig-alt: "Gantt-style timeline showing typical time investment across design thinking phases for IoT products: Empathize takes 2-3 weeks of research, Define takes 1 week for synthesis, Ideate takes 1-2 weeks for brainstorming, Prototype iterations span 4-8 weeks with multiple cycles, Test phases occur between prototype cycles adding 2-3 weeks each, Implement takes 8-12 weeks for production, and Iterate continues indefinitely post-launch."

%%{init: {'theme': 'base', 'themeVariables': { 'primaryColor': '#2C3E50', 'primaryTextColor': '#fff', 'primaryBorderColor': '#16A085', 'lineColor': '#16A085', 'secondaryColor': '#E67E22', 'tertiaryColor': '#ecf0f1', 'noteTextColor': '#2C3E50', 'noteBkgColor': '#fff3cd', 'textColor': '#2C3E50', 'fontSize': '16px'}}}%%

gantt
    title IoT Design Thinking Timeline (Typical 6-Month Project)
    dateFormat YYYY-MM-DD
    section Research
    Empathize - User Research      :emp, 2026-01-01, 21d
    Define - Problem Synthesis     :def, after emp, 7d
    section Exploration
    Ideate - Brainstorm Solutions  :idea, after def, 14d
    Prototype v1 - Paper/Lo-Fi     :p1, after idea, 14d
    Test v1 - User Feedback        :t1, after p1, 7d
    section Refinement
    Prototype v2 - Functional      :p2, after t1, 21d
    Test v2 - Usability Testing    :t2, after p2, 7d
    Prototype v3 - Production      :p3, after t2, 21d
    section Launch
    Implement - Manufacturing      :imp, after p3, 42d
    section Post-Launch
    Iterate - Continuous Updates   :iter, after imp, 30d
Seven-Phase Design Thinking Process: The seven phases form an iterative cycle, not a linear sequence. Solid arrows show the typical forward flow, while dotted arrows represent common backward loops when validation fails or new insights emerge. The final two phases (Implement and Iterate) distinguish IoT design from pure software development, addressing manufacturing, deployment, and continuous improvement in the field.
1637.6 Hands-On Exercises
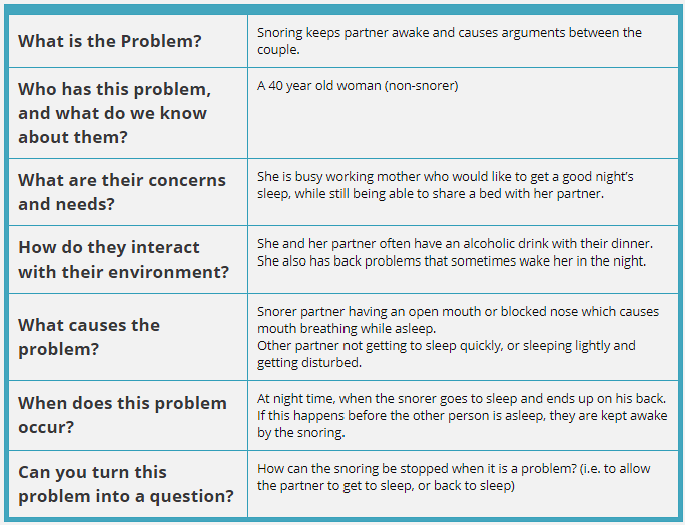
TipExercise 1: Empathize and Define - Smart Medication Reminder for Elderly
Objective: Practice the Empathize and Define stages of design thinking by conducting user interviews and creating problem statements for a real-world IoT challenge.
Prerequisites: Access to interview subjects (family members, friends, or online forums for caregivers)
Scenario: You want to create an IoT device to help elderly people remember to take medications. But first, you need to understand the real problem!
Steps:
- Empathize - User Interviews (30 minutes):
- Interview 2-3 people who are elderly OR care for elderly relatives
- Ask open-ended questions:
- “Walk me through your medication routine…”
- “What frustrates you about taking/managing medications?”
- “Tell me about a time you forgot to take medication…”
- “How do you currently remember to take pills?”
- Take detailed notes on what they SAY, DO, THINK, and FEEL
- Create Empathy Map (20 minutes):
- Organize your notes into 4 quadrants:
- SAYS: Direct quotes from interviews
- DOES: Observable behaviors (e.g., “keeps pill bottles on kitchen counter”)
- THINKS: Inferred thoughts (e.g., “worried about missing doses”)
- FEELS: Emotions (e.g., “frustrated with complex schedules”)
- Identify patterns and key insights
- Organize your notes into 4 quadrants:
- Define Problem Statement (20 minutes):
- Use the formula: [User] needs [need] because [insight]
- Write 3-5 different problem statements
- Example bad: “Elderly people need a smart pill dispenser”
- Example good: “Elderly people living alone need a non-intrusive way to be reminded about medications because they fear seeming incompetent if family constantly checks on them”
- Identify Pain Points (15 minutes):
- Categorize pain points:
- Functional: “Bottles are hard to open”
- Emotional: “Embarrassed about forgetting”
- Social: “Don’t want to burden children”
- Financial: “Expensive automatic dispensers”
- Categorize pain points:
Expected Outcome: - Detailed empathy map with real user insights - 3-5 clear, user-centered problem statements - List of prioritized pain points - Understanding that the problem is NOT “they need technology” but deeper human needs
Challenge Extension: - Create a persona based on your interviews (name, age, daily routine, goals, frustrations) - Map the user journey from “waking up” to “bedtime” identifying pain points at each stage - Interview someone from a different age group - how do their needs differ?
Success Criteria: - Problem statements focus on USER not technology - Empathy map reveals emotional needs, not just functional - You’re surprised by something users said (means you learned!) - Problem statements guide solutions without prescribing specific technology
Why This Matters: Most IoT products fail because they solve problems users don’t have. Empathy prevents this!
TipExercise 2: Ideate and Prototype - Rapid Paper Prototyping Workshop
Objective: Learn to generate many ideas quickly using ideation techniques, then validate with low-fidelity prototypes before writing any code or buying hardware.
Prerequisites: Paper, markers, scissors, cardboard, Post-it notes
Scenario: Design a wearable IoT device for construction workers to detect dangerous air quality (carbon monoxide, dust).
Steps:
- Ideation - Generate 20 Ideas (30 minutes):
- Set timer for 10 minutes: Brainstorm alone (no judging!)
- Write every idea on Post-it note, aim for 10+ ideas
- Ideas can be wild: “Helmet with lights”, “Smart gloves”, “Drone that follows worker”
- Set timer for 10 minutes: Pair with partner, generate 10 MORE ideas combining/building on each other
- Apply SCAMPER technique:
- Substitute: What if sensor was on belt instead of wrist?
- Combine: Merge with existing safety equipment?
- Adapt: Borrow from medical monitors?
- Modify: Make smaller? Larger?
- Put to other use: Can it detect other hazards?
- Eliminate: Remove the display?
- Reverse: What if it detects GOOD air quality?
- Prioritize with 2x2 Matrix (15 minutes):
- Draw Impact vs Effort matrix
- Place each idea in a quadrant:
- High Impact + Low Effort = Quick Win (do first!)
- High Impact + High Effort = Major Project (plan carefully)
- Low Impact + Low Effort = Fill-In (if time allows)
- Low Impact + High Effort = Time Sink (avoid!)
- Select top 3 ideas from “Quick Win” quadrant
- Paper Prototype - Level 1 (20 minutes):
- For your top idea, create paper prototype:
- Cut cardboard to shape (wearable location)
- Draw “screen” with current air quality
- Add buttons/controls with paper
- Create “app interface” on phone-sized paper
- No functionality needed - just appearance and layout
- For your top idea, create paper prototype:
- User Test (20 minutes):
- Find someone unfamiliar with your idea
- Show them the prototype (don’t explain!)
- Ask: “What do you think this does?”
- Ask: “How would you check air quality?”
- Ask: “What’s confusing? What would you change?”
- Take notes on their feedback
- Iterate (15 minutes):
- Based on feedback, improve prototype
- Common insights:
- “I didn’t see the button” - Make bigger
- “I thought it was a watch” - Change location
- “Too many options” - Simplify interface
Expected Outcome: - 20+ ideas generated (quantity over quality initially) - Clear prioritization using Impact/Effort matrix - Physical prototype you can hold and test - Real user feedback before spending $100 on hardware - List of improvements for next iteration
Challenge Extension: - Create 3 different fidelity levels: - Level 1: Paper sketch (5 minutes) - Level 2: Cardboard + colored mockup (20 minutes) - Level 3: 3D-printed shell + LED lights (if available) - Test with 5 different users - identify patterns in feedback - Create a “Wizard of Oz” prototype: You manually change the display while user “interacts” with device
Success Criteria: - Generated 20+ ideas (proves divergent thinking) - Prototype built in under 30 minutes (proves low-fidelity approach) - Received feedback that changed your design (proves testing value) - Can explain why paper prototyping saved time/money
Real-World Parallel: Companies like IDEO and frog design use exactly this process for million-dollar projects. You just learned their secret!
TipExercise 3: Plan and Timeline a Complete IoT Project
Objective: Learn realistic project planning by creating a detailed timeline, budget, and risk assessment for an IoT product from concept to production.
Prerequisites: Spreadsheet software (Excel, Google Sheets) or project management tool (Trello, Asana)
Scenario: You’ve been hired to develop a smart parking sensor for a city parking lot. 100 spaces, each needs a sensor to detect car presence, send data to cloud, and update a mobile app showing available spaces.
Steps:
- Define Requirements (20 minutes):
- Functional:
- Detect car presence (ultrasonic or magnetic sensor)
- Send status every 30 seconds via LoRaWAN
- Battery life: 3 years minimum
- Weather-resistant (outdoor installation)
- Non-Functional:
- 99% accuracy (false positives/negatives < 1%)
- Latency < 5 seconds from car arrival to app update
- Unit cost < $50 (for profitability)
- Constraints:
- Cannot use mains power (no outlets in lot)
- Cannot modify pavement (must be surface-mounted)
- Functional:
- Break Down Phases (30 minutes):
- Create timeline using chapter’s framework:
- Phase 1: Discovery (2 weeks)
- Research existing solutions
- Test sensor technologies
- Select LoRaWAN gateway
- Phase 2: Proof of Concept (2 weeks)
- Single sensor + Arduino + LoRa module
- Validate detection accuracy
- Phase 3: Functional Prototype (4 weeks)
- Custom PCB design
- Power optimization (deep sleep)
- Cloud backend (AWS IoT or similar)
- Phase 4: Engineering Prototype (6 weeks)
- 10-unit pilot deployment
- Mobile app development
- Field testing and refinement
- Phase 5: Production (8 weeks)
- 100-unit manufacturing
- Installation
- User acceptance testing
- Phase 1: Discovery (2 weeks)
- Total: 22 weeks (5.5 months)
- Create timeline using chapter’s framework:
- Create Budget (30 minutes):
- Hardware Prototyping:
- Development boards: $500
- PCB fabrication (5 iterations): $2,000
- Sensors and components: $1,500
- Enclosures: $1,000
- Total: $5,000
- Software Development:
- Firmware developer (3 months): $30,000
- Backend developer (2 months): $20,000
- Mobile app developer (2 months): $20,000
- Total: $70,000
- Cloud Services:
- AWS IoT Core: $500/month x 6 months = $3,000
- Production Units:
- 100 sensors x $50 = $5,000
- Certifications:
- FCC/CE testing: $10,000
- TOTAL PROJECT: $93,000
- Hardware Prototyping:
- Risk Assessment (30 minutes):
- Identify risks and mitigation:
- Risk 1: LoRaWAN coverage insufficient
- Mitigation: Pre-deployment site survey, add gateways if needed
- Risk 2: Battery life shorter than 3 years
- Mitigation: Early power testing, optimize duty cycle
- Risk 3: Sensor inaccuracy in rain/snow
- Mitigation: Test in weather chamber, add sensor fusion
- Risk 4: Component shortage (supply chain)
- Mitigation: Qualify 2+ suppliers for critical parts
- Risk 5: Vandalism/theft of sensors
- Mitigation: Tamper detection, secure mounting
- Risk 1: LoRaWAN coverage insufficient
- Identify risks and mitigation:
- Create Gantt Chart (20 minutes):
- Use spreadsheet or project tool
- Show parallel tasks (firmware + backend development)
- Identify critical path (longest dependency chain)
- Add 25% buffer to timeline (realistic for first IoT project)
Expected Outcome: - Complete project plan with phases, tasks, and milestones - Realistic budget broken down by category - Risk register with mitigation strategies - Visual timeline (Gantt chart or similar) - Understanding that IoT projects take months, not weeks!
Challenge Extension: - Add “Team” section: Who do you need to hire? (hardware engineer, firmware dev, etc.) - Create “Decision Log”: Document key decisions (Why LoRaWAN vs Sigfox? Why ultrasonic vs magnetic sensor?) - Build in Agile sprints: Break Phase 3 into 2-week sprints with specific deliverables - Add KPIs: How will you measure success? (Detection accuracy %, battery life months, user satisfaction score)
Success Criteria: - Timeline matches chapter’s formula: 6-12 months for moderate complexity - Budget includes all categories (hardware, software, labor, cloud, certification) - Risks identified for technical, business, and supply chain - Can defend timeline and budget to stakeholders
Why This Matters: Realistic planning prevents project failure. Most IoT startups fail due to underestimated timelines/budgets, not bad technology!
Template: Download IoT Project Planning Template (create your own based on this exercise)
1637.7 Video Resources
NoteVideo: Assistive Technology Design
Learn design thinking principles through assistive technology examples, focusing on user-centered design and accessibility considerations.
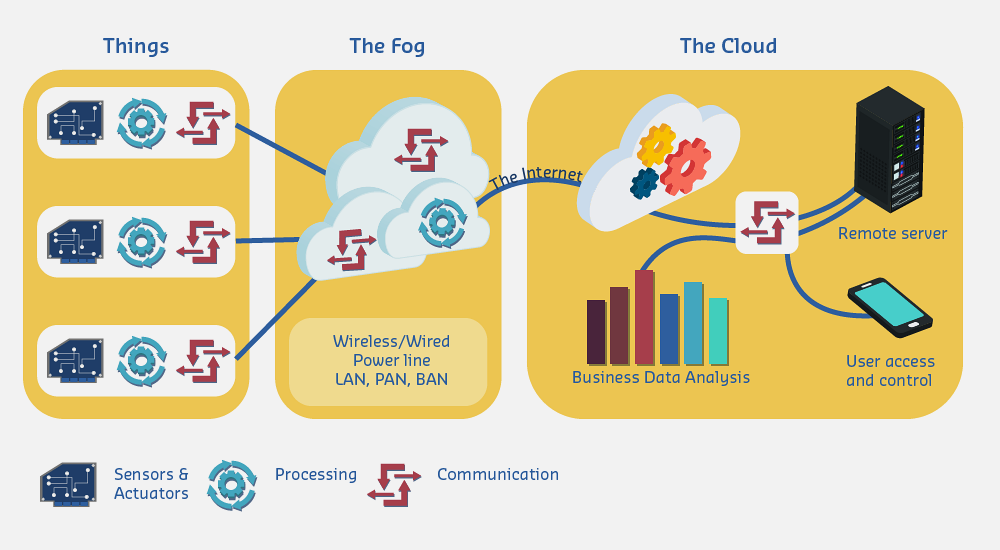
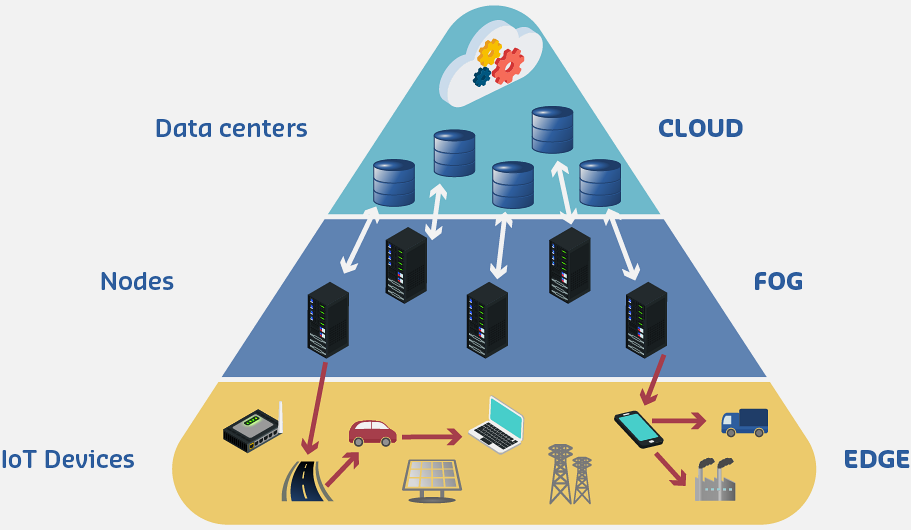
NoteVideo: What is an IoT Gateway?
Understand the role of IoT gateways in system architecture and how to plan for edge processing, protocol translation, and data aggregation.
NoteVideo: IoT Network Design and Protocol Selection
Understanding IoT network protocols and their trade-offs is essential for successful IoT product design.
Essential Learning Resources: - 2024 Guide to IoT Protocols and Standards - 8 IoT Protocols Worth Exploring - Comparing IoT Networks: LoRaWAN, Zigbee, Wi-Fi, BLE, NB-IoT
Key Protocol Comparison:
| Protocol | Range | Data Rate | Power | Use Case |
|---|---|---|---|---|
| Wi-Fi | 100m | Up to 9.6 Gbps (Wi-Fi 6) | High (80-300mA) | Home automation, high bandwidth |
| Bluetooth/BLE | 10-100m | 1-3 Mbps | Low (10-15mA) | Wearables, smartphone pairing |
| Zigbee | 10-100m | 250 kbps | Very Low (15-30mA TX) | Home automation, mesh networks |
| LoRaWAN | 2-15 km | 0.3-50 kbps | Ultra Low (20-120mA TX) | Smart cities, agriculture |
| NB-IoT | 10+ km | 200 kbps | Low (100-300mA TX) | Industrial IoT, tracking |
Decision Framework: - Short-range + high data: Wi-Fi (video streaming, firmware updates) - Short-range + low power: BLE or Zigbee (sensors, wearables) - Long-range + low data: LoRaWAN (outdoor sensors, agriculture) - Long-range + cellular: NB-IoT or LTE CAT-M1 (asset tracking, industrial)
NoteVideo: IoT Prototyping Best Practices
Learn systematic approaches to IoT product development from concept to production.
Recommended Tutorials: - ESP32 IoT Projects for Beginners - Smart Home Projects Using Arduino & ESP32 - How to Create a Proof-of-Concept IoT Prototype
Prototyping Stages: 1. Paper Prototype (1 hour): Sketch UI, test concept with users 2. Breadboard Prototype (1-2 days): Validate hardware functionality 3. 3D Printed Enclosure (1 week): Test form factor and ergonomics 4. Custom PCB v1 (2-4 weeks): Test production design 5. Pilot Production (4-8 weeks): Field testing with real users
1637.8 Summary
- Design Thinking Definition: A human-centered, iterative approach to problem-solving that emphasizes understanding user needs, challenging assumptions, and rapidly prototyping solutions
- Seven-Phase Framework: Empathize, Define, Ideate, Prototype, Test, Implement, and Iterate form a non-linear cycle where insights trigger backward loops
- Problem Statement Formula: “[User] needs [need] because [insight]” ensures solutions address real user pain points rather than assumed needs
- Prototyping Mindset: Start cheap (paper/cardboard) to validate concepts before investing in expensive hardware prototypes
- User Research ROI: 2-5% of budget on user research can prevent 42% of product failures caused by building things nobody wants
- Time Investment: Spend 35% of project time on Empathize (20%) and Define (15%) phases before building anything
1637.9 What’s Next
Continue to Empathize and Define to learn detailed techniques for user research, empathy mapping, pain point identification, and creating actionable problem statements using the HMW and POV frameworks.