%%{init: {'theme': 'base', 'themeVariables': { 'primaryColor': '#2C3E50', 'primaryTextColor': '#fff', 'primaryBorderColor': '#16A085', 'lineColor': '#16A085', 'secondaryColor': '#E67E22', 'tertiaryColor': '#ecf0f1'}}}%%
flowchart TB
    subgraph OT["Operational Technology (Data in Motion)"]
        L1[Level 1:<br/>Physical Devices & Controllers<br/>Sensors, Actuators, Embedded Systems]
        L2[Level 2:<br/>Connectivity<br/>Communication Protocols, Gateways]
        L3[Level 3:<br/>Edge Computing<br/>Evaluate, Format, Reduce]
        L4[Level 4:<br/>Data Accumulation<br/>Storage Systems, Databases]

        L1 -->|Raw Sensor Data| L2
        L2 -->|Network Data Flows| L3
        L3 -->|Processed Data| L4
    end

    subgraph IT["Information Technology (Data at Rest)"]
        L5[Level 5:<br/>Data Abstraction<br/>Reconciliation, Normalization]
        L6[Level 6:<br/>Application<br/>Analytics, Reporting, Control]
        L7[Level 7:<br/>Collaboration<br/>Business Processes, Integration]

        L4 -->|Accumulated Data| L5
        L5 -->|Abstracted Data| L6
        L6 -->|Insights| L7
    end

    subgraph Edge["Edge Computing Functions (Level 3)"]
        E1[Evaluation:<br/>Filter low-quality data]
        E2[Formatting:<br/>Standardize data]
        E3[Reduction:<br/>Aggregate & compress]
        E4[Assessment:<br/>Trigger responses]
    end

    L3 -.->|Implements| Edge

    style L1 fill:#16A085,stroke:#2C3E50,color:#fff
    style L2 fill:#16A085,stroke:#2C3E50,color:#fff
    style L3 fill:#E67E22,stroke:#2C3E50,color:#fff
    style L4 fill:#16A085,stroke:#2C3E50,color:#fff
    style L5 fill:#2C3E50,stroke:#16A085,color:#fff
    style L6 fill:#2C3E50,stroke:#16A085,color:#fff
    style L7 fill:#2C3E50,stroke:#16A085,color:#fff
    style E1 fill:#E67E22,stroke:#2C3E50,color:#fff
    style E2 fill:#E67E22,stroke:#2C3E50,color:#fff
    style E3 fill:#E67E22,stroke:#2C3E50,color:#fff
    style E4 fill:#E67E22,stroke:#2C3E50,color:#fff
1325 Edge Computing: IoT Reference Model
1325.1 Learning Objectives
By the end of this chapter, you will be able to:
- Explain the Seven-Level IoT Reference Model: Understand how data flows from physical devices through edge processing to cloud analytics
- Distinguish OT vs IT Layers: Identify which levels handle operational technology (data in motion) versus information technology (data at rest)
- Apply Level 3 Processing Functions: Implement evaluation, formatting, decoding, distillation, and assessment at the edge
- Design for Data Accumulation: Determine appropriate storage strategies at Level 4 based on data characteristics
1325.2 Prerequisites
Before diving into this chapter, you should be familiar with:
- Edge Compute Patterns Overview: Introduction to edge computing concepts and application types
- Edge, Fog, and Cloud Overview: Understanding the three-tier architecture
1325.3 IoT Reference Model Overview
The IoT Reference Model provides a structured framework for understanding where data processing occurs in IoT systems. It spans seven levels, from physical devices at the bottom to business collaboration at the top.
%%{init: {'theme': 'base', 'themeVariables': { 'primaryColor': '#2C3E50', 'primaryTextColor': '#fff', 'primaryBorderColor': '#16A085', 'lineColor': '#16A085', 'secondaryColor': '#E67E22', 'tertiaryColor': '#ecf0f1'}}}%%
sequenceDiagram
    participant S as L1: Sensor
    participant E as L3: Edge
    participant F as L4: Storage
    participant C as L5-7: Cloud

    Note over S,C: Latency at Each Level

    S->>S: Measure (1ms)
    S->>E: Transmit (~5-50ms)

    rect rgb(230, 126, 34)
        Note over E: EDGE PROCESSING
        E->>E: Evaluate (2ms)
        E->>E: Format (1ms)
        E->>E: Reduce (5ms)
        E->>E: Assess (2ms)
    end

    alt Critical Alert
        E->>S: Immediate Response (10ms)
        Note right of E: Total: 20-60ms
    else Normal Data
        E->>F: Store locally (5ms)
        F->>C: Batch upload (100-500ms)
        C->>C: Analyze (seconds-minutes)
        Note right of C: Total: seconds to hours
    end
IoT Reference Model Levels 1-7: Seven-layer architecture showing transition from Operational Technology (data in motion, Levels 1-3) to Information Technology (data at rest, Levels 5-7). Level 3 edge computing performs critical functions: evaluation, formatting, reduction, and assessment before data accumulation at Level 4.
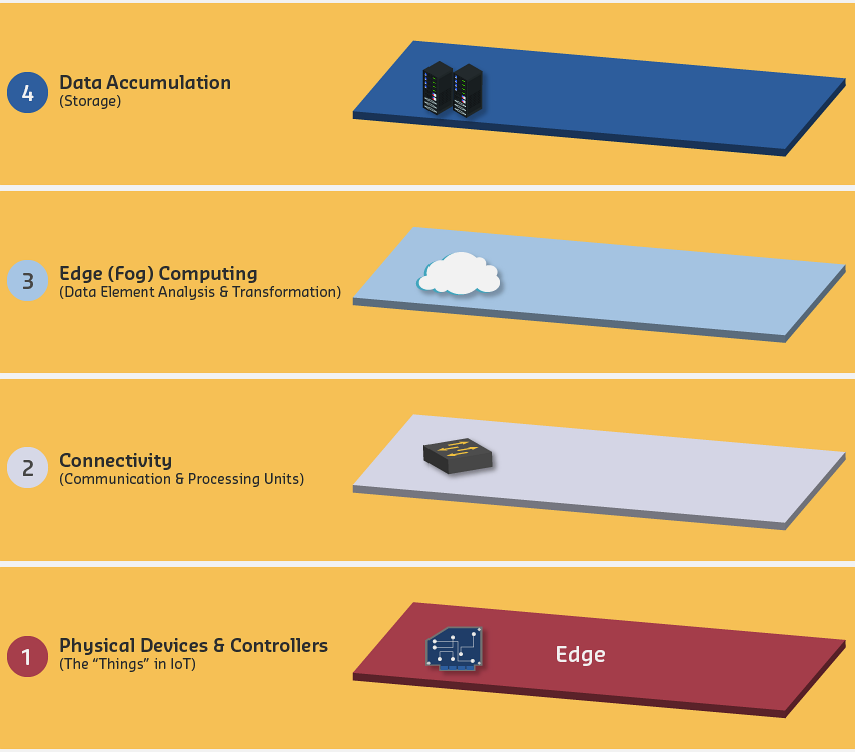
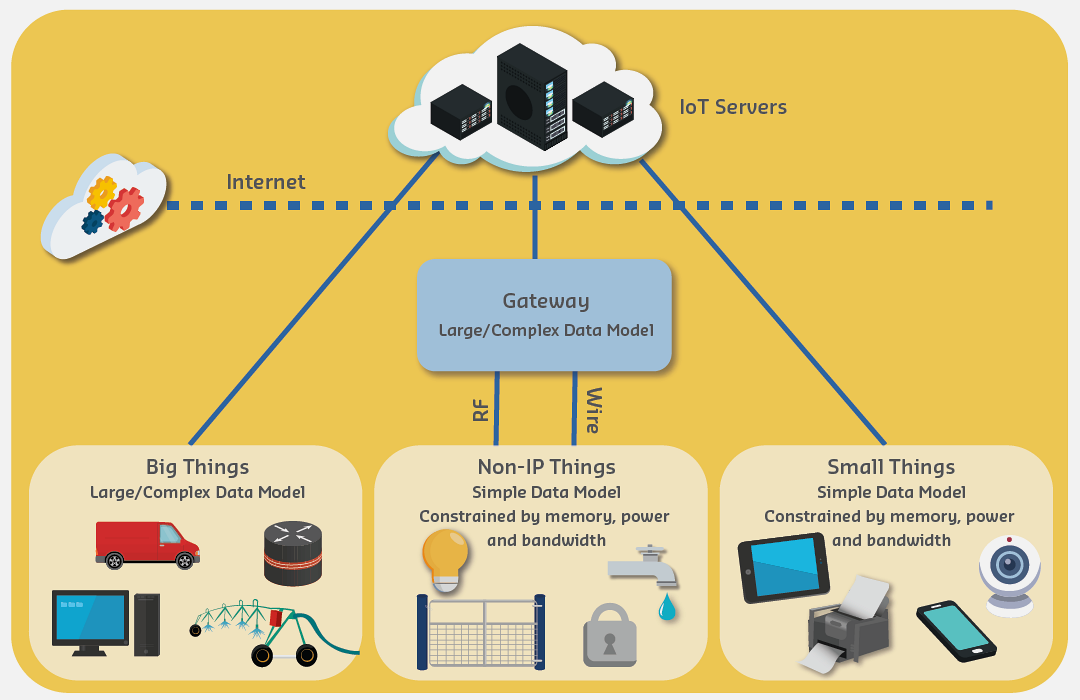
1325.4 Level 1: Physical Devices and Controllers
The IoT Reference Model starts with Level 1: Physical devices and controllers that might control multiple devices. These are the ‘Things’ in the IoT, and they include a wide range of endpoint devices that send and receive information. Today, the list of devices is already extensive and it will become almost unlimited as more equipment is added to the IoT over time.
Device Categories at Level 1:
| Category | Examples | Data Generated |
|---|---|---|
| Sensors | Temperature, humidity, pressure, motion | Continuous measurements |
| Actuators | Motors, valves, switches, displays | State changes, commands |
| Controllers | PLCs, MCUs, embedded systems | Processed signals, control loops |
| Gateways | Protocol converters, edge boxes | Aggregated device data |
1325.5 Level 2: Connectivity (Communication and Processing Unit)
Level 2 contains communications and connectivity - providing reliable, timely information transmission. This includes transmissions from devices (L1) to the network, across the network and into the Fog (L3).
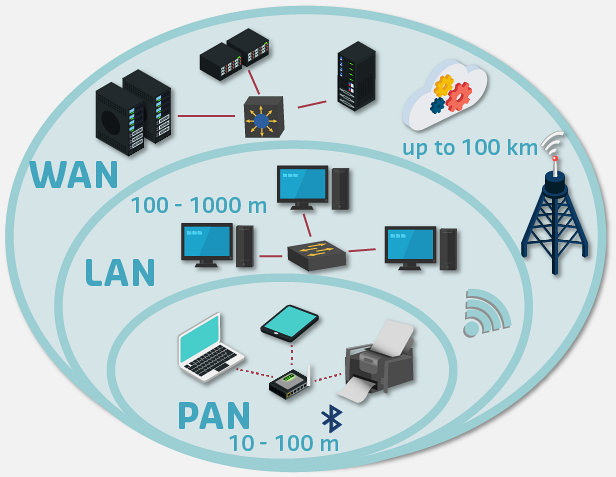
Connectivity Considerations:
- Protocol selection: Match protocol to bandwidth, range, and power requirements
- Network topology: Star, mesh, or hybrid depending on reliability needs
- Reliability mechanisms: Acknowledgments, retransmission, error correction
- Security: Encryption, authentication at the transport layer
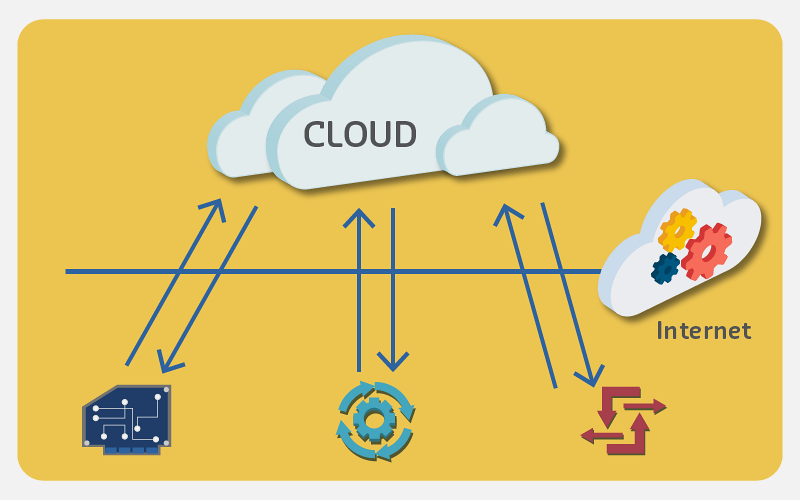
1325.6 Level 3: Edge (Fog) Computing (Data Element Analysis and Transformation)
Level 3 focuses on high-volume data analysis and transformation. It converts network data flows from Level 2 into information suitable for storage and higher-level processing at Level 4 (data accumulation). Level 3 processing can include:
- Evaluation: Applying criteria to determine if data should be processed at a higher level
- Formatting: Reformatting data to improve consistency
- Expanding/decoding: Decrypting data and translating device-specific code
- Distillation/reduction: Distilling data to reduce the amount of network traffic
- Assessment: Determining whether data should trigger a response
1325.6.1 Level 3 Processing Functions in Detail
Evaluation determines whether data warrants further processing:
Raw reading: temperature = 23.4°C
Evaluation criteria: Alert if > 30°C or < 10°C
Result: Within normal range → do not escalate
Formatting standardizes data from heterogeneous sources:
Device A reports: {"temp": 23.4, "unit": "C"}
Device B reports: {"temperature_f": 74.12}
Formatted output: {"temperature_celsius": 23.4, "timestamp": "2026-01-19T10:30:00Z"}
Distillation reduces data volume while preserving key information:
Input: 1000 temperature readings over 1 minute
Distillation: min=22.1, max=24.8, avg=23.4, stddev=0.5
Output: 4 values instead of 1000 (99.6% reduction)
Assessment triggers immediate local responses:
Vibration reading: 8.5 g-force (threshold: 5.0)
Assessment: CRITICAL - exceeds safe operating limit
Action: Trigger immediate machine shutdown (local actuator)
1325.7 Level 4: Data Accumulation (Storage)
Levels 1-3 have data in motion and are event-driven. At Level 4, the data in motion is converted to data at rest. Decisions at Level 4 include:
- Is the data of interest to higher levels?
- Does the data need to be saved or accumulated in memory for short-term use?
- Does persistency require a file system, big data system, or relational database?
- What data transformations are needed for the required storage system?
- Does the data need to be recombined or recomputed?
Storage Decision Matrix:
| Data Characteristic | Storage Type | Example |
|---|---|---|
| Short-term, high-frequency | In-memory buffer | Last 100 sensor readings |
| Time-series, queryable | Time-series DB (InfluxDB, TimescaleDB) | Historical sensor data |
| Relational, structured | SQL database | Device configuration, metadata |
| Unstructured, large | Object storage (S3, blob) | Images, video clips |
| Real-time streaming | Message queue (Kafka, MQTT) | Event streams for processing |
1325.8 Application Requirements Summary
Understanding the IoT Reference Model helps match application requirements to appropriate processing levels:
%%{init: {'theme': 'base', 'themeVariables': { 'primaryColor': '#2C3E50', 'primaryTextColor': '#fff', 'primaryBorderColor': '#16A085', 'lineColor': '#16A085', 'secondaryColor': '#E67E22', 'tertiaryColor': '#ecf0f1'}}}%%
flowchart LR
    subgraph Massive["Massive IoT"]
        M1[Scale-Focused<br/>Millions of Devices]
        M2[Cost Optimization<br/>Low-power, Low-cost]
        M3[Delay Tolerant<br/>Minutes to Hours]
        M4[Examples:<br/>Smart Metering<br/>Agriculture<br/>Asset Tracking]

        M1 --> M2 --> M3 --> M4
    end

    subgraph Critical["Critical IoT"]
        C1[Reliability-Focused<br/>99.999% Uptime]
        C2[Ultra-Low Latency<br/>< 10ms Response]
        C3[High Availability<br/>Safety-Critical]
        C4[Examples:<br/>Autonomous Vehicles<br/>Industrial Control<br/>Healthcare Monitoring]

        C1 --> C2 --> C3 --> C4
    end

    subgraph Edge["Edge Processing Strategy"]
        E1{Processing Location?}
        E1 -->|Massive IoT| E2[Batch & Aggregate<br/>at Edge]
        E1 -->|Critical IoT| E3[Real-Time Decision<br/>at Edge]

        E2 --> E4[Cloud for<br/>Analytics]
        E3 --> E5[Cloud for<br/>Monitoring Only]
    end

    Massive --> E1
    Critical --> E1

    style M1 fill:#16A085,stroke:#2C3E50,color:#fff
    style M2 fill:#16A085,stroke:#2C3E50,color:#fff
    style M3 fill:#16A085,stroke:#2C3E50,color:#fff
    style M4 fill:#16A085,stroke:#2C3E50,color:#fff
    style C1 fill:#E67E22,stroke:#2C3E50,color:#fff
    style C2 fill:#E67E22,stroke:#2C3E50,color:#fff
    style C3 fill:#E67E22,stroke:#2C3E50,color:#fff
    style C4 fill:#E67E22,stroke:#2C3E50,color:#fff
    style E1 fill:#2C3E50,stroke:#16A085,color:#fff
    style E2 fill:#27AE60,stroke:#2C3E50,color:#fff
    style E3 fill:#E74C3C,stroke:#2C3E50,color:#fff
NoteAlternative View: Latency vs Bandwidth Trade-off Matrix
This view shows how edge processing decisions balance latency and bandwidth requirements:
%% fig-alt: "Matrix showing four processing strategies based on latency and bandwidth requirements. High latency sensitivity plus high bandwidth (video analytics, autonomous vehicles) requires edge inference with local ML models. High latency sensitivity plus low bandwidth (safety alarms, control commands) requires edge decision with simple threshold checks. Low latency sensitivity plus high bandwidth (environmental monitoring, historical analysis) benefits from edge aggregation before cloud transmission. Low latency sensitivity plus low bandwidth (smart metering, asset tracking) can use cloud processing directly with periodic uploads."
%%{init: {'theme': 'base', 'themeVariables': { 'primaryColor': '#2C3E50', 'primaryTextColor': '#fff', 'primaryBorderColor': '#16A085', 'lineColor': '#16A085', 'secondaryColor': '#E67E22', 'tertiaryColor': '#ecf0f1'}}}%%
flowchart TB
    subgraph HighLatency["Latency-Sensitive (< 100ms)"]
        direction LR
        HH[High Bandwidth<br/>Video, Lidar<br/>Edge Inference]
        HL[Low Bandwidth<br/>Alarms, Commands<br/>Edge Decision]
    end

    subgraph LowLatency["Delay-Tolerant (seconds-hours)"]
        direction LR
        LH[High Bandwidth<br/>Sensors, Logs<br/>Edge Aggregation]
        LL[Low Bandwidth<br/>Meters, Trackers<br/>Cloud Processing]
    end

    Input[IoT Data] --> Check{Latency<br/>Requirement?}
    Check -->|< 100ms| HighLatency
    Check -->|Tolerant| LowLatency

    style HH fill:#E74C3C,stroke:#2C3E50,color:#fff
    style HL fill:#E67E22,stroke:#2C3E50,color:#fff
    style LH fill:#16A085,stroke:#2C3E50,color:#fff
    style LL fill:#2C3E50,stroke:#16A085,color:#fff
The optimal processing location depends on both latency sensitivity and data volume. Edge processing is essential when either latency is critical or bandwidth is limited.
Massive IoT vs Critical IoT Requirements: Two distinct IoT application categories - Massive IoT prioritizes scale and cost efficiency with delay tolerance (smart metering, agriculture), while Critical IoT demands ultra-low latency and high reliability for safety-critical applications (autonomous vehicles, industrial control). Edge processing strategies differ accordingly.
1325.9 Summary
- The seven-level IoT Reference Model separates edge computing (Levels 1-4) from cloud processing (Levels 5-7), with Level 3 as the critical edge processing layer
- Level 1 (Physical Devices) includes all sensors, actuators, and controllers that generate or receive data
- Level 2 (Connectivity) provides reliable, timely transmission through appropriate protocols and network topologies
- Level 3 (Edge Computing) transforms raw data through evaluation, formatting, distillation, and assessment before storage
- Level 4 (Data Accumulation) converts data in motion to data at rest, selecting appropriate storage types based on data characteristics
- Massive IoT applications prioritize scale and cost at Levels 1-4 with batch processing
- Critical IoT applications demand real-time processing at Level 3 with cloud for monitoring only
1325.10 What’s Next
Continue exploring edge computing patterns:
- Edge Processing Patterns covers the four primary patterns: Filter, Aggregate, Infer, and Store-Forward
- Cyber-Foraging and Edge Caching examines opportunistic compute offloading and caching strategies
- Edge Patterns Practical Guide provides interactive tools and worked examples for edge architecture decisions