%%{init: {'theme': 'base', 'themeVariables': {'primaryColor': '#2C3E50', 'primaryTextColor': '#fff', 'primaryBorderColor': '#16A085', 'lineColor': '#E67E22', 'secondaryColor': '#ECF0F1', 'tertiaryColor': '#fff', 'nodeTextColor': '#2C3E50'}}}%%
graph TB
    subgraph "SDN Anomaly Detection Methods"
        Monitor["Continuous<br/>Monitoring"]

        Flow["Flow Monitoring:<br/>- Packet rate<br/>- Byte rate<br/>- Flow duration<br/>- Flow count"]

        Port["Port Statistics:<br/>- RX/TX packets<br/>- Error rates<br/>- Link utilization<br/>- Broadcast rates"]

        Pattern["Pattern Matching:<br/>- Volumetric attacks<br/>- Protocol violations<br/>- Behavioral signatures"]

        Baseline["Establish<br/>Baseline<br/>(24-72 hours)"]

        Compare["Compare<br/>vs Baseline"]

        Detect["Anomaly<br/>Detected?"]

        Response["Automated<br/>Response:<br/>- Block<br/>- Rate-limit<br/>- Redirect<br/>- Isolate"]
    end

    Monitor --> Flow
    Monitor --> Port
    Monitor --> Pattern

    Baseline -.->|Normal ranges| Compare

    Flow --> Compare
    Port --> Compare
    Pattern --> Compare

    Compare --> Detect
    Detect -->|Yes| Response
    Detect -->|No| Monitor

    style Monitor fill:#2C3E50,stroke:#16A085,color:#fff
    style Detect fill:#E67E22,stroke:#2C3E50,color:#fff
    style Response fill:#16A085,stroke:#2C3E50,color:#fff
295 SDN Anomaly Detection
295.1 Learning Objectives
By the end of this chapter, you will be able to:
- Implement Detection Methods: Deploy flow monitoring, port statistics, and pattern matching for anomaly detection
- Establish Baselines: Create statistical baselines from 24-72 hours of traffic data for accurate detection
- Configure Response Actions: Implement blocking, rate-limiting, redirection, and isolation using OpenFlow
- Design Detection Systems: Build DDoS, port scan, and intrusion detection using SDN visibility
- Apply Real-World Scenarios: Detect and mitigate IoT botnet attacks using multi-stage response
295.2 Prerequisites
Before diving into this chapter, you should be familiar with:
- SDN Analytics Architecture: Understanding the analytics ecosystem, data flow, and metrics collection provides the foundation for anomaly detection
- SDN Fundamentals and OpenFlow: Knowledge of flow tables and OpenFlow messages is essential for implementing detection and response
CautionPitfall: Setting Anomaly Detection Thresholds Without Baseline Training
The Mistake: Deploying anomaly detection rules with fixed thresholds (e.g., “alert if traffic exceeds 1000 packets/sec”) without first establishing what “normal” looks like for your specific network and devices.
Why It Happens: Teams copy example thresholds from documentation or tutorials, or they guess based on theoretical device behavior. They want to deploy quickly without waiting for baseline data collection. The result is either constant false positives (thresholds too low) or missed attacks (thresholds too high).
The Fix: Implement a mandatory baseline training period (24-72 hours minimum) before enabling alerts. Calculate per-device or per-flow baselines using statistical methods (mean plus 3 standard deviations for 99.7% confidence). Store baselines in time-series format to account for daily patterns (office hours vs. night). Use adaptive thresholds that update weekly. For new devices, start with conservative defaults (10 packets/sec for sensors) and adjust based on observed behavior. Document your baseline methodology so thresholds can be explained during incident response.
SDN’s centralized visibility and programmable control plane enable sophisticated anomaly detection systems that can identify and respond to security threats in real-time.
295.3 Detection Methods
{fig-alt=“SDN Anomaly Detection Methods flowchart showing continuous monitoring feeding three parallel detection methods (Flow Monitoring tracking packet/byte rates and flow characteristics, Port Statistics tracking RX/TX and error rates, Pattern Matching for attack signatures), comparing against 24-72 hour baseline, anomaly detection decision point, and automated response options (block, rate-limit, redirect, isolate) when anomalies detected, otherwise loop back to monitoring”}
295.3.1 Flow Monitoring
Flow statistics provide detailed information about traffic patterns:
Metrics Tracked: - Packet rate: Packets per second for each flow - Byte rate: Bandwidth consumption - Flow duration: How long connections persist - Flow count: Number of active flows per source/destination
Anomaly Indicators: - Sudden spike in packet rate (potential DDoS) - Unusual flow duration patterns (slow DoS attacks) - High flow count from single source (port scanning) - Asymmetric traffic patterns (data exfiltration)
Implementation Approach:
1. Baseline Establishment:
   - Collect flow stats for 24-72 hours
   - Calculate mean and standard deviation for each metric
   - Define "normal" ranges (e.g., μ ± 3σ)

2. Real-Time Monitoring:
   - Poll flow statistics every 15-30 seconds
   - Compare against baseline
   - Flag deviations exceeding threshold

3. Alert Generation:
   - Sustained anomaly (>3 consecutive samples) triggers alert
   - Include context: source, destination, protocol, magnitude
295.3.2 Port Statistics
Switch port monitoring reveals device-level anomalies:
Metrics Tracked: - RX/TX packets: Bidirectional traffic volume - Error rates: CRC errors, collisions, dropped packets - Link utilization: Percentage of bandwidth consumed - Multicast/broadcast rates: Protocol overhead
Anomaly Indicators: - Port utilization exceeding 80% (congestion) - High error rates (cable issues, malicious flooding) - Unusual broadcast storms (network loops, malware) - Zero traffic on expected-active ports (device failure)
295.3.3 Pattern Matching
Signature-based detection identifies known attack patterns:
Pattern Types: - Volumetric: SYN floods, UDP floods, ICMP floods - Protocol-based: Malformed packets, protocol violations - Application-layer: HTTP floods, DNS amplification - Behavioral: Port scans (sequential port access), reconnaissance
Detection Logic:
Examples:
- SYN Flood: SYN packets > 100/sec, SYN/ACK ratio > 3:1
- Port Scan: Connections to > 20 ports within 10 seconds
- DNS Amplification: Small query → large response, response > 10× query size
- IoT Botnet: Single C&C IP, multiple outbound connections, periodic beaconing
295.4 Response Actions
Once anomalies are detected, SDN enables automated mitigation:
1. Install Blocking Rules - Drop packets matching attack signature at source switch - Prevent malicious traffic from consuming network resources - Example: Match: src_ip=attacker → Action: DROP
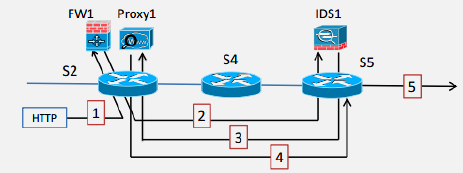
2. Redirect Traffic Through IDS/IPS - Route suspicious flows to deep packet inspection appliance - Allow detailed analysis without blocking legitimate traffic - Example: Match: protocol=HTTP, dst_port=80 → Action: output:IDS_port
3. Rate-Limit Suspicious Flows - Use OpenFlow meter tables to cap traffic rate - Prevents resource exhaustion while allowing some connectivity - Example: Match: src_mac=IoT_device → Meter: 100 kbps, burst=10 KB
4. Isolate Compromised Devices - Move infected device to quarantine VLAN - Block lateral movement while preserving management access - Example: Match: src_mac=compromised → Action: set_vlan=999, output:quarantine_port
295.5 Real-World IoT Anomaly Detection Example
Scenario: Smart building with 500 IoT sensors (temperature, occupancy, lighting)
Normal Behavior: - Each sensor sends 1 packet/minute to cloud gateway - Total network load: ~8 packets/sec - Protocol: CoAP over UDP
Attack: Mirai botnet compromises 50 sensors, uses them for DDoS
Detection:
1. Flow Monitoring Detects:
   - 50 sensors suddenly sending 1000 packets/sec each
   - New destination IPs (DDoS target) not seen in baseline
   - Protocol shift from CoAP to raw UDP

2. Port Statistics Confirm:
   - Uplink port utilization jumps from 5% to 95%
   - Packet rate increase: 8 pps → 50,000 pps

3. Pattern Matching Identifies:
   - Destination port 53 (DNS amplification attack)
   - Packet size distribution matches known Mirai signature
Automated Response:
1. Rate-Limit (immediate, within 1 second):
   FOR each compromised sensor:
     Install meter: max_rate=10 pps, burst=20 packets
   Result: Limits damage while investigating

2. Isolate (within 5 seconds):
   FOR each compromised sensor:
     Install VLAN tag rule: move to quarantine VLAN 999
     Install exception: allow management traffic (SSH port 22)
   Result: Prevents further attacks, allows remediation

3. Alert (within 10 seconds):
   Send notification to security team with:
     - List of compromised device MAC addresses
     - Attack type and severity
     - Mitigation actions taken

4. Forensics (background):
   Redirect quarantined device traffic to honeypot
   Capture packets for malware analysis
Outcome: - Attack contained in <10 seconds (vs. hours with traditional networking) - Only 50 devices affected (SDN prevented lateral spread) - Network services continued for legitimate 450 sensors - Full packet captures available for incident response
295.6 Knowledge Check
Test your understanding of SDN anomaly detection concepts.
295.7 Summary
This chapter covered SDN anomaly detection methods and automated response:
Detection Methods: - Flow Monitoring: Track packet rates, byte rates, flow duration, and flow counts to detect DDoS, slow attacks, port scanning, and data exfiltration - Port Statistics: Monitor RX/TX counters, error rates, link utilization, and broadcast rates for congestion, hardware issues, and malware - Pattern Matching: Identify volumetric attacks (SYN/UDP/ICMP floods), protocol violations, application-layer attacks, and behavioral anomalies
Baseline Establishment: - Collect 24-72 hours of traffic data to establish normal patterns - Calculate mean and standard deviation for statistical thresholds - Define anomaly as deviation beyond 3 standard deviations (99.7% confidence) - Update baselines weekly to account for changing patterns
Response Actions: - Blocking: Drop packets at source switch using flow rules - Rate-Limiting: Use OpenFlow meter tables to cap traffic rates - Redirection: Route suspicious traffic through IDS/IPS for analysis - Isolation: Move compromised devices to quarantine VLAN
Real-World Example: - Smart building with 500 IoT sensors detects Mirai botnet compromise - Sub-10-second detection and automated mitigation - Graduated response: rate-limit first, then isolate, then alert - Attack contained with minimal impact on legitimate devices
295.8 What’s Next
The next chapter explores SDN Analytics Implementation with OpenFlow, covering OpenFlow statistics collection, implementation workflows, baseline establishment strategies, and performance considerations for large-scale deployments.