%%{init: {'theme': 'base', 'themeVariables': { 'primaryColor': '#2C3E50', 'primaryTextColor': '#fff', 'primaryBorderColor': '#16A085', 'lineColor': '#16A085', 'secondaryColor': '#E67E22', 'tertiaryColor': '#ecf0f1', 'fontSize': '16px'}}}%%
graph LR
    A["Sensors<br/>(Input)"] -->|Measure Physical Variables| B["Microcontroller<br/>(Process)"]
    B -->|Execute Algorithm| C["Actuators<br/>(Output)"]
    C -->|Physical Action| D["Environment"]
    D -.->|Feedback| A

    style A fill:#2C3E50,stroke:#16A085,stroke-width:2px,color:#fff
    style B fill:#E67E22,stroke:#16A085,stroke-width:2px,color:#fff
    style C fill:#2C3E50,stroke:#16A085,stroke-width:2px,color:#fff
    style D fill:#16A085,stroke:#2C3E50,stroke-width:2px,color:#fff
212 Processes and Systems: Overview
212.1 Learning Objectives
By the end of this chapter, you will be able to:
- Understand Process Control: Explain the fundamentals of process control systems and their role in IoT
- Analyze Feedback Systems: Describe how feedback loops maintain system stability
- Apply PID Control: Implement Proportional-Integral-Derivative controllers for IoT applications
- Design Control Systems: Design appropriate control strategies for temperature, pressure, and flow systems
- Evaluate System Response: Analyze system response characteristics including settling time and overshoot
- Integrate Sensors and Actuators: Connect sensing and actuation components in control loops
NoteKey Concepts
- System: A collection of interacting components that transforms inputs into outputs, with boundaries defining what’s inside versus outside the system
- Process: A series of actions or steps that transform inputs (materials, energy, information) into outputs with added value
- Feedback Loop: A mechanism where system outputs are measured and compared to desired setpoints, generating control signals that adjust inputs
- Closed-Loop Control: Systems that automatically adjust based on feedback to maintain desired behavior without human intervention
- Open-Loop Control: Systems that operate according to predetermined inputs without measuring or responding to actual outputs
- System Stability: The ability of a system to return to equilibrium after disturbances, critical for reliable IoT device operation
212.2 Prerequisites
Before diving into this chapter, you should be familiar with:
- Sensor Fundamentals and Types: Understanding how sensors measure physical phenomena is fundamental to grasping how systems gather inputs and monitor outputs for feedback control
- Actuators: Knowledge of actuators that convert control signals to physical actions helps understand how systems produce outputs in response to processed inputs
- IoT Reference Models: Familiarity with the layered IoT architecture provides context for where processes and systems operate within the broader device-to-cloud continuum
212.3 What is a Process and What is a System?
⭐ Difficulty: Foundational
TipFor Beginners: Control Systems in IoT
Every thermostat, automatic door, and cruise control uses control systems—mechanisms that automatically maintain desired behavior without human intervention.
Simple example: Room thermostat. You set target temperature (22°C). Thermostat measures actual temperature (18°C), calculates error (4°C too cold), turns on heater. Room warms up, thermostat measures again (20°C), adjusts heater output. Eventually reaches 22°C and maintains it. This is a feedback loop.
Two types of control:
- Open-Loop: Execute predetermined actions without measuring results (toaster timer—doesn’t check if bread is actually toasted, just runs for set time)
- Closed-Loop: Measure output, compare to target, adjust inputs based on error (thermostat—continuously checks temperature and adjusts heater)
PID Controller (Proportional-Integral-Derivative): The gold standard for smooth control. Three components:
- P (Proportional): React to current error (room is 4°C cold → use 4× heater power)
- I (Integral): React to accumulated past error (been cold for 10 min → increase heater more)
- D (Derivative): React to rate of change (temperature rising fast → reduce heater to avoid overshoot)
| Term | Simple Explanation |
|---|---|
| System | Collection of components working together (sensors + processor + actuators) |
| Process | Series of actions transforming inputs to outputs (algorithm running on microcontroller) |
| Feedback Loop | Measuring output and using it to adjust input (thermostat reading temperature, adjusting heater) |
| Setpoint | Desired target value (22°C for room temperature) |
| Error | Difference between setpoint and actual value (setpoint - measured) |
| Actuator | Device that does physical work (heater, motor, valve) |
Why it matters for IoT: Every smart device uses control systems. Smart thermostats (temperature control), irrigation systems (soil moisture control), autonomous vehicles (speed/steering control), robotic arms (position control). Understanding PID helps you design stable, responsive IoT devices.
Common mistake: Setting PID gains too aggressively causes oscillation (heater rapidly turns on/off, room temperature swings wildly). Conservative tuning is smoother but slower to respond. It’s an art.
Real example: Sous vide cooker maintains water at exactly 57.0°C for 2 hours. Without PID, it would oscillate ±3°C. With PID, stays within ±0.1°C. Same hardware, smarter control algorithm.
TipFor Kids: Meet the Sensor Squad! 🌟
A control system is like having a helper who keeps checking and adjusting things to make them JUST RIGHT - like Goldilocks, but for machines!
212.3.1 The Sensor Squad Adventure: The Perfect Porridge Problem
The Sensor Squad was helping Grandma’s Smart Kitchen make the perfect porridge for breakfast. But there was a problem - the porridge kept coming out wrong!
“Too hot! Too cold! Too hot again!” cried Sammy the Temperature Sensor as he watched the porridge temperature bounce up and down. Bella the Battery was getting tired from all the work. “We need a better plan!”
Max the Microcontroller had an idea. “Let’s use something called a FEEDBACK LOOP! Sammy, you keep watching the temperature. Tell me if it’s too hot, too cold, or just right. I’ll adjust the stove based on what you say!”
The team got to work. Sammy watched the porridge: “It’s 50 degrees - way too cold! We need 80 degrees!” Max turned the stove up HIGH. A minute later, Sammy reported: “Now it’s 95 degrees - TOO HOT!” Max turned the stove DOWN.
But something was still wrong. The temperature kept going up and down like a seesaw: 95… 65… 90… 70… The porridge was never staying at the perfect 80 degrees!
Lila the LED had a clever observation: “Max, you’re being too dramatic! When we’re close to 80 degrees, don’t change the stove so much. Make TINY adjustments instead of BIG ones!”
Max tried Lila’s advice. When Sammy said “78 degrees,” Max turned the heat up just a TINY bit. When Sammy said “82 degrees,” Max turned it down just a LITTLE. Soon the temperature was steady at exactly 80 degrees!
“HOORAY!” cheered the Squad. “The porridge is PERFECT!”
“That’s called PID control,” explained Max proudly. “We look at how far we are from our goal (that’s the P), we remember if we’ve been wrong for a long time (that’s the I), and we notice if we’re getting hotter or colder quickly (that’s the D). Put them all together, and we can control ANYTHING perfectly!”
212.3.2 Key Words for Kids
| Word | What It Means |
|---|---|
| Feedback Loop | Checking the result and adjusting based on what you see - like tasting soup while cooking and adding more salt if needed |
| Setpoint | The perfect target you’re trying to reach - like 80 degrees for porridge |
| Error | How far away you are from perfect - like “we’re 10 degrees too cold” |
| PID Controller | A smart helper that uses three tricks (P, I, D) to reach the perfect target smoothly without overshooting |
212.3.3 Try This at Home!
The Blindfolded Temperature Game!
- Fill a cup with warm water (have a grown-up help!)
- Put a thermometer in the water and note the starting temperature
- Your goal: Get the water to EXACTLY 30 degrees Celsius (or pick any target)
- One person watches the thermometer and calls out: “Too hot!” or “Too cold!” or “Perfect!”
- Another person (blindfolded or looking away) adds tiny amounts of hot or cold water based on the calls
- See how long it takes to reach exactly 30 degrees and STAY there!
What you’ll discover: - If you add too much water at once, you’ll overshoot (just like Max did at first!) - Small, careful adjustments work better than big, dramatic ones - The person watching (like Sammy) is the “sensor” - the person adjusting is the “controller”
This is EXACTLY how your home thermostat, your refrigerator, and even cruise control in cars work - they’re all using feedback loops to stay at the perfect temperature or speed!
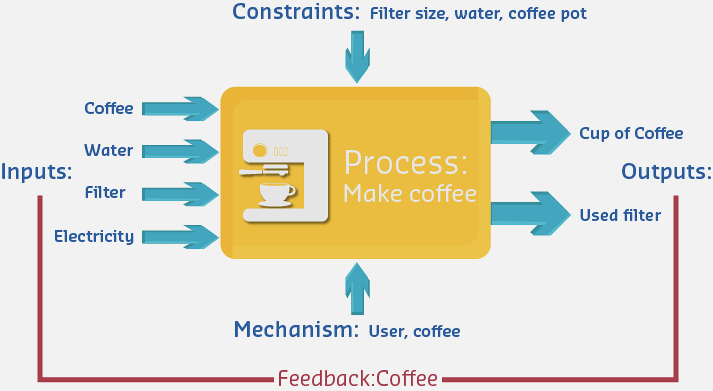
Most electronic systems, particularly IoT devices, are designed to perform specific tasks. These can be broken down into two fundamental components: the process and the system.
An electronic system is a physical interconnection of components that gathers information, processes it, and produces output. The sensors provide input, actuators provide output, and the microcontroller executes the process that transforms inputs into outputs.
Electronic System Components: Sensors gather environmental inputs, microcontroller processes data through algorithms, actuators produce physical outputs, and feedback loops enable system adaptation.
212.5.1 Block Diagram Representation

Complex electronic systems can be represented as interconnected “black boxes” where each box represents an individual component or subsystem. This block-diagram representation allows us to analyze systems at different levels of abstraction without getting overwhelmed by implementation details.
212.5.2 IoT System Decomposition
Modern IoT systems can be decomposed into hierarchical blocks at multiple levels:
%%{init: {'theme': 'base', 'themeVariables': { 'primaryColor': '#2C3E50', 'primaryTextColor': '#fff', 'primaryBorderColor': '#16A085', 'lineColor': '#16A085', 'secondaryColor': '#E67E22', 'tertiaryColor': '#ecf0f1', 'fontSize': '14px'}}}%%
graph TD
    System["IoT System"] --> Device["Device Layer"]
    System --> Network["Network Layer"]
    System --> Cloud["Cloud Layer"]

    Device --> Sensors["Sensor<br/>Subsystem"]
    Device --> MCU["Microcontroller<br/>Subsystem"]
    Device --> Actuators["Actuator<br/>Subsystem"]
    Device --> Power["Power<br/>Subsystem"]

    Sensors --> S1["Temperature<br/>Sensor"]
    Sensors --> S2["Humidity<br/>Sensor"]
    Sensors --> S3["Motion<br/>Sensor"]

    MCU --> M1["ADC<br/>Module"]
    MCU --> M2["Processing<br/>Core"]
    MCU --> M3["Memory"]
    MCU --> M4["Communication<br/>Interface"]

    Actuators --> A1["Relay<br/>Control"]
    Actuators --> A2["Motor<br/>Control"]

    Power --> P1["Battery"]
    Power --> P2["Voltage<br/>Regulator"]
    Power --> P3["Charging<br/>Circuit"]

    style System fill:#16A085,stroke:#2C3E50,stroke-width:3px,color:#fff
    style Device fill:#E67E22,stroke:#16A085,stroke-width:2px,color:#fff
    style Network fill:#E67E22,stroke:#16A085,stroke-width:2px,color:#fff
    style Cloud fill:#E67E22,stroke:#16A085,stroke-width:2px,color:#fff
    style MCU fill:#2C3E50,stroke:#16A085,stroke-width:2px,color:#fff
Hierarchical System Decomposition: IoT systems break down into device, network, and cloud layers. The device layer further decomposes into sensor, microcontroller, actuator, and power subsystems, each with specific components.
This hierarchical view helps engineers: - Identify component boundaries and interfaces - Isolate problems during debugging - Design modular, reusable subsystems - Optimize specific subsystem performance
NoteAlternative View: Control System Timing Perspectives
This variant shows the same control system concepts from a temporal perspective, illustrating how control actions and responses unfold over time.
%%{init: {'theme': 'base', 'themeVariables': { 'primaryColor': '#2C3E50', 'primaryTextColor': '#fff', 'primaryBorderColor': '#16A085', 'lineColor': '#16A085', 'secondaryColor': '#E67E22', 'tertiaryColor': '#7F8C8D', 'fontSize': '11px'}}}%%
graph LR
    subgraph Timing["CONTROL SYSTEM TIMING"]
        direction TB
        T0["T0: Setpoint Change<br/>(User sets 22°C)"]
        T1["T1: Sensor Reads<br/>(10-100ms delay)"]
        T2["T2: Controller Computes<br/>(1-10ms for PID)"]
        T3["T3: Actuator Responds<br/>(50-500ms mechanical)"]
        T4["T4: System Reacts<br/>(seconds to minutes)"]
    end

    subgraph Fast["FAST CONTROL (ms)"]
        F1["Motor Position<br/>1-10ms loop"]
        F2["Power Electronics<br/>10-100μs loop"]
    end

    subgraph Medium["MEDIUM CONTROL (sec)"]
        M1["Temperature<br/>1-10s loop"]
        M2["Pressure<br/>100ms-1s loop"]
    end

    subgraph Slow["SLOW CONTROL (min-hr)"]
        S1["Building HVAC<br/>5-15 min loop"]
        S2["Chemical Process<br/>hours per loop"]
    end

    T0 --> T1 --> T2 --> T3 --> T4

    style Timing fill:#2C3E50,color:#fff
    style Fast fill:#E74C3C,color:#fff
    style Medium fill:#E67E22,color:#fff
    style Slow fill:#16A085,color:#fff