%%{init: {'theme': 'base', 'themeVariables': { 'primaryColor': '#2C3E50', 'primaryTextColor': '#fff', 'primaryBorderColor': '#16A085', 'lineColor': '#16A085', 'secondaryColor': '#E67E22', 'tertiaryColor': '#ecf0f1', 'fontSize': '16px'}}}%%
flowchart LR
    A["User Flips<br/>Switch ON"] --> B["Switch<br/>Sensor<br/>Detects ON"]
    B --> C["Microcontroller<br/>Processes"]
    C --> D["Servo Motor<br/>Activates"]
    D --> E["Mechanical Arm<br/>Flips Switch OFF"]
    E -.->|Feedback Loop| B

    style A fill:#7F8C8D,stroke:#2C3E50,stroke-width:2px,color:#fff
    style B fill:#2C3E50,stroke:#16A085,stroke-width:2px,color:#fff
    style C fill:#E67E22,stroke:#16A085,stroke-width:2px,color:#fff
    style D fill:#E67E22,stroke:#16A085,stroke-width:2px,color:#fff
    style E fill:#16A085,stroke:#2C3E50,stroke-width:2px,color:#fff
211 Processes and Systems: Feedback Mechanisms
211.1 Feedback in Electronic Systems
⭐ Difficulty: Foundational
TipMVU: Feedback Loops
Core Concept: A feedback loop continuously measures output, compares it to a desired setpoint, and adjusts the input to minimize the difference - creating a self-correcting system that maintains stability without constant human intervention. Why It Matters: Feedback transforms “dumb” devices into smart systems - a simple heater becomes a thermostat, a motor becomes a servo, and an irrigation pump becomes a precision agriculture system. Key Takeaway: The key components are: sensor (measures output), comparator (calculates error), controller (decides action), and actuator (makes changes) - break any link and the system loses its self-regulating ability.
Feedback is a fundamental concept where a portion of the system’s output is routed back to influence the input. This creates a self-regulating mechanism that can improve system performance, stability, and accuracy.
211.1.1 Everyday Feedback Examples
We encounter feedback constantly in daily life:
- Thermostat: Room temperature (output) is measured and compared to the desired temperature (input), adjusting heating/cooling accordingly
- Cruise control: Vehicle speed (output) is monitored and throttle (input) is adjusted to maintain set speed
- Refrigerator: Internal temperature (output) controls compressor on/off cycles (input)
In IoT systems, feedback enables autonomous operation and adaptation to changing conditions.
211.1.2 Feedback in IoT Applications
IoT devices leverage feedback for various purposes:
- Environmental Control
- Smart thermostats, greenhouse automation, HVAC systems
- Process Monitoring
- Industrial sensors adjusting manufacturing parameters in real-time
- Safety Systems
- Automatic shutoffs when dangerous conditions detected
- Energy Management
- Battery monitoring systems adjusting charging rates
- Distributed Feedback
- Water quality monitoring where local sensors trigger remote actuators
%%{init: {'theme': 'base', 'themeVariables': { 'primaryColor': '#2C3E50', 'primaryTextColor': '#fff', 'primaryBorderColor': '#16A085', 'lineColor': '#16A085', 'secondaryColor': '#E67E22', 'tertiaryColor': '#ecf0f1', 'fontSize': '14px'}}}%%
graph TB
    subgraph Edge ["Edge Devices"]
        S1["Water Quality<br/>Sensor Node"]
        A1["Aeration Pump<br/>Actuator Node"]
    end

    subgraph Cloud ["Cloud Layer"]
        C1["IoT Platform<br/>Decision Engine"]
        C2["Rule Engine:<br/>IF DO < 5mg/L<br/>THEN Activate Pump"]
        C3["Data Storage<br/>& Analytics"]
    end

    S1 -->|Dissolved Oxygen<br/>Reading: 4.2 mg/L| C1
    C1 --> C2
    C2 -->|Evaluate Condition| C3
    C2 -->|Send Command:<br/>Turn ON Pump| A1
    A1 -->|Increase DO Level| Water["Water Body"]
    Water -.->|Feedback: Measure<br/>New DO Level| S1

    style S1 fill:#2C3E50,stroke:#16A085,stroke-width:2px,color:#fff
    style A1 fill:#E67E22,stroke:#16A085,stroke-width:2px,color:#fff
    style C1 fill:#16A085,stroke:#2C3E50,stroke-width:2px,color:#fff
    style C2 fill:#E67E22,stroke:#16A085,stroke-width:2px,color:#fff
    style Water fill:#7F8C8D,stroke:#2C3E50,stroke-width:2px,color:#fff
Distributed IoT Feedback System: Sensor nodes transmit water quality data to cloud platform, where rule engine evaluates conditions and sends commands to remote actuator nodes, creating a closed feedback loop across network boundaries.
This distributed feedback system demonstrates how IoT architectures can implement control loops across multiple devices and network boundaries, with cloud-based decision-making coordinating local sensor and actuator nodes.
211.2 Electronic Feedback Systems
⭐⭐ Difficulty: Intermediate
Feedback systems are classified based on whether they monitor and respond to their outputs. The two primary categories are closed-loop and open-loop systems, each with distinct characteristics and applications.
211.2.1 Closed-Loop Feedback Systems
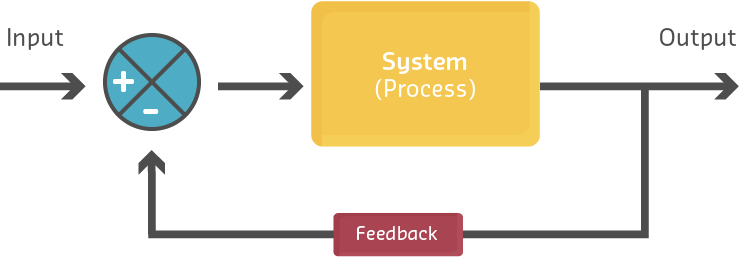
In a closed-loop system, a portion of the output is fed back to the input and either added to (positive feedback) or subtracted from (negative feedback) the input signal. This creates a self-regulating system that continuously updates based on current output conditions.
%%{init: {'theme': 'base', 'themeVariables': { 'primaryColor': '#2C3E50', 'primaryTextColor': '#fff', 'primaryBorderColor': '#16A085', 'lineColor': '#16A085', 'secondaryColor': '#E67E22', 'tertiaryColor': '#ecf0f1', 'fontSize': '16px'}}}%%
graph LR
    SP["Set Point<br/>Desired Value"] --> Comparator["⊖<br/>Comparator"]
    Feedback["Feedback<br/>Sensor"] -->|Measured<br/>Output| Comparator
    Comparator -->|Error Signal<br/>SP minus Measured| Controller["Controller"]
    Controller -->|Control Signal| Process["Process/<br/>Plant"]
    Process -->|Output| Output["System<br/>Output"]
    Output -.->|Feedback Path| Feedback

    style SP fill:#16A085,stroke:#2C3E50,stroke-width:2px,color:#fff
    style Comparator fill:#E67E22,stroke:#16A085,stroke-width:3px,color:#fff
    style Controller fill:#2C3E50,stroke:#16A085,stroke-width:2px,color:#fff
    style Process fill:#7F8C8D,stroke:#16A085,stroke-width:2px,color:#fff
    style Feedback fill:#2C3E50,stroke:#16A085,stroke-width:2px,color:#fff
    style Output fill:#16A085,stroke:#2C3E50,stroke-width:2px,color:#fff
Closed-Loop Feedback System Block Diagram: Set point is compared with measured output, generating error signal. Controller processes error and adjusts system input. Feedback sensor creates continuous regulation loop.
Key Components:
- Set Point (SP): The desired target value
- Error Signal: Difference between set point and measured output
- Controller: Processes error and determines corrective action
- Process/Plant: The system being controlled
- Feedback Sensor: Measures actual output
- Comparator (Σ): Computes error = SP - measured value
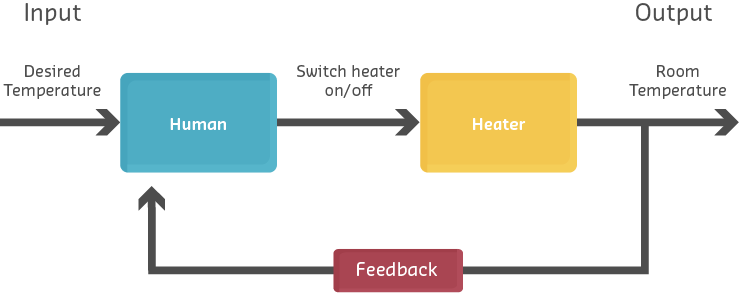
NoteExample: Smart Home Heating System
%%{init: {'theme': 'base', 'themeVariables': { 'primaryColor': '#2C3E50', 'primaryTextColor': '#fff', 'primaryBorderColor': '#16A085', 'lineColor': '#16A085', 'secondaryColor': '#E67E22', 'tertiaryColor': '#ecf0f1', 'fontSize': '15px'}}}%%
flowchart LR
    SP["Target:<br/>22°C"] --> Comp["Compare"]
    Sensor["Temperature<br/>Sensor:<br/>21°C"] --> Comp
    Comp -->|Error: +1°C<br/>Need Heat| MCU["Smart<br/>Thermostat<br/>Controller"]
    MCU -->|Activate| Heater["Heating<br/>System"]
    Heater -->|Warm Air| Room["Room<br/>Environment"]
    Room -.->|Measure<br/>Temperature| Sensor

    style SP fill:#16A085,stroke:#2C3E50,stroke-width:2px,color:#fff
    style Comp fill:#E67E22,stroke:#16A085,stroke-width:2px,color:#fff
    style MCU fill:#2C3E50,stroke:#16A085,stroke-width:2px,color:#fff
    style Heater fill:#E67E22,stroke:#16A085,stroke-width:2px,color:#fff
    style Sensor fill:#2C3E50,stroke:#16A085,stroke-width:2px,color:#fff
    style Room fill:#7F8C8D,stroke:#16A085,stroke-width:2px,color:#fff
Smart Home Heating Control Loop: Thermostat compares target (22°C) with measured temperature (21°C), calculates error (+1°C), activates heater, and continuously monitors room temperature to maintain setpoint.
Operation: 1. User sets desired temperature: 22°C 2. Temperature sensor measures actual temperature: 21°C 3. Error = 22°C - 21°C = +1°C 4. Controller activates heating system 5. Room temperature rises toward 22°C 6. As error decreases, heating output adjusts 7. System maintains temperature within tolerance
Negative vs Positive Feedback:
%%{init: {'theme': 'base', 'themeVariables': { 'primaryColor': '#2C3E50', 'primaryTextColor': '#fff', 'primaryBorderColor': '#16A085', 'lineColor': '#16A085', 'secondaryColor': '#E67E22', 'tertiaryColor': '#ecf0f1', 'fontSize': '14px'}}}%%
graph TB
    subgraph Negative ["Negative Feedback (Stabilizing)"]
        N1["Setpoint:<br/>22°C"] --> N2["Error:<br/>+2°C too cold"]
        N2 -->|Increase Heat| N3["Temperature<br/>Rises"]
        N3 -->|Error Decreases| N4["Reduce Heat<br/>Output"]
        N4 -.->|Approaches Target| N1
    end

    subgraph Positive ["Positive Feedback (Amplifying)"]
        P1["Small Voltage<br/>Increase"] --> P2["Amplifier<br/>Gain x10"]
        P2 -->|Output| P3["Larger Voltage"]
        P3 -->|Feed Back| P2
        P2 -.->|Continues<br/>Amplifying| P4["Saturates or<br/>Oscillates"]
    end

    style N1 fill:#16A085,stroke:#2C3E50,stroke-width:2px,color:#fff
    style N2 fill:#E67E22,stroke:#16A085,stroke-width:2px,color:#fff
    style N3 fill:#2C3E50,stroke:#16A085,stroke-width:2px,color:#fff
    style N4 fill:#2C3E50,stroke:#16A085,stroke-width:2px,color:#fff
    style P1 fill:#2C3E50,stroke:#16A085,stroke-width:2px,color:#fff
    style P2 fill:#E67E22,stroke:#16A085,stroke-width:2px,color:#fff
    style P3 fill:#16A085,stroke:#2C3E50,stroke-width:2px,color:#fff
    style P4 fill:#E74C3C,stroke:#2C3E50,stroke-width:2px,color:#fff
Negative vs Positive Feedback Comparison: Negative feedback opposes changes to stabilize the system (thermostat reducing heat as temperature approaches target). Positive feedback amplifies changes, leading to runaway growth or oscillation.
Negative Feedback (most common in IoT): - Opposes changes from the set point - Provides stability and regulation - Example: Thermostat reducing heat as temperature approaches target

Positive Feedback (less common, specialized uses): - Reinforces changes from the set point - Can cause instability or rapid state changes - Example: Schmitt trigger with hysteresis for noise immunity
211.2.2 Open-Loop Control Systems
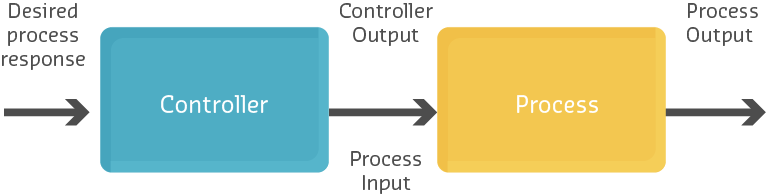
An open-loop system does not monitor or measure its output. It executes a predetermined action based solely on the input, without feedback. This is also called a non-feedback system.
%%{init: {'theme': 'base', 'themeVariables': { 'primaryColor': '#2C3E50', 'primaryTextColor': '#fff', 'primaryBorderColor': '#16A085', 'lineColor': '#16A085', 'secondaryColor': '#E67E22', 'tertiaryColor': '#ecf0f1', 'fontSize': '16px'}}}%%
graph LR
    Input["Input<br/>(Set Timer<br/>60 min)"] --> Controller["Controller<br/>(Timer)"]
    Controller -->|Run for<br/>60 minutes| Process["Process<br/>(Dryer)"]
    Process -->|Unknown State| Output["Output<br/>(Clothes)"]

    style Input fill:#16A085,stroke:#2C3E50,stroke-width:2px,color:#fff
    style Controller fill:#2C3E50,stroke:#16A085,stroke-width:2px,color:#fff
    style Process fill:#E67E22,stroke:#16A085,stroke-width:2px,color:#fff
    style Output fill:#7F8C8D,stroke:#16A085,stroke-width:2px,color:#fff
Open-Loop System Block Diagram: Input (timer setting) determines controller action without measuring output state. System executes predetermined sequence with no knowledge of actual results (clothes may be over-dried or under-dried).
Characteristics:
- No feedback path from output to input
- Cannot self-correct for disturbances or errors
- Simpler and less expensive to implement
- Suitable when output is predictable and disturbances are minimal
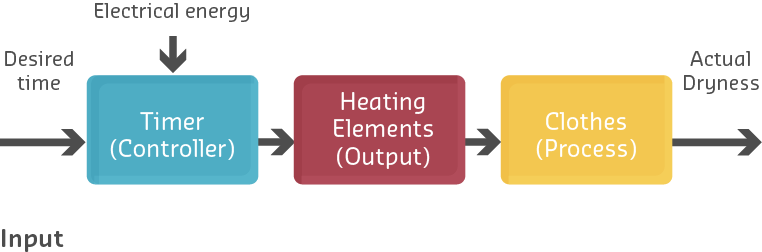
211.3 Example: Automatic Clothes Dryer
%%{init: {'theme': 'base', 'themeVariables': { 'primaryColor': '#2C3E50', 'primaryTextColor': '#fff', 'primaryBorderColor': '#16A085', 'lineColor': '#16A085', 'secondaryColor': '#E67E22', 'tertiaryColor': '#ecf0f1', 'fontSize': '15px'}}}%%
flowchart LR
    User["User Sets<br/>Timer: 60 min"] --> Timer["Timer<br/>Controller"]
    Timer -->|Start Heating<br/>& Drum Rotation| Dryer["Dryer<br/>Process"]
    Dryer -->|Heat + Tumble<br/>for 60 min| Clothes["Clothes<br/>(Unknown<br/>Dryness)"]
    Timer -.->|60 min Elapsed| Stop["Stop<br/>Dryer"]

    style User fill:#7F8C8D,stroke:#2C3E50,stroke-width:2px,color:#fff
    style Timer fill:#2C3E50,stroke:#16A085,stroke-width:2px,color:#fff
    style Dryer fill:#E67E22,stroke:#16A085,stroke-width:2px,color:#fff
    style Clothes fill:#16A085,stroke:#2C3E50,stroke-width:2px,color:#fff
    style Stop fill:#E74C3C,stroke:#2C3E50,stroke-width:2px,color:#fff
Clothes Dryer Open-Loop Operation: Timer runs for preset duration without measuring moisture content. Clothes may be over-dried (energy waste, fabric damage) or under-dried (ineffective) with no adaptive adjustment.
Operation: 1. User sets timer for 60 minutes 2. Dryer runs heating element and drum for 60 minutes 3. Timer expires, dryer stops 4. No measurement of whether clothes are actually dry
Problem: Clothes might be over-dried (wasted energy, fabric damage) or under-dried (ineffective), but the system has no way to know or adjust.
Modern IoT Enhancement: Adding a humidity sensor creates a closed-loop system that stops when clothes are dry, regardless of time elapsed.
211.3.1 Open-Loop in IoT Sensing Applications
Open-loop architectures are increasingly common in IoT data collection scenarios where:
- Device only senses and transmits data
- No local actuation required
- Analysis and decision-making occur remotely
- Feedback loop exists at system level, but not device level
%%{init: {'theme': 'base', 'themeVariables': { 'primaryColor': '#2C3E50', 'primaryTextColor': '#fff', 'primaryBorderColor': '#16A085', 'lineColor': '#16A085', 'secondaryColor': '#E67E22', 'tertiaryColor': '#ecf0f1', 'fontSize': '15px'}}}%%
flowchart TB
    Sensor["Sensor Node<br/>(Open-Loop)"] -->|Periodic Data<br/>Transmission| Cloud["Cloud<br/>Platform"]
    Sensor -->|Temp: 24°C<br/>Humidity: 65%| Cloud
    Cloud -->|Store & Analyze| DB["Data<br/>Storage"]
    Cloud -->|Dashboard| User["Human<br/>Operator"]

    style Sensor fill:#2C3E50,stroke:#16A085,stroke-width:2px,color:#fff
    style Cloud fill:#16A085,stroke:#2C3E50,stroke-width:2px,color:#fff
    style DB fill:#7F8C8D,stroke:#16A085,stroke-width:2px,color:#fff
    style User fill:#E67E22,stroke:#16A085,stroke-width:2px,color:#fff
IoT Sensor Node Open-Loop Data Collection: Device only senses and transmits data periodically without local actuation. No device-level feedback loop, but human operators or cloud systems may take action based on reported data.
Characteristics: - Node transmits sensor readings periodically - No local feedback or control - Simple, low power consumption - Suitable for remote monitoring applications
However, at the system level, there may be feedback:
%%{init: {'theme': 'base', 'themeVariables': { 'primaryColor': '#2C3E50', 'primaryTextColor': '#fff', 'primaryBorderColor': '#16A085', 'lineColor': '#16A085', 'secondaryColor': '#E67E22', 'tertiaryColor': '#ecf0f1', 'fontSize': '14px'}}}%%
graph TB
subgraph Edge ["Edge Devices (Open-Loop Individually)"]
S["Sensor Node:<br/>Measure Soil<br/>Moisture 25%"]
A["Actuator Node:<br/>Irrigation Valve"]
end
subgraph Cloud ["Cloud System (Closed-Loop Coordination)"]
P["IoT Platform"]
R["Rule: IF moisture<br/>< 30% THEN<br/>Activate Irrigation"]
D["Database &<br/>Analytics"]
end
S -->|Transmit:<br/>Moisture = 25%| P
P --> R
R -->|Evaluate| D
R -->|Command:<br/>Open Valve| A
A -->|Water Soil| Field["Field"]
Field -.->|Moisture Increases<br/>to 60%| S
style S fill:#2C3E50,stroke:#16A085,stroke-width:2px,color:#fff
style A fill:#E67E22,stroke:#16A085,stroke-width:2px,color:#fff
style P fill:#16A085,stroke:#2C3E50,stroke-width:2px,color:#fff
style R fill:#E67E22,stroke:#16A085,stroke-width:2px,color:#fff
style Field fill:#7F8C8D,stroke:#16A085,stroke-width:2px,color:#fff
System-Level Closed-Loop with Device-Level Open-Loop: Individual sensor and actuator nodes operate open-loop (no local feedback), but cloud platform creates system-level feedback by coordinating remote sensing and actuation based on rules.
This architecture demonstrates that while individual devices operate open-loop, the overall IoT system implements closed-loop control through cloud-based coordination.
TipMVU: Open-Loop vs Closed-Loop Control
Core Concept: Open-loop systems execute predetermined actions without measuring results (like a timer), while closed-loop systems continuously measure output and adjust to maintain desired state (like a thermostat). Why It Matters: Closed-loop costs more but adapts to disturbances - choose open-loop for predictable, cost-sensitive applications; choose closed-loop when accuracy matters more than simplicity. Key Takeaway: Ask yourself: “Will the environment change unpredictably?” If yes, use closed-loop. If the process is highly repeatable with minimal disturbances, open-loop may suffice and save cost.