257  DTN Social Routing

257.1 Learning Objectives

By the end of this chapter, you will be able to:

  • Apply Context-Aware Routing: Use utility functions based on mobility, colocation, and resources
  • Design SocialCast Protocols: Implement social network-based forwarding with bounded replication
  • Calculate Utility Functions: Combine colocation probability, mobility scores, and resource levels
  • Optimize Forwarding Decisions: Select carriers based on delivery likelihood rather than flooding
  • Evaluate Trade-offs: Balance delivery ratio, latency, and resource consumption

257.2 Prerequisites

Before diving into this chapter, you should be familiar with:

Social Routing - The Smart Strategy:

Instead of telling everyone (epidemic routing), tell people who are likely to meet the destination. Like asking “Can you deliver this message?” only to people who work near the recipient’s office.

SocialCast uses social patterns: - If Node A frequently encounters Node B, A has high “utility” for delivering to B - Forward messages only to higher-utility carriers - Bounded replication (create only 5-10 copies, not unlimited) - Result: 88% delivery with 200% overhead (vs 95% delivery with 1000% overhead in epidemic routing)

Term Simple Explanation Everyday Analogy
PRoPHET Forward to nodes with high encounter history Give message to people who often see recipient
Utility Function Score measuring delivery likelihood Probability mailman reaches your address
Context-Aware Using location, mobility, relationships for decisions Asking directions from locals, not tourists

DTN Series: - DTN Fundamentals - Store-carry-forward basics - DTN Epidemic Routing - Flooding-based protocols - DTN Applications - Real-world DTN deployments

Background: - Multi-Hop Fundamentals - Multi-hop communication - Ad-hoc Fundamentals - Ad-hoc network basics

Learning: - Simulations Hub - DTN simulators

257.3 Context-Aware Routing

⏱️ ~12 min | ⭐⭐ Intermediate | 📋 P04.C01.U03

Context-aware routing diagram showing source node evaluating three potential carriers using utility function that combines location history, mobility patterns, and social relationships to select highest-probability forwarding path to destination
Figure 257.1: Context-aware routing example using location, mobility, and social context for intelligent forwarding decisions

When node mobility is predictable or observable, smarter forwarding decisions can be made using context information.

257.3.1 Context-Aware Routing (CAR) Concept

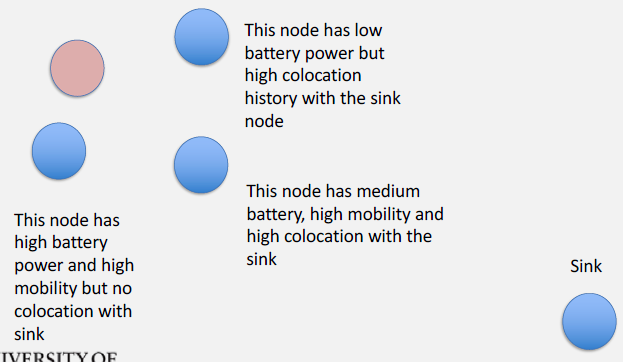
Rather than blindly replicating packets, CAR uses utility functions to select best carriers based on:

  1. Mobility patterns: Where do nodes typically move?
  2. Colocation history: Which nodes frequently encounter destination?
  3. Social relationships: Friend networks, interest groups
  4. Resources: Battery, buffer space

%% fig-alt: "Context-aware routing utility evaluation showing source node evaluating three potential carriers with utility scores: Carrier 1 with U=0.8 (high mobility, frequent contacts) selected as best choice, Carrier 2 with U=0.3 (low mobility, rare contacts) as lower utility option, and Carrier 3 with U=0.1 (low battery, wrong direction) as worst choice for delivering to destination"
%%{init: {'theme': 'base', 'themeVariables': { 'primaryColor': '#2C3E50', 'primaryTextColor': '#fff', 'primaryBorderColor': '#16A085', 'lineColor': '#16A085', 'secondaryColor': '#E67E22', 'tertiaryColor': '#7F8C8D', 'fontSize': '16px'}}}%%
graph LR
    S[Source] --> Decision{Evaluate<br/>Utility}
    Decision -->|U=0.8| C1[Carrier 1<br/>High mobility<br/>Frequent contacts]
    Decision -->|U=0.3| C2[Carrier 2<br/>Low mobility<br/>Rare contacts]
    Decision -->|U=0.1| C3[Carrier 3<br/>Low battery<br/>Wrong direction]

    C1 -->|Best choice| D[Destination]
    C2 -.Lower utility.- D
    C3 -.Worst choice.- D

    style S fill:#2C3E50,stroke:#16A085,color:#fff
    style Decision fill:#16A085,stroke:#2C3E50,color:#fff
    style C1 fill:#16A085,stroke:#2C3E50,color:#fff
    style C2 fill:#E67E22,stroke:#16A085,color:#fff
    style C3 fill:#7F8C8D,stroke:#16A085,color:#fff
    style D fill:#2C3E50,stroke:#16A085,color:#fff

Figure 257.2: Context-aware routing utility evaluation showing source node evaluating three potential carriers with utility scores.

257.3.2 Utility Function Design

Basic Utility Function:

\[ U(X, D) = \alpha \cdot P_{colocation}(X, D) + \beta \cdot Mobility(X) + \gamma \cdot Resources(X) \]

Where: - \(U(X, D)\) = Utility of node X for delivering to destination D - \(P_{colocation}(X, D)\) = Probability X will encounter D - \(Mobility(X)\) = Mobility score (higher = visits more locations) - \(Resources(X)\) = Battery level, buffer space - \(\alpha, \beta, \gamma\) = Weighting parameters

Colocation Prediction (Kalman Filter):

CAR uses Kalman filter to predict future encounters based on past history:

def predict_colocation(node_x, node_d, history):
    """
    Predict probability node_x will encounter node_d
    based on past encounter history using Kalman filter
    """
    # Historical encounter frequency
    encounters = sum(1 for t in history if met(node_x, node_d, t))
    total_windows = len(history)

    # Kalman filter state
    # (Simplified - real implementation more complex)
    predicted_rate = encounters / total_windows

    # Adjust for time since last encounter
    time_since_last = time_now() - last_encounter_time(node_x, node_d)
    decay_factor = exp(-time_since_last / DECAY_CONSTANT)

    return predicted_rate * decay_factor

257.3.3 CAR vs Epidemic Routing

Example Scenario:

%% fig-alt: "Comparison of epidemic routing versus context-aware routing showing epidemic routing with source replicating to all nodes creating 15.3 copies achieving 95% delivery through flooding, while CAR routing selectively forwards through high-utility and better carriers creating only 3.2 copies achieving 88% delivery with much lower overhead"
%%{init: {'theme': 'base', 'themeVariables': { 'primaryColor': '#2C3E50', 'primaryTextColor': '#fff', 'primaryBorderColor': '#16A085', 'lineColor': '#16A085', 'secondaryColor': '#E67E22', 'tertiaryColor': '#7F8C8D', 'fontSize': '16px'}}}%%
graph TD
    subgraph "Epidemic Routing"
        E_S[Source] --> E_1[Node 1]
        E_S --> E_2[Node 2]
        E_S --> E_3[Node 3]
        E_1 --> E_4[Node 4]
        E_1 --> E_5[Node 5]
        E_2 --> E_6[Node 6]
        E_3 --> E_7[Node 7]
        E_Result["15.3 copies<br/>95% delivery"]
    end

    subgraph "CAR Routing"
        C_S[Source] --> C_Best[High Utility<br/>Carrier]
        C_Best --> C_Better[Better<br/>Carrier]
        C_Better --> C_Dest[Destination]
        C_Result["3.2 copies<br/>88% delivery"]
    end

    style E_S fill:#E67E22,stroke:#16A085,color:#fff
    style E_Result fill:#7F8C8D,stroke:#16A085,color:#fff
    style C_S fill:#2C3E50,stroke:#16A085,color:#fff
    style C_Best fill:#16A085,stroke:#2C3E50,color:#fff
    style C_Better fill:#16A085,stroke:#2C3E50,color:#fff
    style C_Dest fill:#2C3E50,stroke:#16A085,color:#fff
    style C_Result fill:#16A085,stroke:#2C3E50,color:#fff

Figure 257.3: Comparison of epidemic routing versus context-aware routing showing different replication strategies.

Performance Comparison:

Table 257.1: CAR vs Epidemic Performance
Metric Epidemic CAR
Delivery Ratio 95% 88%
Overhead (copies) 15.3 3.2
Average Latency 450s 520s
Energy per Delivery High Medium

Trade-off: - CAR: Slightly lower delivery ratio, much lower overhead - Best when: Resources constrained, predictable mobility

257.4 SocialCast: Social-Based DTN Routing

⏱️ ~15 min | ⭐⭐⭐ Advanced | 📋 P04.C01.U04

SocialCast architecture diagram showing publishers creating bounded replicas, mobile carriers with computed utility scores transporting messages, and subscribers receiving content based on interest matching, with arrows indicating selective forwarding to higher-utility nodes
Figure 257.4: SocialCast: Social-based DTN routing leveraging node relationships and encounter patterns for efficient message delivery

SocialCast extends CAR by exploiting social network structures for packet dissemination.

257.4.1 SocialCast Concepts

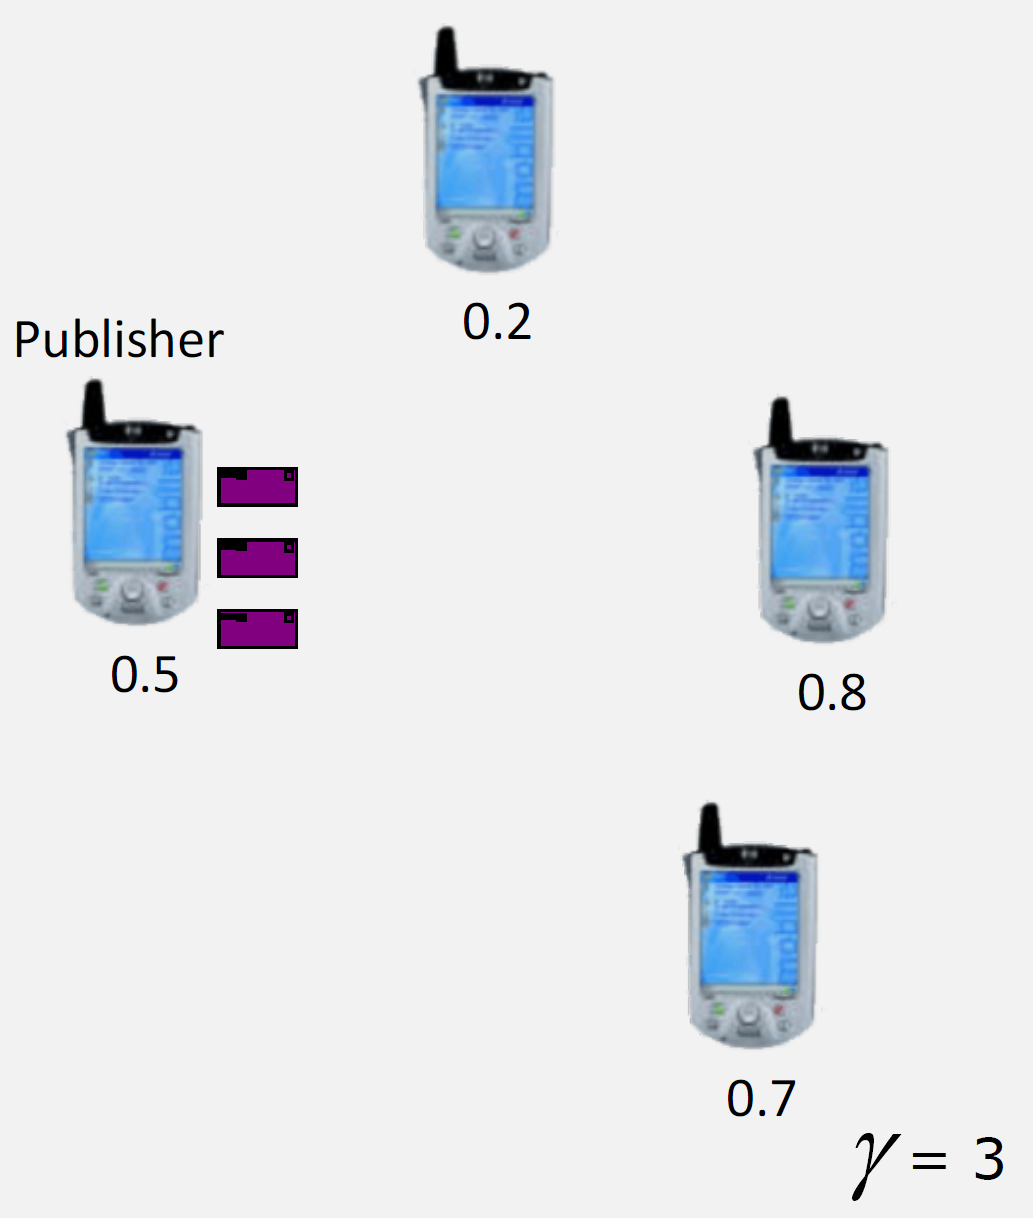
Key Insight: People with similar interests tend to be colocated periodically.

Application: Publish-subscribe in DTN - Publishers: Generate content - Subscribers: Want to receive content matching interests - Carriers: Mobile nodes with high utility transport messages

%% fig-alt: "SocialCast publish-subscribe architecture showing publisher creating gamma replicas distributed to carriers with increasing utility scores (U=0.6, 0.7, 0.8), replicas upgrading from lower to higher utility carriers, and highest utility carrier 3 delivering content to multiple subscribers"
%%{init: {'theme': 'base', 'themeVariables': { 'primaryColor': '#2C3E50', 'primaryTextColor': '#fff', 'primaryBorderColor': '#16A085', 'lineColor': '#16A085', 'secondaryColor': '#E67E22', 'tertiaryColor': '#7F8C8D', 'fontSize': '16px'}}}%%
graph TD
    Pub[Publisher<br/>Creates Content] --> Rep{Create γ<br/>Replicas}
    Rep --> C1[Carrier 1<br/>U=0.6]
    Rep --> C2[Carrier 2<br/>U=0.7]
    Rep --> C3[Carrier 3<br/>U=0.8]

    C1 -->|Upgrade| C2
    C2 -->|Upgrade| C3
    C3 -->|Deliver| Sub1[Subscriber 1]
    C3 -->|Deliver| Sub2[Subscriber 2]

    style Pub fill:#2C3E50,stroke:#16A085,color:#fff
    style Rep fill:#16A085,stroke:#2C3E50,color:#fff
    style C1 fill:#E67E22,stroke:#16A085,color:#fff
    style C2 fill:#E67E22,stroke:#16A085,color:#fff
    style C3 fill:#16A085,stroke:#2C3E50,color:#fff
    style Sub1 fill:#2C3E50,stroke:#16A085,color:#fff
    style Sub2 fill:#2C3E50,stroke:#16A085,color:#fff

Figure 257.5: SocialCast publish-subscribe architecture showing publisher creating gamma replicas distributed to carriers with increasing utility scores.

257.4.2 SocialCast Protocol

Message Replication Strategy:

  1. Create gamma replicas at publisher
  2. Forward only to “better” carriers:
    • Better = utility(neighbor) > utility(self)
  3. Carriers hold messages until:
    • Finding even better carrier, OR
    • Encountering subscriber
  4. Replicas never increase (bounded replication)
  5. TTL prevents infinite lifetime

%% fig-alt: "SocialCast protocol flowchart showing message creation with gamma replicas, node encounter triggering utility comparison, forwarding replica if neighbor utility exceeds self or keeping replica otherwise, replicas climbing to better carriers over time, and final delivery when encountering subscriber node"
%%{init: {'theme': 'base', 'themeVariables': { 'primaryColor': '#2C3E50', 'primaryTextColor': '#fff', 'primaryBorderColor': '#16A085', 'lineColor': '#16A085', 'secondaryColor': '#E67E22', 'tertiaryColor': '#7F8C8D', 'fontSize': '16px'}}}%%
flowchart TD
    Start[Message Created<br/>γ replicas] --> Encounter{Node<br/>Encounter}
    Encounter -->|Utility Check| Compare{Neighbor<br/>Utility > Self?}
    Compare -->|Yes| Forward[Forward Replica]
    Compare -->|No| Keep[Keep Replica]
    Forward --> Climb[Replica climbs<br/>to better carrier]
    Keep --> Wait[Wait for<br/>better opportunity]
    Climb --> Dest{Is<br/>Subscriber?}
    Wait --> Dest
    Dest -->|Yes| Deliver[Deliver Message]
    Dest -->|No| Encounter

    style Start fill:#2C3E50,stroke:#16A085,color:#fff
    style Encounter fill:#16A085,stroke:#2C3E50,color:#fff
    style Compare fill:#16A085,stroke:#2C3E50,color:#fff
    style Forward fill:#E67E22,stroke:#16A085,color:#fff
    style Keep fill:#7F8C8D,stroke:#16A085,color:#fff
    style Deliver fill:#2C3E50,stroke:#16A085,color:#fff

Figure 257.6: SocialCast protocol flowchart showing message creation, utility comparison, and forwarding decisions.

Key Properties:

  • Bounded replicas: Only gamma copies exist (doesn’t grow like epidemic)
  • Selective forwarding: Only to higher-utility nodes
  • Upgrade path: Replicas “climb” to better carriers over time
  • Subscriber participation: Subscribers with high utility can act as carriers

257.4.3 SocialCast Performance

Delivery vs Replicas:

%% fig-alt: "Line chart showing SocialCast delivery ratio increasing with number of replicas gamma, starting at 70% with 1 replica, rising to 88% at 5 replicas, 93% at 10 replicas, and plateauing at 95% with 20 replicas, demonstrating diminishing returns beyond 10 replicas"
%%{init: {'theme': 'base', 'themeVariables': { 'primaryColor': '#2C3E50', 'primaryTextColor': '#fff', 'primaryBorderColor': '#16A085', 'lineColor': '#16A085', 'secondaryColor': '#E67E22', 'tertiaryColor': '#7F8C8D', 'fontSize': '16px'}}}%%
xychart-beta
    title "Delivery Ratio vs Number of Replicas (γ)"
    x-axis [1, 3, 5, 7, 10, 15, 20]
    y-axis "Delivery %" 60 --> 100
    line [70, 80, 88, 91, 93, 94, 95]

Figure 257.7: Line chart showing SocialCast delivery ratio increasing with number of replicas.

Overhead vs Replicas:

%% fig-alt: "Line chart showing SocialCast network overhead increasing with replicas gamma from 120% overhead with 1 replica, to 250% at 5 replicas, 350% at 10 replicas, and 480% at 20 replicas, demonstrating linear growth in resource consumption with increased replication"
%%{init: {'theme': 'base', 'themeVariables': { 'primaryColor': '#2C3E50', 'primaryTextColor': '#fff', 'primaryBorderColor': '#16A085', 'lineColor': '#16A085', 'secondaryColor': '#E67E22', 'tertiaryColor': '#7F8C8D', 'fontSize': '16px'}}}%%
xychart-beta
    title "Network Overhead vs Number of Replicas (γ)"
    x-axis [1, 3, 5, 7, 10, 15, 20]
    y-axis "Overhead %" 100 --> 500
    line [120, 180, 250, 300, 350, 420, 480]

Figure 257.8: Line chart showing SocialCast network overhead increasing with replicas.

Optimal Configuration: - gamma = 5-10 for most scenarios - Balance: 88-93% delivery with 200-350% overhead - Compare to epidemic: 95% delivery with 800-1200% overhead

TTL Impact:

%% fig-alt: "Line chart showing SocialCast delivery ratio improving with longer TTL values from 55% at 1 hour, 75% at 6 hours, 85% at 12 hours, 90% at 24 hours, 92% at 48 hours, and 93% at 72 hours, demonstrating that longer message lifetime improves delivery probability"
%%{init: {'theme': 'base', 'themeVariables': { 'primaryColor': '#2C3E50', 'primaryTextColor': '#fff', 'primaryBorderColor': '#16A085', 'lineColor': '#16A085', 'secondaryColor': '#E67E22', 'tertiaryColor': '#7F8C8D', 'fontSize': '16px'}}}%%
xychart-beta
    title "Delivery Ratio vs TTL (Time-To-Live)"
    x-axis ["1h", "6h", "12h", "24h", "48h", "72h"]
    y-axis "Delivery %" 50 --> 100
    line [55, 75, 85, 90, 92, 93]

Figure 257.9: Line chart showing SocialCast delivery ratio improving with longer TTL values.
NoteWorked Example: SocialCast Utility Function Calculation

Scenario: A smart city deploys sensors on delivery vehicles for air quality monitoring. Calculate which vehicle should carry pollution alerts to city hall.

Given: - Vehicle A: Delivers to suburbs, encounters city hall area 1x/week - Vehicle B: Downtown route, passes city hall 3x/day - Vehicle C: Mixed route, passes city hall 1x/day - Current carrier: Vehicle A (utility U_A = 0.15) - Message: PM2.5 alert for city hall environmental office

Steps: 1. Calculate utility for each vehicle: - Utility formula: U(X, Dest) = alpha x P_encounter + beta x Freshness + gamma x Battery - Weights: alpha=0.6 (encounter probability), beta=0.3 (data freshness), gamma=0.1 (resources)

  1. Compute encounter probabilities:
    • P_A = 1/week = 0.14/day: U_encounter_A = 0.14
    • P_B = 3/day = 3.0/day: U_encounter_B = min(1.0, 3.0) = 1.0
    • P_C = 1/day = 1.0/day: U_encounter_C = 1.0
  2. Calculate total utilities:
    • U_A = 0.6(0.14) + 0.3(0.9) + 0.1(0.8) = 0.08 + 0.27 + 0.08 = 0.43
    • U_B = 0.6(1.0) + 0.3(0.7) + 0.1(0.9) = 0.60 + 0.21 + 0.09 = 0.90
    • U_C = 0.6(1.0) + 0.3(0.8) + 0.1(0.7) = 0.60 + 0.24 + 0.07 = 0.91
  3. Apply SocialCast forwarding rule:
    • Current: U_A = 0.43
    • Vehicle A encounters B: U_B (0.90) > U_A (0.43): Forward to B
    • Vehicle A encounters C: U_C (0.91) > U_A (0.43): Forward to C
    • Both B and C are “better carriers” - forward to whichever encountered first

Result: Message forwarded from Vehicle A to Vehicle B (or C), increasing delivery probability from 14% to 100% per day.

Key Insight: SocialCast’s “utility climbing” ensures messages naturally flow toward nodes with better access to the destination. The delivery vehicle example shows how urban mobility patterns create predictable utility scores that SocialCast can exploit.

257.5 SocialCast Advantages for IoT

Why SocialCast Works Well:

  1. Interest-based grouping: IoT devices often have natural clusters

    • Smart home devices in same household
    • Wearables owned by same person
    • Sensors monitoring same phenomenon
  2. Predictable mobility: Many IoT devices follow patterns

    • Wearables: user’s daily routine
    • Vehicles: repeated routes
    • Drones: scheduled flight paths
  3. Resource efficiency: Bounded replication suits energy-constrained IoT

  4. Scalability: Local utility decisions scale better than global knowledge

Example IoT Applications:

  • Smart city: Traffic sensors publish updates, delivered to vehicles in area
  • Wildlife monitoring: Animal-attached sensors exchange data via high-mobility carriers (birds?)
  • Wearable health: Health data from many users aggregated via mobile phone carriers

257.6 Knowledge Check

Question: In epidemic routing for DTN, a message with 100KB size spreads to 50% of 64 nodes. How much total network bandwidth is consumed?

Explanation: Epidemic routing replicates messages to every encountered node. If 50% of 64 nodes = 32 nodes have the message, network transmitted 32 copies x 100KB = 3.2MB total. Message propagation: Source to Node1 (100KB), Source to Node2 (100KB), Node1 to Node3 (100KB), etc. Trade-off: High delivery probability (redundancy) but massive bandwidth/storage cost. Optimization: Time-to-live (TTL) limits hops, probabilistic forwarding (50% chance) reduces copies, spray-and-wait (limit to L copies). Real world: Wildlife tracking tolerates this overhead for guaranteed delivery, but urban IoT needs more efficient DTN routing like context-aware or social-based forwarding.

257.8 Summary

This chapter covered context-aware and social-based DTN routing:

  • Context-Aware Routing (CAR): Uses utility functions combining colocation probability, mobility patterns, social relationships, and resources to make intelligent forwarding decisions, reducing overhead to 200-350% while maintaining 88-93% delivery
  • Utility Function Design: The formula U(X, D) = alpha * P_colocation + beta * Mobility + gamma * Resources provides a mathematical framework for carrier selection
  • Colocation Prediction: Kalman filters use past encounter history to predict future contact probabilities, enabling “smart” forwarding
  • SocialCast Protocol: Creates bounded gamma replicas that “climb” to higher-utility carriers over time, exploiting social network structures for publish-subscribe in DTN
  • Performance Optimization: gamma = 5-10 replicas typically achieves 88-93% delivery with 200-350% overhead, compared to epidemic’s 95% delivery with 800-1200% overhead
  • IoT Suitability: SocialCast works well for IoT due to natural device clustering, predictable mobility patterns, resource efficiency, and local decision scalability

257.9 What’s Next

The next chapter explores DTN Applications, covering real-world deployments including wildlife tracking (ZebraNet), rural connectivity (DakNet), military tactical networks, and hybrid infrastructure-DTN systems.