Smart cities can achieve security insights without surveillance by using edge analytics. Instead of streaming raw video to the cloud, smart cameras process video locally and transmit only anonymized metadata (people counts, traffic flow) while keeping faces and identities private.
This approach reduces bandwidth by 99.75% (15 Mbps to 38 Kbps), eliminates privacy risks from cloud storage, and ensures GDPR compliance. For technical details and real-world case studies, see Edge Analytics: Security Without Surveillance in the Privacy chapter.
Key benefits: Raw video stays local, only aggregate statistics shared, same insights without identifying individuals.
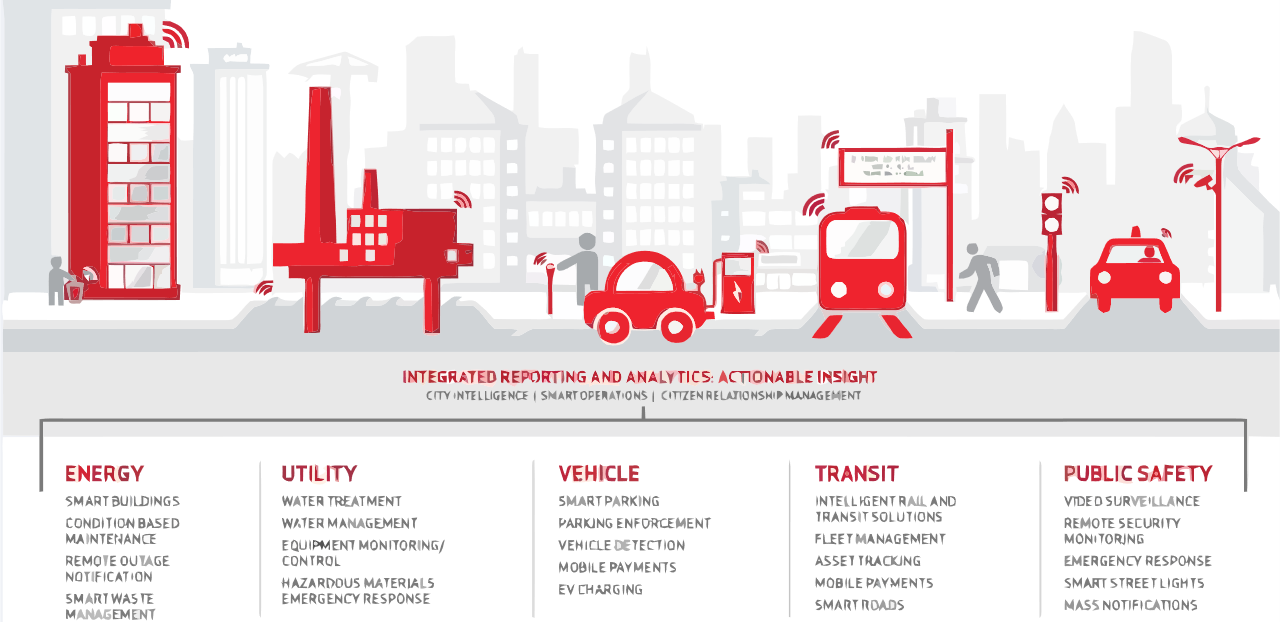
Integrated Smart Cities
Figure 133.1: Integrated smart city operations dashboard showing how mobility, utilities, and civic services share IoT data across a smart city.
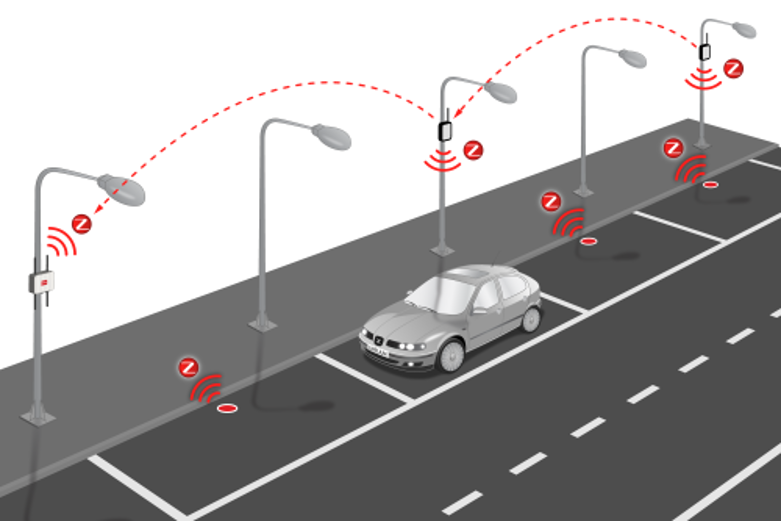
Smart Street Parking
Figure 133.2: Smart parking guidance combines real-time occupancy sensing with citizen mobile apps to reduce congestion.
Smart Street Lights
Figure 133.3: Adaptive LED street lighting dims or brightens in response to pedestrians and vehicles.
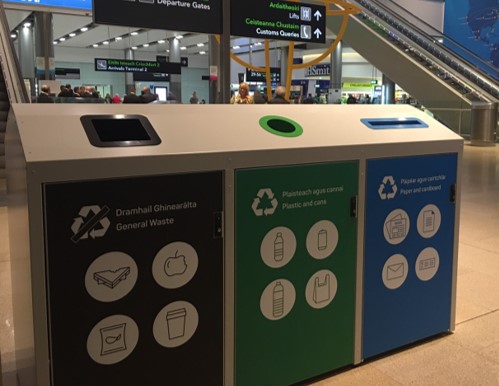
Smart Waste Collection
Figure 133.4: Smart waste collection uses fill-level telemetry to dispatch crews only when bins require service.
133.4 Smart City Multi-Domain Architecture
Graph diagram
Figure 133.5: Smart city IoT architecture diagram showing how sensors across transportation, energy, environment, and public safety domains connect through a unified platform to enable cross-domain analytics and citizen services.
133.5 Smart Parking Systems
Smart Parking Network Architecture:
Smart Parking Mesh Network
Figure 133.6: Smart parking mesh network architecture showing in-ground magnetic sensors forming a Zigbee mesh network connecting to LoRaWAN gateways on street lights, with cloud analytics providing real-time availability, dynamic pricing, and mobile app integration for drivers.
Key Technologies and Metrics:
Component
Technology
Typical Performance
Sensors
Magnetic, ultrasonic, radar
99%+ vehicle detection accuracy
Network
LoRaWAN, NB-IoT, Zigbee mesh
5-10 year battery life
Data Rate
Status change events (~20/day/space)
<1 KB/day per sensor
Latency
Status update to app
<5 seconds
ROI Drivers
Reduced search time, increased turnover, enforcement
15-25% revenue increase
Impact Metrics: - Parking search time: Reduced from 20 minutes to 5 minutes average (75% reduction) - Congestion reduction: 30% of urban traffic is drivers searching for parking - Revenue increase: Dynamic pricing + better enforcement = 20-30% revenue lift - Emissions reduction: Fewer circling vehicles = measurable air quality improvement
133.6 Smart Street Lighting
Adaptive Lighting System Architecture:
Smart Street Lighting System
Figure 133.7: Smart street lighting system architecture showing LED poles with integrated sensors and DALI controllers, forming a LoRaWAN mesh network connecting to cloud-based city management platforms for adaptive dimming, energy monitoring, predictive maintenance, and multi-service infrastructure hosting.
Key Technologies and Metrics:
Component
Technology
Performance
Luminaires
LED with DALI/DALI-2 control
50-70% energy reduction vs HPS
Dimming
Adaptive based on motion, schedule, daylight
Additional 25-30% savings
Sensors
PIR motion, ambient light, power monitoring
Integrated in luminaire
Network
LoRaWAN, cellular, mesh
Controller per pole or segment
Multi-purpose
Environmental sensors, 5G small cells, cameras
Revenue from infrastructure sharing
ROI Calculation Example: - 10,000 streetlights converted to adaptive LED - Energy reduction: 60% (LED) + 25% (adaptive dimming) = 75% total - Baseline energy cost: $2M/year - Annual savings: $1.5M - Installation cost: $8M - Payback period: 5.3 years
133.7 Smart Waste Collection
Fill-Level Monitoring Architecture:
Smart Waste Collection System
Figure 133.8: Smart waste collection system showing ultrasonic fill-level sensors in bins, LoRaWAN connectivity to cloud platform, route optimization algorithm, and dynamic dispatch to collection vehicles.
Key Technologies and Metrics:
Component
Technology
Performance
Sensors
Ultrasonic (most common), load cells
+/- 5% fill-level accuracy
Power
Solar + battery
5+ year life, no maintenance
Network
LoRaWAN, NB-IoT
1-2 transmissions per day
Analytics
Fill-rate prediction, route optimization
20-40% collection reduction
Compacting Bins
Solar-powered compaction
5x capacity, fewer collections
Dublin Smart Bins Case Study: - 3,000 bins deployed across city center - 40% reduction in collection frequency - 25% reduction in overflow incidents - €3.2M annual savings in collection costs - ROI achieved in 18 months
133.8 Worked Example: Smart City Citizen Privacy Impact Assessment
Scenario: A mid-sized city (population 450,000) is deploying a comprehensive smart city platform integrating traffic cameras, environmental sensors, and public Wi-Fi. Privacy advocates are concerned about surveillance potential. The city must conduct a Privacy Impact Assessment (PIA) before deployment.
Given: - Traffic cameras: 850 at intersections for signal optimization - Environmental sensors: 200 air quality monitors at schools and parks - Public Wi-Fi: 75 hotspots in downtown and transit hubs - Potential data collection: Vehicle license plates, pedestrian counts, MAC addresses - Regulatory framework: State law requires PIA for municipal surveillance systems - Citizen survey: 67% support smart city initiatives IF privacy protected
Steps:
Inventory data collection capabilities:
Traffic cameras: License plate capture capable
Wi-Fi: MAC address collection for device counting
Environmental: No personal data (temperature, PM2.5, noise)
License plates: Edge processing only - count vehicles, classify types, delete image within 5 seconds
MAC addresses: Hash with rotating daily salt - enables counting without tracking
Pedestrian counts: Camera AI outputs count only, no video recording or storage
Data retention: 90-day rolling window for all aggregated data, then delete
Implement technical controls:
All cameras process on-device, stream only metadata to cloud
Wi-Fi access points randomize observer MAC to prevent reciprocal tracking
Environmental data is open by default (public dashboard)
Zero raw video or image storage in cloud infrastructure
Establish governance framework:
Independent Privacy Board with citizen representatives reviews quarterly
Annual third-party audit of data handling practices
Opt-out signage at Wi-Fi zones with instructions to disable probe requests
Published algorithm documentation for all AI processing
FOIA-accessible logs of any government data access requests
Result: PIA approved by State Privacy Office. Citizen approval increases from 67% to 81% after public education campaign explaining privacy protections. System captures traffic flow and air quality insights without storing any personally identifiable information.
Key Insight: Smart city privacy is not about avoiding data collection - it is about architectural decisions that make surveillance technically impossible. Edge processing, immediate data destruction, and aggregation-only outputs remove the capability for misuse regardless of future policy changes or security breaches.
133.9 Worked Example: Smart Waste Collection Route Optimization
Scenario: A city waste management department serves 125,000 households with weekly curbside collection using 18 collection trucks. Management wants to deploy IoT fill-level sensors on commercial dumpsters to optimize routes and reduce operating costs.
Given: - Commercial dumpsters: 2,400 across the city - Current collection schedule: Fixed 2x/week for all dumpsters - Average fill level at collection: 45% (many collected when nearly empty) - Truck operating cost: $185/hour (fuel, labor, maintenance) - Average route: 6 hours per day, 5 days per week - Fleet: 6 trucks dedicated to commercial collection - Sensor cost: $95/unit (ultrasonic) + $8/month connectivity
Steps:
Calculate current operating cost:
Annual truck-hours: 6 trucks x 6 hours x 260 days = 9,360 hours
Annual operating cost: 9,360 x $185 = $1,731,600
Collections per year: 2,400 dumpsters x 2/week x 52 weeks = 249,600 collections
Estimated time per collection: 8 minutes (unchanged)
Total collection time reduction: 35% fewer stops
Additional efficiency from optimized routing: 15%
Combined reduction: ~45% of current operating hours
Calculate annual savings:
Reduced truck-hours: 9,360 x 0.45 = 4,212 hours saved
Operating cost savings: 4,212 x $185 = $779,220/year
Truck reduction possible: 2-3 trucks (capital and maintenance savings)
Additional truck savings: ~$150,000/year (2 trucks x lease/maintenance)
Total annual savings: $929,220
Calculate IoT system cost:
Sensor deployment: 2,400 x $95 = $228,000 (one-time)
Annual connectivity: 2,400 x $8 x 12 = $230,400
Software platform: $50,000/year
Total Year 1 cost: $508,400
Annual recurring: $280,400
Result: Smart waste collection system saves $649,000 annually after Year 1 (savings of $929,220 minus recurring costs of $280,400). Payback period: 6.6 months. Additional benefits include reduced overflow complaints (currently 340/year), lower fuel consumption (environmental), and improved service quality metrics.
Key Insight: Waste collection optimization ROI comes primarily from reducing truck operating hours, not from sensor sophistication. The 35% collection reduction directly translates to route consolidation and potential fleet reduction. Cities that optimize routes without IoT (using historical data) achieve ~15% improvement; IoT-enabled real-time optimization adds another 20-25% through dynamic threshold-based collection.
133.10 Smart City ROI Benchmarks
TipMVU: Smart City ROI Benchmarks
Core Concept: Smart city IoT projects deliver measurable returns across five domains: energy (30-50% reduction), water (15-25% reduction), waste (20-40% collection reduction), parking (15-25% revenue increase), and public safety (10-20% incident reduction). Why It Matters: Municipal budgets require quantifiable ROI for capital investments. Smart city projects competing for funding must demonstrate payback periods under 5 years to gain approval. The Barcelona case study ($232M annual savings) proves city-scale IoT delivers returns, but each domain must be evaluated independently. Key Takeaway: Start with the highest-ROI domains first (typically street lighting and parking) to generate savings that fund expansion into more complex domains (traffic management, public safety). Use proven vendor solutions in high-risk areas; innovate only where differentiation creates unique value.
Benchmark ROI by Domain:
Domain
Typical Investment
Annual Savings
Payback Period
Street Lighting
$800/luminaire
60-75% energy cost
4-6 years
Smart Parking
$150/space
20-30% revenue increase
2-3 years
Waste Collection
$100/bin
25-40% collection cost
1-2 years
Water Management
$50/meter
15-25% loss reduction
3-5 years
Traffic Management
$50,000/intersection
15-25% congestion reduction
5-8 years
133.11 Knowledge Check
Show code
{const container =document.getElementById('kc-usecase-smartcity');if (container &&typeof InlineKnowledgeCheck !=='undefined') { container.innerHTML=''; container.appendChild(InlineKnowledgeCheck.create({question:"A city deploys 850 traffic cameras with AI-based license plate recognition for traffic signal optimization. Privacy advocates are concerned about surveillance potential. Which architectural approach BEST addresses privacy while maintaining traffic optimization functionality?",options: [ {text:"Store all license plate data in an encrypted database with strict access controls",correct:false,feedback:"Encryption protects data in storage but doesn't address the surveillance capability. If the data exists, it can be accessed by insiders, subpoenaed, or breached. The architectural goal should be to avoid storing identifiable data in the first place."}, {text:"Process video at the edge, extract only vehicle counts and classifications, delete images within 5 seconds",correct:true,feedback:"Correct! Edge processing with immediate deletion makes surveillance technically impossible regardless of policy changes. Traffic signal optimization only needs aggregate vehicle flow data (counts, speeds, classifications), not individual vehicle identification. This 'privacy by architecture' approach eliminates the capability for misuse."}, {text:"Anonymize license plates by replacing characters with asterisks before storage",correct:false,feedback:"Partial anonymization (e.g., ABC*123) still allows re-identification through pattern matching and is considered pseudonymization, not anonymization. If any portion of the plate is stored, tracking remains possible."}, {text:"Allow citizens to opt-out by registering their license plates for exclusion",correct:false,feedback:"Opt-out systems are operationally complex and exclude only registered plates. More fundamentally, they don't address the capability for mass surveillance of non-opted-out vehicles. Architectural approaches are more robust than policy-based controls."} ],difficulty:"medium",topic:"iot-use-cases-smartcity" })); }}
133.12 Summary
Smart city IoT deployments demonstrate urban-scale IoT applications:
Multi-domain integration across parking, lighting, waste, and traffic
Privacy-preserving architecture uses edge processing and data minimization
ROI varies by domain: waste collection (1-2 years) to traffic management (5-8 years)
Privacy Impact Assessments are essential for citizen trust and regulatory compliance
Benchmarks: Street lighting (60-75% energy savings), parking (20-30% revenue increase), waste (25-40% collection reduction)
133.13 What’s Next
Continue exploring agricultural and vehicle IoT applications: