130IoT Use Cases: Elderly Fall Detection and Monitoring
130.1 Elderly Fall Detection: Saving Lives with Sensor Fusion
Time: ~12 min | Level: Intermediate | Unit: P03.C03.U06
130.2 Learning Objectives
By the end of this section, you will be able to:
Understand the elderly fall crisis and its economic impact
Design fall detection systems using sensor fusion
Calculate alert latency budgets for healthcare IoT
Implement comprehensive elderly monitoring with behavioral analytics
WarningThe Elderly Fall Crisis: Compelling Statistics
The Scale of the Problem:
Statistic
Value
Source
Americans 65+ who fall annually
1 in 4 (25%)
CDC
ER visits from falls
Every 11 seconds
National Council on Aging
Deaths from falls
Every 19 minutes (~27,000/year)
CDC
Fall-related ER visits/year
2.8 million
CDC Emergency Department data
Hospitalizations/year
800,000+
Often leading to long-term care
Economic cost (2015)
$50 billion
Direct medical costs
Projected cost (2020)
$67.7 billion
35% increase in 5 years
Medicare/Medicaid burden
75% of costs
Public healthcare systems
Why This Matters: One hip fracture costs $40,000+ in medical care and often leads to permanent loss of independence. Preventing a single fall pays for years of IoT monitoring.
130.3 Fall Detection System Architecture
Modern fall detection systems combine wearable accelerometers/gyroscopes with ambient sensors to distinguish true falls from normal activities:
Flowchart diagram
Figure 130.1: Elderly fall detection IoT system architecture showing wearable sensors (accelerometer, gyroscope) detecting sudden acceleration and orientation changes, edge ML distinguishing falls from normal activities, and alert cascade to family and emergency services.
Key Sensors and Detection Logic:
Sensor
Measurement
Fall Signature
Normal Activity (Ignore)
3-axis Accelerometer
Impact force, free-fall
>3g impact + 0g free-fall >0.5s
Sitting down (<2g), fast walking
3-axis Gyroscope
Body orientation change
>90 degrees rotation in <1s
Bending over, lying down gradually
Pressure Sensor
Ground contact
Sudden floor contact
Walking, standing
Heart Rate Monitor
Stress response
Elevated HR post-impact
Exercise, normal activity
GPS/Indoor Location
Positioning
Precise fall location
Movement tracking
The Machine Learning Challenge: Distinguishing true falls from false positives (sitting down hard, dropping phone) requires training on thousands of labeled examples. Commercial systems achieve 95%+ accuracy but still generate ~5% false alarms.
Real-World Deployment Example:
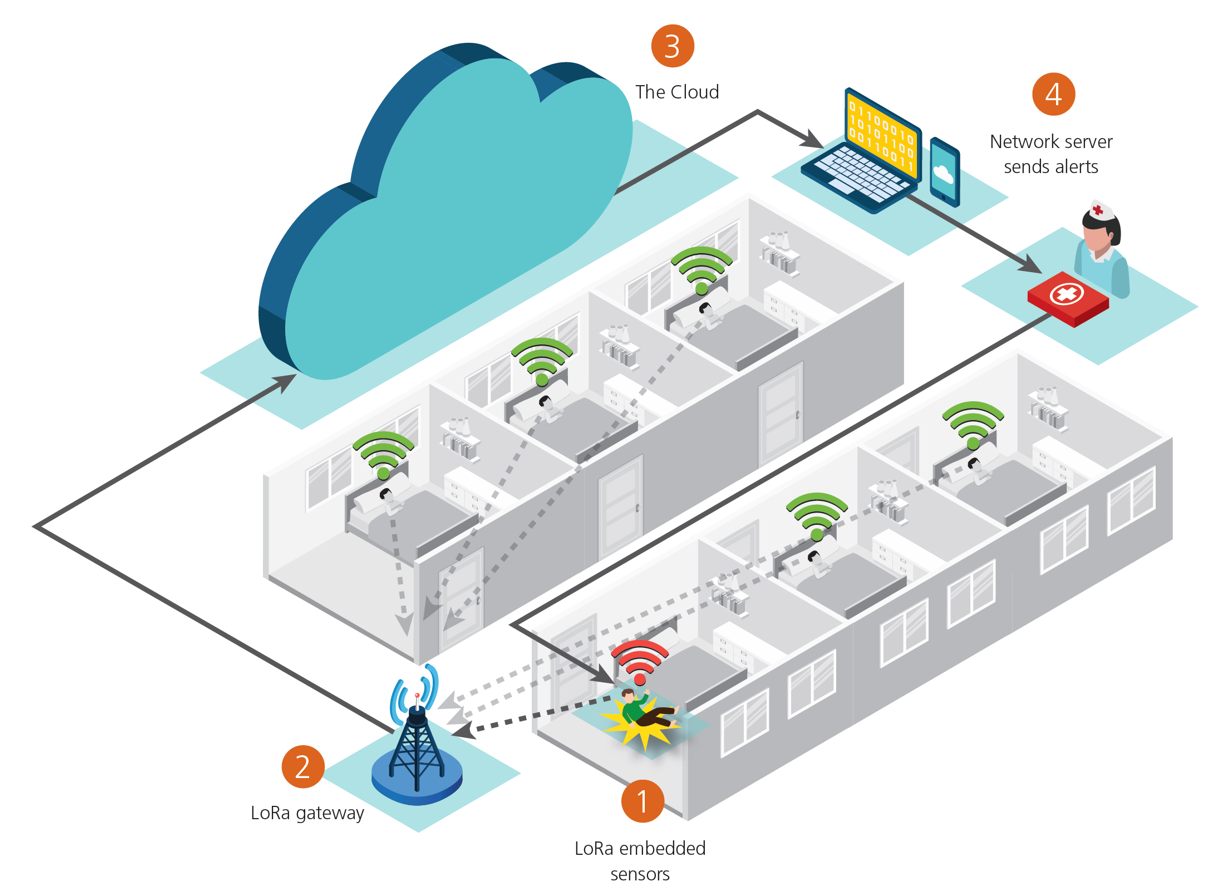
Elderly Fall Detection System
Figure 130.2: Elderly fall detection system showing wearable accelerometer/gyroscope sensors transmitting via LoRaWAN to gateway, cloud ML analytics distinguishing falls from normal activities, and automated alert cascade to wearer, family, and emergency services with precise location data.
Why LoRaWAN for Fall Detection? - Long range: Single gateway covers entire nursing home or neighborhood - Low power: Wearable batteries last 6-12 months - Penetration: Works indoors through walls and floors - Cost: No cellular subscription fees
130.4 Worked Example: Fall Detection Alert Latency Budget
Scenario: A home healthcare provider is deploying IoT fall detection wearables for 500 elderly patients living independently. The system must detect falls and dispatch emergency services within clinically acceptable timeframes to prevent serious injury escalation.
Given: - Clinical requirement: Emergency response within 15 minutes of fall (CDC guideline for reducing serious injury) - Device classification: FDA Class II medical device (requires 510(k) clearance) - Target false positive rate: Less than 5% to avoid alert fatigue - Wearable sensor sampling rate: 50 Hz accelerometer + gyroscope - Edge processing capability: 100 MIPS microcontroller - Network options: BLE to smartphone gateway, cellular backup - Patient population: 65-85 years, 30% have mild cognitive impairment
Steps:
Calculate total latency budget: 15 minutes total response = 900 seconds. Subtract EMS response time (8 minutes average) = 420 seconds remaining for detection + notification chain.
Allocate detection latency: Fall event duration is 0.5-2 seconds. Edge ML inference requires 50-100ms. Allow 5 seconds for fall confirmation (distinguish from sitting down quickly). Total detection: 5.1 seconds.
Allocate notification latency: BLE transmission to gateway: 100ms. Gateway processing: 200ms. Cellular transmission to cloud: 500ms. Cloud alert generation: 300ms. Push notification to caregiver app: 1 second. Total notification: 2.1 seconds.
Calculate caregiver response window: 420 - 5.1 - 2.1 = 412.8 seconds (6.9 minutes) for caregiver to attempt contact before auto-escalation to 911.
Design alert cascade:
T+0: Fall detected, patient prompted to cancel false alarm (30 seconds)
T+30s: If no response, alert sent to primary caregiver
T+3min: If caregiver doesn’t acknowledge, escalate to secondary caregiver
T+5min: If no acknowledgment, auto-dispatch to 911 with GPS coordinates
Result: System achieves 7.2-second detection-to-notification latency, leaving 6.9 minutes for human intervention before automatic emergency dispatch, meeting the 15-minute clinical response window with 43% safety margin.
Key Insight: Healthcare IoT systems must design explicit latency budgets working backward from clinical outcome requirements, not forward from technical capabilities. The FDA Class II designation requires documented evidence that the device meets its intended use claims, making latency budget documentation essential for regulatory submission.
130.5 Knowledge Check
Show code
{const container =document.getElementById('kc-usecase-elderly');if (container &&typeof InlineKnowledgeCheck !=='undefined') { container.innerHTML=''; container.appendChild(InlineKnowledgeCheck.create({question:"A home healthcare provider deploys fall detection wearables for elderly patients. The clinical requirement is emergency response within 15 minutes of a fall. If EMS response averages 8 minutes and the detection-to-notification chain takes 7 seconds, how much time remains for caregiver intervention before auto-escalating to 911?",options: [ {text:"15 minutes - the full clinical window",correct:false,feedback:"The 15-minute window must account for EMS response time (8 min) and detection latency (7 sec). Available time = 15 min - 8 min - 7 sec = ~7 minutes for caregiver response."}, {text:"About 7 minutes for graduated caregiver alerts",correct:true,feedback:"Correct! Working backward: 15 min total - 8 min EMS response - 7 sec detection = 6.9 minutes for caregiver intervention cascade. A well-designed system uses this time for: patient cancel button (30 sec) -> primary caregiver alert (3 min) -> secondary caregiver (5 min) -> auto-911 dispatch with GPS coordinates."}, {text:"8 minutes - matching the EMS response time",correct:false,feedback:"The EMS response time (8 min) is already committed. The caregiver window is what remains after subtracting both EMS response and detection latency from the 15-minute clinical requirement."}, {text:"Cannot calculate without knowing the patient's location",correct:false,feedback:"The calculation uses average EMS response time. For rural areas with longer EMS response, the caregiver window shrinks accordingly - which is why many rural deployments auto-dispatch 911 more aggressively."} ],difficulty:"medium",topic:"iot-use-cases-elderly" })); }}
130.6 Comprehensive Elderly Monitoring System Architecture
Beyond fall detection alone, comprehensive elderly monitoring systems integrate multiple physiological and environmental sensors to create a complete picture of senior health and safety:
Comprehensive Elderly Monitoring
Figure 130.3: Comprehensive elderly monitoring system integrating wearable sensors (fall detection, heart rate, blood pressure), ambient home sensors (motion, door/window, bed occupancy), and environmental monitors (temperature, water usage) connected via gateway to cloud analytics, providing alerts to individual, family caregivers, healthcare providers, and emergency services.
Multi-Modal Sensor Integration for Elderly Care:
Sensor Category
Specific Sensors
Data Collected
Clinical Value
Wearable Physiological
Smartwatch/pendant with accelerometer, gyroscope, PPG
Fall events, heart rate, activity level, sleep quality
Fall detection, cardiovascular monitoring, activity decline
130.7 Behavioral Pattern Analytics: From Raw Sensors to Clinical Insights
Modern elderly monitoring systems don’t just collect data - they use machine learning to detect subtle changes that predict health decline:
Flowchart diagram
Figure 130.4: Elderly monitoring behavioral analytics pipeline showing raw sensor data flowing through pattern detection algorithms to generate clinical insights for proactive intervention.
Real-World Detection Scenarios:
Behavioral Change Detected
Sensor Pattern
Potential Health Issue
Intervention Trigger
Reduced kitchen activity
50% fewer fridge opens, 70% less cooking time
Depression, physical decline, cognitive issues
Family check-in, meal service referral
Increased nighttime bathroom trips
3x/night -> 7x/night over 2 weeks
UTI, diabetes, prostate issues, medication side effect
Schedule doctor visit, urinalysis
Delayed morning routine
Out of bed 2 hours later than baseline
Depression, medication side effects, physical pain
Wellness call, medication review
Reduced outdoor activity
GPS shows no outdoor trips for 5 days
Social isolation, mobility issues, fear of falling
Schedule social engagement, physical therapy
Irregular sleep patterns
Bed occupancy: 3am-11am instead of 10pm-7am
Circadian disruption, medication issues, pain
Sleep study referral, medication timing adjustment
Wandering behavior
Door sensors: 2am exits, confused returns
Dementia progression, sundowning
Increase supervision, consider memory care
TipCase Study: Preventing Hospitalization Through Pattern Detection
Scenario: 78-year-old woman with hypertension and mild cognitive impairment lives alone.
Baseline Normal Pattern: - Morning routine: Out of bed 7:30am, kitchen activity 8am, medication taken 8:15am - Daily steps: 3,500-4,500 - Bathroom visits: 5-6x/day - Sleep: 10:30pm-7:30am (9 hours) - Medication adherence: 98%
Week 1-2 Subtle Changes Detected: - Morning routine delayed 45 minutes - Daily steps declined to 2,800 average (-32%) - Kitchen activity reduced 40% - Medication adherence dropped to 85% (2 missed doses) - Bathroom visits increased to 8-9x/day
Intervention (Day 15): - Family caregiver alerted via app: “Mom’s activity down 30%, possible health concern” - Daughter visits, discovers Mom has painful knee limiting mobility - Doctor visit scheduled, knee arthritis diagnosed and treated - Physical therapy prescribed, medication optimized
Outcome: - Without IoT monitoring: Gradual decline continues, eventual fall -> hip fracture -> hospitalization ($40,000+ cost, possible long-term care placement) - With IoT early detection: $500 doctor visit + $800 physical therapy = $1,300 intervention prevents $40,000+ hospitalization - ROI: 30x return on IoT monitoring investment
Key Insight: The system didn’t detect a single dramatic event - it caught a subtle 2-week behavioral pattern that human observers would miss until a crisis occurred.
130.8 The Business Case for Elderly IoT
ImportantCompelling Statistics
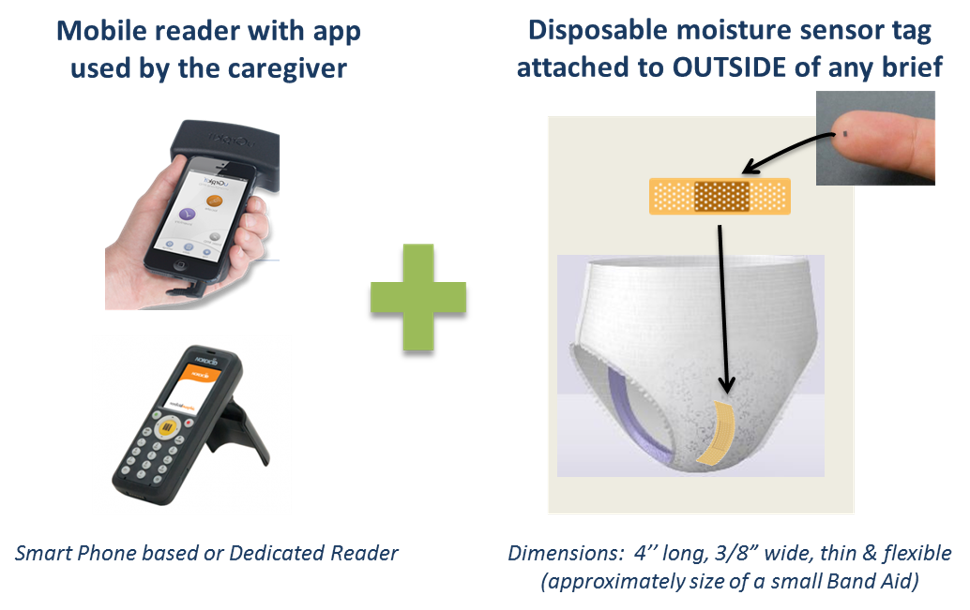
Incontinence Management in Long-Term Care: - 40-60% of nursing home residents suffer from urinary incontinence - Traditional manual checks every 2-4 hours miss many incidents - Delayed detection leads to skin breakdown, infections, and dignity concerns - Smart diaper solutions enable real-time remote monitoring
Why IoT Matters Here: 1. Early Detection: Wearables detect falls within seconds vs. hours for unmonitored seniors 2. Predictive Analytics: Gait analysis can predict fall risk days in advance 3. Dignity Preservation: Remote monitoring reduces invasive manual checks 4. Cost Reduction: Preventing one hip fracture ($40,000+) pays for years of monitoring 5. Independence: Seniors can age in place rather than moving to care facilities
The Business Model: Who Pays for Elderly IoT?
Stakeholder
Value Received
Payment Model
Market Example
Individual/Family
Peace of mind, prevent decline, age in place
$30-80/month subscription + hardware
Philips Lifeline, Medical Guardian
Health Insurance
Reduce hospitalizations, avoid long-term care costs
Cover as preventive care / value-based care incentive
Medicare Advantage plans
Assisted Living Facilities
Reduce staff burden, improve care quality, premium pricing
Since 2019, Medicare reimburses providers for elderly IoT monitoring under CPT codes: - 99453: Initial device setup ($19 per patient) - 99454: Device supply/daily recording ($62/month) - 99457: First 20 minutes of interactive communication ($51/month) - 99458: Additional 20 minutes ($41/month)
Total potential reimbursement: $173/month per patient for comprehensive monitoring program, making elderly IoT economically sustainable for healthcare providers.
130.9 Privacy and Autonomy Considerations
Elderly IoT systems must balance safety monitoring with dignity and independence:
Design Principle
Implementation
Why It Matters
Opt-In Monitoring
Senior controls what sensors are active and who receives data
Preserves autonomy, reduces feeling of surveillance
Transparent Alerts
Senior sees same alerts family receives (except emergency overrides)
Maintains trust, prevents infantilization
Override Capability
Disable sensors for visitors, privacy moments
Dignity preservation, prevent resistance to system
Data Minimization
Collect only what’s clinically necessary, auto-delete old data
HIPAA compliance, reduce privacy exposure
Local Processing First
Edge analytics for routine monitoring, cloud only for pattern analysis
Faster response, reduced network exposure
Graduated Response
Gentle patient nudges before family alerts before provider intervention
Preserves independence, reduces alarm fatigue
130.10 Summary
Elderly fall detection and comprehensive monitoring represent high-impact healthcare IoT applications:
$50 billion annual cost of falls makes prevention economically compelling