47 Lab: M2M Communication
Trace, Test, and Explain Machine-to-Machine Exchanges
47.1 Start Simple
Start with two machines that need to coordinate a job without waiting for a person to interpret every message. In Lab: M2M Communication, the practical question is what event, gateway boundary, fallback behavior, and evidence record make the exchange trustworthy.
47.2 Learning Objectives
By the end of this lab, you will be able to:
- Create a trace table for M2M exchanges across devices, gateway, message service, application, and operations view.
- Compare request/response and publish/subscribe behavior using observable records.
- Test device discovery and registration without relying on hardcoded device addresses.
- Show how buffering and replay preserve delayed events without making them look live.
- Check a protocol-translation mapping for units, quality markers, and provenance.
- Package lab results so another verifier can reproduce the conclusions.
47.3 M2M Labs Prove Meaning
An M2M lab is not finished when two machines exchange a payload. It is finished when the record shows what the message meant, who produced it, when it happened, how it was validated, where it was routed, and what decision was safe to make from it.
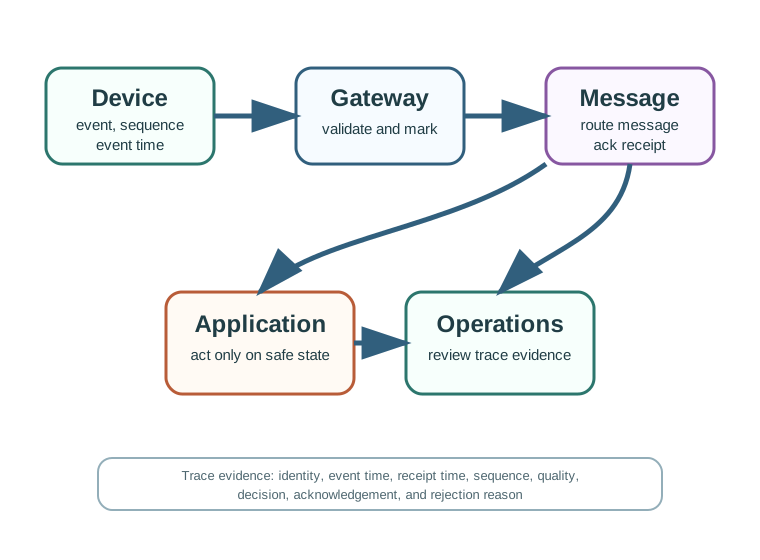
Mobile summary: A useful M2M lab proves identity, event time, receipt time, sequence, quality, acknowledgement, decision state, and rejection reasons across the whole path.
That is why this lab treats request/response, publish/subscribe, discovery, buffering, replay, and translation as evidence paths. Each path has to preserve identity, time, sequence, quality, acknowledgement, and rejection reasons.
47.4 M2M Record Packet
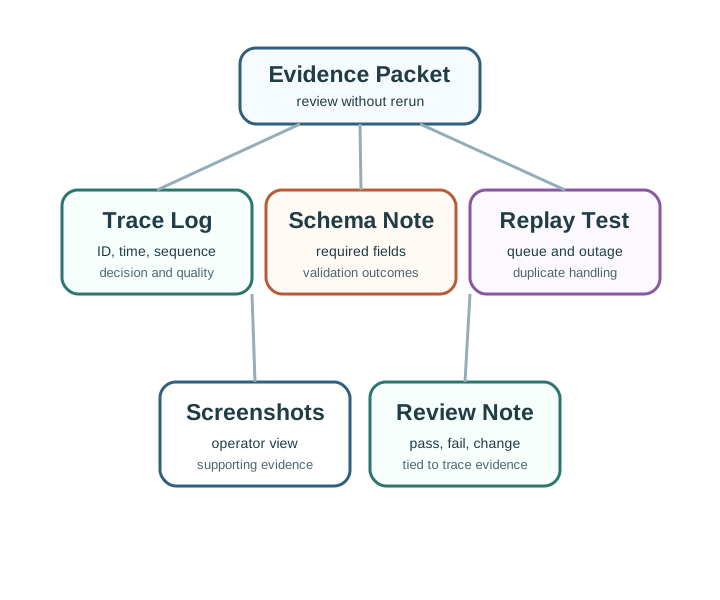
Keep one packet for each run: message contract, actor list, trace log, validation decisions, queue depth, replay order, translation map, screenshots only where useful, and the final decision note. The packet should let another reviewer explain the run without watching it live.
Include both a normal exchange and a degraded exchange. A good run proves the gateway can accept good messages, reject bad or expired messages, mark retained or replayed data, preserve original event time, and report enough state for operators to diagnose the fault boundary.
47.5 Freshness and Translation State
Freshness is not a display label. It comes from event time, receipt time, sequence, queue state, acknowledgement state, and duplicate handling. A replayed event can still be valuable, but only if the platform knows it is delayed rather than live.
Translation has the same hidden state. Raw addresses, units, scaling rules, schema versions, adapter firmware, and quality rules decide whether a downstream consumer receives a safe canonical value or a misleading one. The lab keeps those decisions visible.
47.6 Lab Setup
You can complete this lab with a physical board, a simulator, or a paper trace. The learning goal is the same in all three modes: produce records that the M2M path works and that degraded behavior is visible.
47.6.1 Device Role
Produces readings, accepts commands, or announces capabilities. It should have a stable identity and a clear message contract.
47.6.2 Gateway Role
Collects, validates, translates, buffers, replays, and exposes health records. It is the main verification boundary.
47.6.3 Verifier Role
Checks freshness, sequence, duplicate handling, rejection reasons, replay markers, and operator visibility.
47.6.4 Lab Materials
- A way to represent at least two devices, one gateway, and one downstream consumer.
- A trace log: spreadsheet, text table, notebook, or structured JSON lines.
- A message contract with required fields:
device_id,gateway_id,event_time,received_time,sequence,message_type,quality, andpayload. - A way to simulate one outage, duplicate, stale command, or bad translation.
47.7 Communication Trace Flow
Start by drawing the path. Keep the path small enough that every message can be inspected.
47.8 Part 1: Request/Response Trace
Request/response is useful when one machine asks another for a specific answer and the caller needs to know whether the exchange completed.
Run or simulate this sequence:
- Gateway sends
read_statetopump-controller-1. - Device replies with current state and sequence.
- Gateway records acknowledgement and receipt time.
- Application accepts the response only if the event is fresh and the command target still matches current state.
Trace fields to capture:
{
  "trace_id": "rr-001",
  "message_type": "response",
  "device_id": "pump-controller-1",
  "gateway_id": "site-gateway-1",
  "event_time": "2026-01-01T00:00:04Z",
  "received_time": "2026-01-01T00:00:05Z",
  "sequence": 42,
  "quality": "fresh",
  "payload": {
    "state": "running",
    "mode": "local_auto"
  }
}
Verifier checks:
- Is the response tied to the original request?
- Can a timeout be distinguished from a rejected command?
- Does the device state include enough context to avoid unsafe commands?
- Is the response recorded even when the application does not act on it?
47.9 Part 2: Publish/Subscribe Trace
Publish/subscribe is useful when producers should not know every consumer. The lab should prove routing behavior and freshness, not only that a message appears on a screen.
Run it: Instead of narrating the publish/subscribe steps on paper, drive the Publish/Subscribe Flow Workbench below. Start on the Telemetry fan-out scenario, type a topic like telemetry/temperature with a Payload, then press Publish and step the routing pills from Subscribe through Match to Fan-out to watch the event reach the dashboard and alert subscribers. Switch to the Retained snapshot scenario (or set the retain flag) and use the Late join stage to see whether a subscriber that joins late receives a retained last-known value or nothing, and check the Offline subscriber scenario against the Publish QoS cap. Mark each subscriber fresh, delayed, or retained in your trace below from what the workbench shows rather than from a guessed routing.
Run or simulate this sequence:
- Temperature device publishes
telemetry/temperature. - Gateway or broker routes the event to one dashboard subscriber and one alert subscriber.
- A second subscriber joins later and receives either no retained state or an explicitly retained last-known state, depending on your design.
- The verifier marks whether the displayed value is fresh, delayed, or retained.
A retained value can help a late subscriber learn the last known state, but it is not automatically current. Mark retained or replayed values so a dashboard does not confuse old records with live telemetry.
47.10 Part 3: Discovery and Registration
Discovery tests whether a new or replaced device can join without hidden manual assumptions.
Run it: Rather than assume how a device joins, register one in the LwM2M Device Lifecycle Workbench below. Pick a Security Binding (for example DTLS or TLS with PSK versus NoSec lab only) and a Transport Binding, then press Play and Step to walk the device from bootstrap through registration and watch the Stage, Operation, and State readouts change as the identity and capability assertions are admitted. Press Explain Risk to surface why a binding or firmware choice would push the device toward a rejected or quarantined outcome, then set Firmware Delivery to Download failure to force a fault. Use what the workbench shows to fill the discovery records below: identity assertion, capability summary, and the accept, reject, or quarantine decision.
Minimum discovery records:
- Device identity or enrollment assertion.
- Capability summary: measurements, commands, version, and required schedule.
- Gateway decision: accepted, rejected, or quarantined.
- Registry update with owner, group, schema version, and last-seen time.
- Operator-facing status explaining what changed.
47.10.1 Accept
The device identity is trusted, required fields are present, capabilities match policy, and the schedule is allowed.
47.10.2 Quarantine
The device may be real, but identity, firmware, mapping version, or capability assertions need checking before normal routing.
47.11 Part 4: Buffer and Replay
Every M2M lab should include at least one degraded path. Buffering and replay are where many demonstrations look successful but hide stale or duplicated data.
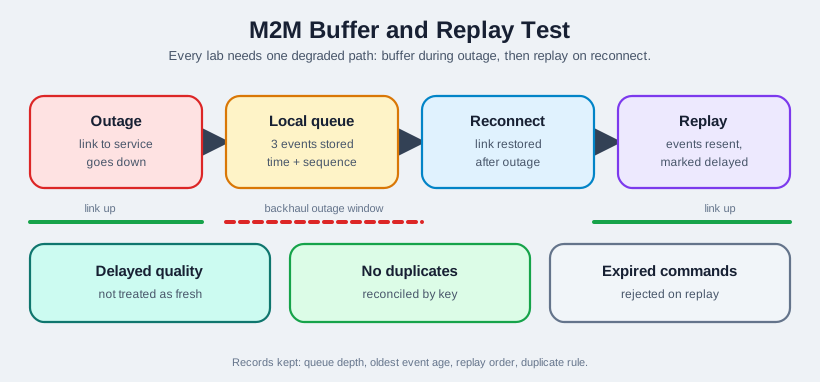
Run or simulate this sequence:
- Disconnect the gateway from the message service.
- Generate three device events while the link is down.
- Store each accepted event in a durable queue with event time and sequence.
- Reconnect and replay the events.
- Verify that the platform marks them as delayed and does not create duplicates.
- Reject any command that expired during the outage.
Records to keep:
- Queue depth at outage start, during outage, and after replay.
- Oldest queued event age.
- Replay order and acknowledgement result.
- Duplicate count and duplicate handling rule.
- Commands rejected due to expiry or stale target state.
47.12 Gateway Path and Rollout Diagnostics
Add one operational diagnostic run to the lab so the gateway path is traceable after the demonstration:
| Diagnostic | Records to keep | Check question |
|---|---|---|
| Gateway data path | Raw event, normalized message, queue write, upstream delivery, and platform record | Can another verifier trace one reading from device to platform? |
| Store-and-forward | Queue depth, oldest queued event, replay order, duplicate handling, and stale-command rejection | Does the design preserve event time and avoid hiding delayed data? |
| Remote snapshot | Signal state, power state, firmware version, reboot count, last error, last contact, and queue depth | Can support distinguish field, gateway, platform, and firmware faults? |
| Rollout gate | Candidate cohort, change version, acceptance checks, rollback trigger, and verified final state | Can the team update a subset without changing the whole fleet at once? |
47.13 Part 5: Protocol Translation Check
Protocol translation is not just converting bytes. The lab should prove that raw source values become traceable records.
Run it: Instead of reading the mapping YAML statically, run the M2M Gateway Protocol Translation animation below and press Play to watch a raw field-device message become a cloud-ready record through the translation stack. Compare the Mapping profile options – Semantic (units and identity preserved) against Raw tunnel (payload wrapped with minimal meaning) – and Step through to see which choice keeps units, canonical identity, and provenance versus which loses them. Set the Security boundary and add a Store-forward buffer or Retry attempts to see how the gateway records delivery, then read the source-protocol and translation-stack panels. Use those observations to answer the verifier checks below about canonical names, explicit scaling, preserved units, and recorded mapping version.
Translation mapping record:
source_protocol: fieldbus-adapter
source_address: register_40011
canonical_name: tank_level
unit: percent
scale: divide_by_10
quality_rule: reject_if_outside_0_to_100
schema_version: m2m.telemetry.v1
owner: site-operations
Verifier checks:
- Is the raw address mapped to a meaningful canonical name?
- Is the scaling rule explicit?
- Are units preserved?
- Does the gateway record the adapter and mapping version?
- Are invalid values rejected with a reason instead of silently normalized?
47.14 Lab Record Packet
Package the lab so another person can inspect it without watching the run live.
47.15 Example Trace Check
The following short trace is enough to demonstrate the verification style:
| Trace | Pattern | Result | Decision note |
|---|---|---|---|
rr-001 |
Request/response | Accepted | Response matched request, sequence advanced, value was fresh. |
ps-002 |
Publish/subscribe | Accepted with marker | Late subscriber received retained state, marked as retained. |
bf-003 |
Buffer/replay | Accepted with marker | Event replayed after outage with original event time and delayed quality. |
cmd-004 |
Command | Rejected | Command expired before reconnect and was not sent to the actuator. |
tr-005 |
Translation | Quarantined | Source address mapped to a value outside the allowed unit range. |
47.16 Lab Completion Checklist
Use this checklist before marking the lab complete:
- The trace covers request/response and publish/subscribe.
- Discovery or registration includes a gateway decision.
- Buffer/replay preserves original event time and sequence.
- Delayed or retained values are visibly marked.
- Duplicate handling is explicit and testable.
- Expired commands are rejected instead of replayed silently.
- Translation mappings include units, scaling, quality rules, and version.
- Rejected and quarantined events include reasons.
- Operator records distinguish fresh, delayed, rejected, offline, and local states.
- The record packet can be inspected without rerunning the lab.
47.17 Practice Checks
47.18 Common Mistakes
47.18.1 Treating a Screenshot as Proof
A screenshot can show a result, but it does not prove sequence, freshness, duplicate handling, or rejection reason. Keep the trace.
47.18.2 Skipping the Failure Case
Normal exchanges are not enough. Include at least one outage, duplicate, stale command, invalid value, or bad mapping.
47.18.3 Hiding Replayed Data
Replayed events should keep their original event time and receive a delayed quality marker. Do not rewrite them as live readings.
47.18.4 Making Translation Implicit
Raw addresses, scaling, and units need a mapping record. Otherwise the lab cannot prove what the gateway actually meant.
47.19 References and Further Reading
- OASIS MQTT specifications, for publish-subscribe delivery behavior, retained messages, and acknowledgements.
- IETF RFC 7252, The Constrained Application Protocol (CoAP), for constrained request-response behavior.
- OMA SpecWorks, Lightweight M2M Core Specification, for device management, registration, and observation patterns.
- oneM2M, Functional Architecture, for common service layer and gateway responsibilities.
47.20 Summary
This lab turns M2M communication from a demo into traceable records. Request/response proves targeted exchange. Publish/subscribe proves decoupled routing and freshness handling. Discovery proves that device admission is visible. Buffer and replay prove degraded behavior. Translation checks prove that raw source values become meaningful records with units, quality, and provenance. A good lab packet lets another verifier understand what happened without trusting a live demo.
47.21 Concept Relationships
- M2M communication defines the message path that this lab traces.
- M2M implementations define the gateway responsibilities that the lab tests.
- M2M design patterns explain why buffering, replay, validation, and command expiry matter.
- M2M labs and assessment expands this record style into broader rollout and diagnostic tasks.
47.22 What’s Next
| If you want to… | Read this |
|---|---|
| Practice broader assessment and rollout records | M2M Labs and Assessment |
| Revisit implementation responsibilities | M2M Implementations |
| Revisit design safeguards | M2M Design Patterns |
| Study the communication path | M2M Communication |
| Apply the pattern to case scenarios | M2M Case Studies |
47.23 Key Takeaway
An M2M lab should prove the end-to-end flow, including stale data, retries, bad payloads, disconnects, and command acknowledgment. Those failure paths are where production designs usually break.