Monitoring Claim
Name what must stay true: area trend, point alarm, structural condition, route state, wildlife count, or another bounded sensing result.
WSN energy management, wireless sensor network power budget, sensor node energy budget, WSN lifetime review, energy-aware routing, WSN harvesting evidence
Start with the battery as a schedule, not a number on a datasheet. Every sample, wake period, radio listen window, relay burden, retransmission, and maintenance visit spends part of that schedule, so energy management is really a record of what the node is allowed to do and how often.

Dividing rated capacity by average current, as if a milliamp-hour were a fixed coin that spends the same no matter how fast you spend it, is only an approximation. A real cell’s usable capacity shrinks a little faster than that at higher sustained current, because faster ion transport and reaction kinetics inside the cell waste some of the stored charge as heat rather than delivered current. This is Peukert’s law, and it means a relay node that carries traffic for its neighbours does not just lose life in proportion to its higher average current – it loses a bit more than that, and how much more depends on the cell chemistry the team picked.
Peukert’s law states that a fixed “Peukert capacity” \(C_p\) is conserved across discharge rates:
\[C_p = I^{k}\,t\]
where \(I\) is the sustained discharge current, \(t\) is the resulting runtime, and \(k \ge 1\) is the cell’s Peukert exponent (\(k=1\) would mean simple linear mAh division holds exactly). Given a reference operating point \((I_{ref}, t_{ref})\):
\[C_p = I_{ref}^{k}\,t_{ref}\]
Runtime at any other sustained current \(I\) follows by solving for \(t\):
\[t = \frac{C_p}{I^{k}} = t_{ref}\left(\frac{I_{ref}}{I}\right)^{k}\]
For \(k>1\), this predicts a shorter life than the naive linear estimate \(t_{ref}\,I_{ref}/I\) whenever \(I>I_{ref}\) – the higher the sustained current and the further \(k\) sits above 1, the bigger the gap.
WSN energy management is the evidence record that explains how a field network can keep sensing, forwarding, recovering, and being serviced for the promised monitoring period. It is not a single battery-life estimate. It is a claim about node states, traffic load, gateway paths, maintenance access, and what happens when conditions change.
The beginner mistake is to approve energy from a quiet-lab current number. A field node may spend energy on sensor warm-up, radio retries, receive windows, storage, clock repair, route changes, firmware updates, outage buffering, or recovery from weak links. The review has to preserve those states before it claims lifetime.
Use Figure 13.1 as the review route: the monitoring claim must stay connected to the measured state budget, dominant drain, load path, service margin, accepted limit, and retest trigger.
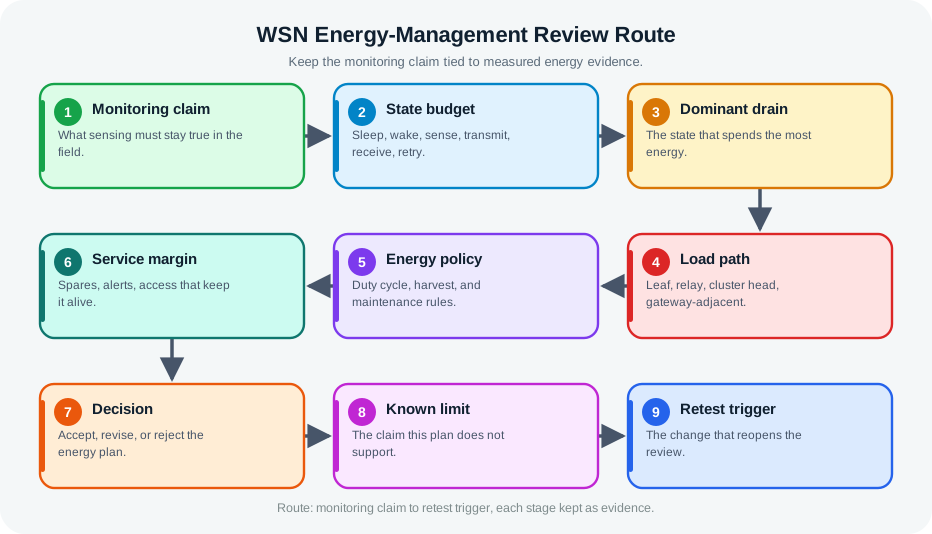
If you only need the intuition, this layer is enough: approve WSN energy only when the measured state budget, dominant drain, load path, service plan, known limit, owner, and retest trigger all support the monitoring claim.
Name what must stay true: area trend, point alarm, structural condition, route state, wildlife count, or another bounded sensing result.
Measure sleep, wake, sense, compute, transmit, receive, store, retry, recover, and update states in the deployed firmware and enclosure.
Separate leaf nodes, relays, cluster heads, gateway-adjacent nodes, event-heavy nodes, and any node that carries traffic for others.
Record how maintenance, alerts, spare parts, harvesting, fallback, and ownership keep the claim alive before weak nodes fail.
A practical energy record starts with the monitoring objective and then works backward through node states, traffic paths, service rules, and changes that reopen review. It should make the limiting condition visible instead of hiding it inside an average lifetime estimate.
Agricultural soil network: A soil network reports slow trends from battery nodes. Longer sleep intervals and local aggregation may be acceptable if missing readings stay visible and the dashboard decision tolerates delay. The record should include measured sensor warm-up, packet delivery, retry behavior, gateway outage buffering, service access after weather, and the lowest-margin node role.
Bridge monitoring: A bridge network may have a few relay nodes that carry traffic from hard-to-reach sensors. The practitioner record should review those relay roles separately from leaf nodes. If the relay fails first, the relevant lifetime is the relay service margin, not the average lifetime across all nodes.
Use Figure 13.2 to keep the accepted decision compact enough for retest after deployment changes.
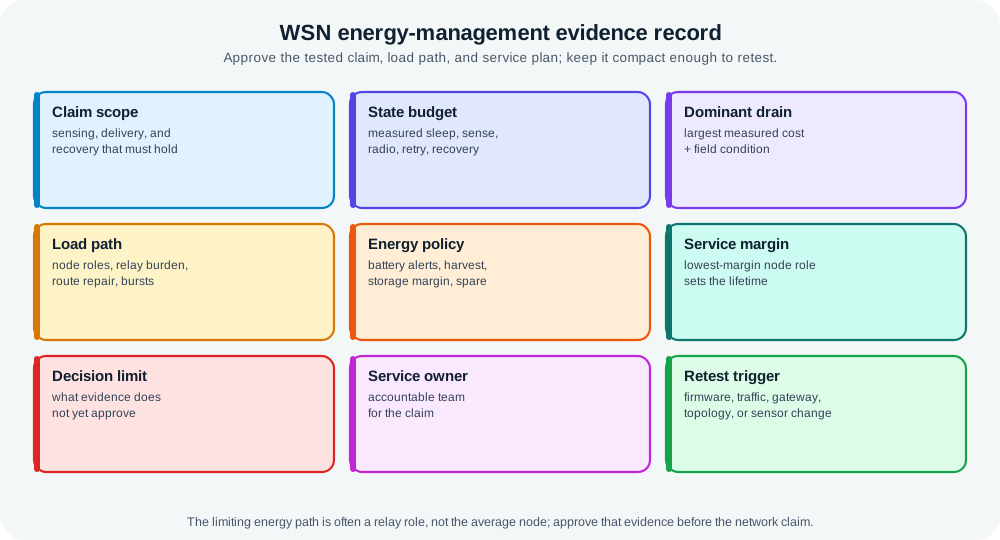
Energy evidence record template Monitoring claim: what sensing, delivery, and recovery behavior must remain true. State budget: measured sleep, sense, compute, radio, storage, retry, recovery, update, and maintenance states. Dominant drain: the largest measured contributor and the field condition that makes it dominant. Load path: node roles, relay burden, gateway-adjacent work, route repair, bursts, and downlink reachability. Service plan: battery alerts, harvesting source, storage margin, maintenance access, spare policy, owner, and fallback. Known limit: what the current evidence does not approve, such as fast alarms, harsh season, new topology, or longer service interval. Retest trigger: the exact firmware, traffic, gateway, topology, sensor, maintenance, harvesting, or application change that reopens review.
Under the hood, energy failures often appear when a rare or hidden state becomes common. A weak link can turn transmit into repeated receive and retry work. A gateway outage can turn normal reporting into buffering and replay. A brownout loop can spend more energy recovering than sensing. A firmware update can change every state in the budget.
The budget is only valid for the measured firmware, sensor warm-up, radio settings, storage behavior, wake sources, and return-to-sleep path.
Event bursts, downlink commands, diagnostics, commissioning, and firmware updates can change radio and receive-window costs.
Gateway movement, route repair, relay concentration, mobile sinks, and antenna changes can shift energy burden to a different node.
Alerts, harvesting, replacement access, support owner, and fallback behavior decide whether low-energy evidence becomes an operational failure.
Harvesting needs the same discipline. Solar, vibration, thermal, or flow sources can extend service life when the measured source, storage element, load profile, quiet period, cold-start behavior, and owner response match the claim. They should not be used as a blanket “maintenance-free” label.
Average-current arithmetic is useful only after the state sequence is honest. The review should multiply each measured state by how long and how often it occurs, then add transition costs such as sensor warm-up, radio association, clock repair, storage erase, retry backoff, and acknowledgement waiting. A tiny active interval can still dominate if it repeats after every failed packet or every wake cycle.
Recovery states are easy to miss because they happen after something has already gone wrong. Brownout restart, queue rebuild, route rediscovery, buffered upload, and drained-storage recovery can turn a good sleep budget into a bad field budget. A WSN energy claim should therefore say what the node does after low voltage, weak link, gateway outage, or missed acknowledgement, not only what it does during normal reporting.
Role boundaries matter as much as state boundaries. A leaf node, relay, cluster head, and gateway-adjacent node may run the same firmware but spend energy in different proportions. The under-the-hood evidence should keep those roles separate so the first failing relay is not hidden behind a comfortable fleet average.
The under-the-hood rule is to keep the limiting evidence visible. If an optimization saves energy by adding latency, aggregation, local thresholds, extra gateways, or service work, the review should say which claim remains valid and which claim is no longer approved.
Approve WSN energy management only when the measured node states, traffic load, routing roles, service margin, harvesting assumptions, owner, and retest triggers support the same bounded monitoring claim.
Connect energy decisions to data, control, coordination, gateway, buffering, and aggregation evidence.
Review sleep, wake, active-state, latency, and delivery-path choices that shape the energy budget.
Tie energy evidence to node counts, gateway placement, coverage assumptions, pilot sizing, and service access.
Review what coverage claim fails when an energy-limited node, relay, or gateway path degrades.