26 Lab: Build a Digital Twin
emerging-paradigms
digital
twins
lab
One of two parts on digital twin assessment and practice – the other is Digital Twin Concepts and Scenario Assessment. This part turns the sync-cycle diagram and bandwidth math into a hands-on ESP32 lab: wiring, a complete sketch, step-by-step instructions, challenge exercises, and production-readiness review.
| Direction | Chapter | Topic |
|---|---|---|
| Previous | Digital Twin Concepts and Scenario Assessment | Architecture concepts, quizzes, and scenario questions |
| Current | Lab: Build a Digital Twin | Hands-on ESP32 build with sync, history, prediction, and commands |
26.1 Digital Twin Synchronization Cycle
The following diagram illustrates the seven-step synchronization cycle implemented in the hands-on lab below. Each sync cycle reads physical sensors, mirrors state to the digital twin, records history, runs analytics, generates predictions, and executes commands back to the physical device.
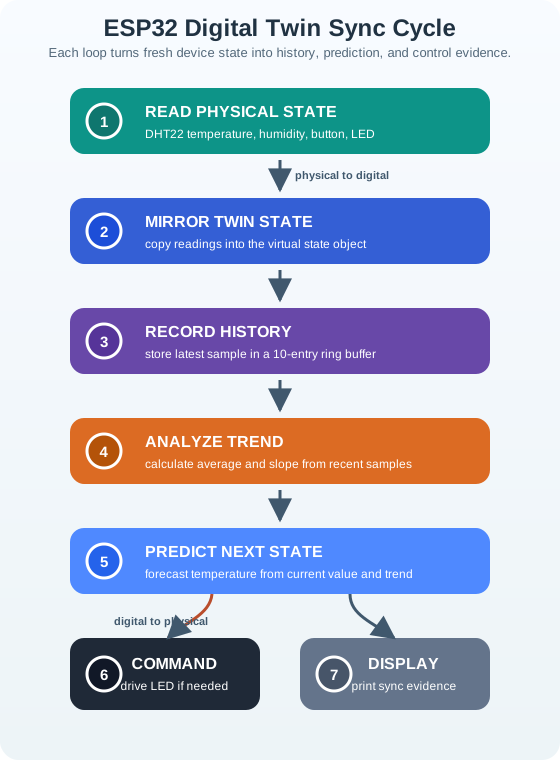
This cycle maps directly to the seven function calls inside performSyncCycle() in the lab code.
Putting Numbers to It
Synchronization interval directly sets telemetry bandwidth and storage growth.
\[ D_{day} = \frac{86400}{\Delta t}\times S \]
Where \(\Delta t\) is sync interval (seconds) and \(S\) is bytes per sync payload.
Worked example: If one twin syncs every 5 seconds with a 48-byte payload (state + metadata):
\[ \begin{aligned} \text{syncs/day} &= \frac{86400}{5} = 17{,}280\\ D_{day} &= 17{,}280\times 48 = 829{,}440\text{ bytes} \approx 0.79\text{ MB/day} \end{aligned} \]
For 500 devices, this becomes about \(0.79\times 500 = 395\) MB/day (about 11.8 GB/month), so sync cadence must be tuned to analytics value.
 Checkpoint: Evidence Before Hardware
You now know:
- A run record should connect the physical entity, sensor inputs, twin state, update interval, prediction rule, command intent, and actuator result.
- Sync cadence has a cost: a 5 seconds interval with a 48-byte payload creates 17,280 syncs/day and about 0.79 MB/day per device.
- The seven-step sync cycle below is not just code order; it is the evidence order you need when reviewing whether the twin stayed fit to use.
The next section builds that review trail in code. Keep the evidence record in mind as you wire the ESP32, because every serial line should answer one part of the control claim.
26.2 Lab: Build a Simple Digital Twin System
In this lab, you will build a functional digital twin system that demonstrates the core concepts of physical-digital synchronization, state mirroring, history tracking, and predictive analytics.
26.2.1 Learning Objectives
By completing this lab, you will be able to:
- Implement bidirectional state synchronization between physical and digital entities
- Create a circular buffer for state history tracking
- Build simple trend-based prediction algorithms
- Understand how physical sensor data mirrors into a digital twin
- Demonstrate how digital commands can control physical actuators
26.2.2 Components Required
- ESP32: Microcontroller and lab twin host. Wokwi part:
esp32. - DHT22: Temperature and humidity sensor. Wokwi part:
dht22. - Red LED: Physical actuator controlled by the twin. Wokwi part:
led. - Push button: Manual sync and LED-toggle input. Wokwi part:
pushbutton. - 10K resistor: Pull-down for the button. Wokwi part:
resistor. - 220 ohm resistor: LED current limiter. Wokwi part:
resistor.
26.2.3 Wokwi Simulator
Use Wokwi as an external workspace for the hardware simulation. This avoids fragile embedded iframe loading while keeping the lab runnable in a browser.
Open the Lab Workspace
- Open a new ESP32 project in Wokwi
- Add the ESP32, DHT22, red LED, push button, 10K resistor, and 220 ohm resistor.
- Paste the sketch below into
sketch.ino. - Start the simulation and open the Serial Monitor at
115200baud.
Wokwi Setup Instructions
- In the Wokwi editor, add components from the “+” menu: ESP32, DHT22, LED (red), Push Button, and resistors
- Wire the DHT22 data pin to GPIO 4
- Wire the LED (with 220 ohm resistor) to GPIO 2
- Wire the button (with 10K pull-down resistor) to GPIO 15
- Copy the code below into the editor
- Click the green play button to start simulation
26.2.4 Complete Arduino Code
Copy this code into the Wokwi editor:
/*
 * Digital Twin Demonstration - ESP32
 *
 * This program demonstrates core digital twin concepts:
 * 1. Physical State Monitoring - Reading sensors (temperature, button)
 * 2. Digital Twin State - Maintaining a virtual copy of device state
 * 3. Bidirectional Sync - Physical updates twin, twin controls LED
 * 4. State History - Circular buffer tracking past states
 * 5. Prediction - Simple trend analysis for forecasting
 *
 * Hardware: ESP32 + DHT22 + LED + Button
 */

#include <DHT.h>

// ============ PIN DEFINITIONS ============
#define DHT_PIN 4          // DHT22 data pin
#define LED_PIN 2          // LED output pin
#define BUTTON_PIN 15      // Button input pin
#define DHT_TYPE DHT22

// ============ DIGITAL TWIN CONFIGURATION ============
#define HISTORY_SIZE 10    // Circular buffer size for state history
#define SYNC_INTERVAL 2000 // Milliseconds between sync cycles
#define PREDICTION_HORIZON 3 // Predict N cycles ahead

// ============ DATA STRUCTURES ============

// Physical Device State - What the actual hardware reports
struct PhysicalState {
  float temperature;
  float humidity;
  bool buttonPressed;
  bool ledState;
  unsigned long timestamp;
};

// Digital Twin State - Virtual copy with additional metadata
struct DigitalTwin {
  // Mirrored physical state
  float temperature;
  float humidity;
  bool buttonPressed;
  bool ledState;

  // Twin-specific metadata
  unsigned long lastSyncTime;
  unsigned long syncCount;
  bool isOnline;
  float syncLatencyMs;

  // Derived analytics
  float avgTemperature;
  float tempTrend;           // Degrees per cycle (positive = rising)
  float predictedTemp;       // Forecasted temperature
  String healthStatus;

  // Alert thresholds (configurable from "cloud")
  float tempAlertHigh;
  float tempAlertLow;
};

// State History Entry
struct HistoryEntry {
  float temperature;
  float humidity;
  bool buttonState;
  unsigned long timestamp;
};

// ============ GLOBAL VARIABLES ============
DHT dht(DHT_PIN, DHT_TYPE);

PhysicalState physicalDevice;
DigitalTwin digitalTwin;
HistoryEntry stateHistory[HISTORY_SIZE];
int historyIndex = 0;
int historyCount = 0;

unsigned long lastSyncTime = 0;
unsigned long lastButtonTime = 0;
bool lastButtonState = false;

// ============ INITIALIZATION ============
void setup() {
  Serial.begin(115200);
  delay(1000);

  // Initialize hardware
  pinMode(LED_PIN, OUTPUT);
  pinMode(BUTTON_PIN, INPUT);
  dht.begin();

  // Initialize digital twin with defaults
  initializeDigitalTwin();

  Serial.println("\n========================================");
  Serial.println("   DIGITAL TWIN DEMONSTRATION");
  Serial.println("========================================");
  Serial.println("Physical Device: ESP32 + DHT22 + LED + Button");
  Serial.println("Digital Twin: Virtual state mirror with predictions");
  Serial.println("----------------------------------------");
  Serial.println("Press button to trigger manual sync");
  Serial.println("Watch temperature trends and predictions");
  Serial.println("========================================\n");
}

void initializeDigitalTwin() {
  digitalTwin.temperature = 0;
  digitalTwin.humidity = 0;
  digitalTwin.buttonPressed = false;
  digitalTwin.ledState = false;
  digitalTwin.lastSyncTime = 0;
  digitalTwin.syncCount = 0;
  digitalTwin.isOnline = true;
  digitalTwin.syncLatencyMs = 0;
  digitalTwin.avgTemperature = 0;
  digitalTwin.tempTrend = 0;
  digitalTwin.predictedTemp = 0;
  digitalTwin.healthStatus = "Initializing";
  digitalTwin.tempAlertHigh = 30.0;  // Alert if above 30C
  digitalTwin.tempAlertLow = 15.0;   // Alert if below 15C
}

// ============ MAIN LOOP ============
void loop() {
  // Check for button press (manual sync trigger)
  handleButtonInput();

  // Periodic synchronization cycle
  if (millis() - lastSyncTime >= SYNC_INTERVAL) {
    performSyncCycle();
    lastSyncTime = millis();
  }
}

// ============ BUTTON HANDLING ============
void handleButtonInput() {
  bool currentButton = digitalRead(BUTTON_PIN) == HIGH;

  // Debounce and detect press
  if (currentButton && !lastButtonState && (millis() - lastButtonTime > 200)) {
    lastButtonTime = millis();
    physicalDevice.buttonPressed = true;

    Serial.println("\n[PHYSICAL] Button pressed - Triggering immediate sync");

    // Button press toggles LED (bidirectional: physical input -> twin -> physical output)
    toggleLedFromTwin();
    performSyncCycle();
  } else {
    physicalDevice.buttonPressed = false;
  }

  lastButtonState = currentButton;
}

// ============ SYNCHRONIZATION CYCLE ============
void performSyncCycle() {
  unsigned long syncStart = millis();

  Serial.println("\n========== SYNC CYCLE ==========");

  // STEP 1: Read Physical State (Physical -> Digital)
  readPhysicalState();

  // STEP 2: Update Digital Twin (Mirror physical state)
  updateDigitalTwin();

  // STEP 3: Record History (Circular buffer)
  recordStateHistory();

  // STEP 4: Run Analytics (Twin-side processing)
  runTwinAnalytics();

  // STEP 5: Make Predictions (Forecasting)
  calculatePredictions();

  // STEP 6: Execute Twin Commands (Digital -> Physical)
  executeTwinCommands();

  // Calculate sync latency
  digitalTwin.syncLatencyMs = millis() - syncStart;
  digitalTwin.syncCount++;

  // STEP 7: Display Twin Status
  displayTwinStatus();
}

// ============ PHYSICAL STATE READING ============
void readPhysicalState() {
  Serial.println("[PHYSICAL] Reading sensor data...");

  // Read DHT22 sensor
  float temp = dht.readTemperature();
  float hum = dht.readHumidity();

  // Validate readings
  if (isnan(temp) || isnan(hum)) {
    Serial.println("[PHYSICAL] WARNING: Sensor read failed, using last known values");
    // Keep previous values if read fails
  } else {
    physicalDevice.temperature = temp;
    physicalDevice.humidity = hum;
  }

  physicalDevice.ledState = digitalRead(LED_PIN) == HIGH;
  physicalDevice.timestamp = millis();

  Serial.print("[PHYSICAL] Temp: ");
  Serial.print(physicalDevice.temperature, 1);
  Serial.print("C, Humidity: ");
  Serial.print(physicalDevice.humidity, 1);
  Serial.print("%, LED: ");
  Serial.println(physicalDevice.ledState ? "ON" : "OFF");
}

// ============ DIGITAL TWIN UPDATE ============
void updateDigitalTwin() {
  Serial.println("[TWIN] Synchronizing state from physical device...");

  // Mirror physical state to twin (Physical -> Digital sync)
  digitalTwin.temperature = physicalDevice.temperature;
  digitalTwin.humidity = physicalDevice.humidity;
  digitalTwin.buttonPressed = physicalDevice.buttonPressed;
  digitalTwin.ledState = physicalDevice.ledState;
  digitalTwin.lastSyncTime = millis();
  digitalTwin.isOnline = true;

  Serial.println("[TWIN] State synchronized successfully");
}

// ============ STATE HISTORY RECORDING ============
void recordStateHistory() {
  // Store current state in circular buffer
  stateHistory[historyIndex].temperature = physicalDevice.temperature;
  stateHistory[historyIndex].humidity = physicalDevice.humidity;
  stateHistory[historyIndex].buttonState = physicalDevice.buttonPressed;
  stateHistory[historyIndex].timestamp = millis();

  // Advance circular buffer index
  historyIndex = (historyIndex + 1) % HISTORY_SIZE;
  if (historyCount < HISTORY_SIZE) {
    historyCount++;
  }

  Serial.print("[HISTORY] Recorded state ");
  Serial.print(digitalTwin.syncCount);
  Serial.print(" (buffer: ");
  Serial.print(historyCount);
  Serial.print("/");
  Serial.print(HISTORY_SIZE);
  Serial.println(" entries)");
}

// ============ TWIN ANALYTICS ============
void runTwinAnalytics() {
  Serial.println("[ANALYTICS] Processing twin data...");

  // Calculate average temperature from history
  if (historyCount > 0) {
    float sum = 0;
    for (int i = 0; i < historyCount; i++) {
      sum += stateHistory[i].temperature;
    }
    digitalTwin.avgTemperature = sum / historyCount;
  }

  // Calculate temperature trend (simple linear regression)
  if (historyCount >= 3) {
    // Compare recent readings to determine trend
    int newestIdx = (historyIndex - 1 + HISTORY_SIZE) % HISTORY_SIZE;
    int olderIdx = (historyIndex - min(3, historyCount) + HISTORY_SIZE) % HISTORY_SIZE;

    float newestTemp = stateHistory[newestIdx].temperature;
    float olderTemp = stateHistory[olderIdx].temperature;
    int samples = min(3, historyCount);

    // Trend = change per cycle
    digitalTwin.tempTrend = (newestTemp - olderTemp) / samples;
  }

  // Determine health status based on thresholds
  if (physicalDevice.temperature > digitalTwin.tempAlertHigh) {
    digitalTwin.healthStatus = "WARNING: High Temp";
  } else if (physicalDevice.temperature < digitalTwin.tempAlertLow) {
    digitalTwin.healthStatus = "WARNING: Low Temp";
  } else if (abs(digitalTwin.tempTrend) > 0.5) {
    digitalTwin.healthStatus = "NOTICE: Rapid Change";
  } else {
    digitalTwin.healthStatus = "NORMAL";
  }

  Serial.print("[ANALYTICS] Avg Temp: ");
  Serial.print(digitalTwin.avgTemperature, 1);
  Serial.print("C, Trend: ");
  Serial.print(digitalTwin.tempTrend >= 0 ? "+" : "");
  Serial.print(digitalTwin.tempTrend, 2);
  Serial.println("C/cycle");
}

// ============ PREDICTION ENGINE ============
void calculatePredictions() {
  Serial.println("[PREDICTION] Forecasting future state...");

  // Simple linear extrapolation: predicted = current + (trend * horizon)
  digitalTwin.predictedTemp = digitalTwin.temperature +
                              (digitalTwin.tempTrend * PREDICTION_HORIZON);

  Serial.print("[PREDICTION] In ");
  Serial.print(PREDICTION_HORIZON);
  Serial.print(" cycles, predicted temp: ");
  Serial.print(digitalTwin.predictedTemp, 1);
  Serial.println("C");

  // Predictive alert: warn if prediction crosses threshold
  if (digitalTwin.predictedTemp > digitalTwin.tempAlertHigh &&
      digitalTwin.temperature <= digitalTwin.tempAlertHigh) {
    Serial.println("[PREDICTION] ALERT: Temperature predicted to exceed high threshold!");
  }
  if (digitalTwin.predictedTemp < digitalTwin.tempAlertLow &&
      digitalTwin.temperature >= digitalTwin.tempAlertLow) {
    Serial.println("[PREDICTION] ALERT: Temperature predicted to drop below low threshold!");
  }
}

// ============ TWIN COMMAND EXECUTION ============
void executeTwinCommands() {
  // This demonstrates Digital -> Physical command flow
  // The twin can decide to turn LED on/off based on conditions

  // Example rule: Turn LED on if temperature exceeds high threshold
  bool shouldLedBeOn = digitalTwin.temperature > digitalTwin.tempAlertHigh;

  // Alternative: LED follows button toggle state (already handled)
  // Here we show how twin-side logic could override physical state

  if (shouldLedBeOn && !digitalTwin.ledState) {
    Serial.println("[COMMAND] Twin activating LED due to high temperature");
    digitalWrite(LED_PIN, HIGH);
    digitalTwin.ledState = true;
  }
}

void toggleLedFromTwin() {
  // Twin-mediated LED toggle (button press -> twin logic -> LED control)
  bool newState = !digitalTwin.ledState;
  digitalWrite(LED_PIN, newState ? HIGH : LOW);
  digitalTwin.ledState = newState;

  Serial.print("[COMMAND] Twin toggled LED to: ");
  Serial.println(newState ? "ON" : "OFF");
}

// ============ STATUS DISPLAY ============
void displayTwinStatus() {
  Serial.println("\n-------- DIGITAL TWIN STATUS --------");
  Serial.println("Physical Device State:");
  Serial.print("  Temperature: ");
  Serial.print(physicalDevice.temperature, 1);
  Serial.println(" C");
  Serial.print("  Humidity:    ");
  Serial.print(physicalDevice.humidity, 1);
  Serial.println(" %");
  Serial.print("  LED State:   ");
  Serial.println(physicalDevice.ledState ? "ON" : "OFF");

  Serial.println("\nDigital Twin Mirror:");
  Serial.print("  Temperature: ");
  Serial.print(digitalTwin.temperature, 1);
  Serial.println(" C (synced)");
  Serial.print("  Humidity:    ");
  Serial.print(digitalTwin.humidity, 1);
  Serial.println(" % (synced)");
  Serial.print("  LED State:   ");
  Serial.println(digitalTwin.ledState ? "ON" : "OFF");

  Serial.println("\nTwin Analytics:");
  Serial.print("  Avg Temp (");
  Serial.print(historyCount);
  Serial.print(" samples): ");
  Serial.print(digitalTwin.avgTemperature, 1);
  Serial.println(" C");
  Serial.print("  Temp Trend:  ");
  Serial.print(digitalTwin.tempTrend >= 0 ? "+" : "");
  Serial.print(digitalTwin.tempTrend, 2);
  Serial.println(" C/cycle");
  Serial.print("  Predicted:   ");
  Serial.print(digitalTwin.predictedTemp, 1);
  Serial.print(" C (in ");
  Serial.print(PREDICTION_HORIZON);
  Serial.println(" cycles)");

  Serial.println("\nTwin Metadata:");
  Serial.print("  Sync Count:  ");
  Serial.println(digitalTwin.syncCount);
  Serial.print("  Sync Latency: ");
  Serial.print(digitalTwin.syncLatencyMs);
  Serial.println(" ms");
  Serial.print("  Status:      ");
  Serial.println(digitalTwin.healthStatus);

  Serial.println("--------------------------------------\n");
}
26.2.5 Step-by-Step Instructions
Step 1: Understanding the Code Structure
The code is organized around core digital twin concepts:
PhysicalStatestruct: the actual hardware state reported by sensors and outputs.DigitalTwinstruct: the virtual mirror plus analytics metadata.HistoryEntryarray: the circular buffer used for recent state history.performSyncCycle(): the end-to-end synchronization loop.runTwinAnalytics(): twin-side trend and health processing.calculatePredictions(): simple forecasting based on recent trends.executeTwinCommands(): digital-to-physical LED control.
Step 2: Wire the Circuit
In the Wokwi simulator:
- Add an ESP32 board
- Add a DHT22 sensor, connect: VCC to 3.3V, GND to GND, DATA to GPIO 4
- Add a red LED with 220 ohm resistor from GPIO 2 to GND
- Add a pushbutton with 10K pull-down resistor from GPIO 15 to GND
Step 3: Run and Observe
- Start the simulation
- Open the Serial Monitor (baud rate: 115200)
- Watch the sync cycles every 2 seconds
- Observe how the digital twin mirrors physical state
- Press the button to trigger manual sync and toggle LED
Step 4: Experiment with Temperature
In Wokwi, you can adjust the DHT22 temperature:
- Click on the DHT22 sensor
- Drag the temperature slider up or down
- Watch the twin detect the trend
- See predictions adjust based on trend direction
- When temperature exceeds 30C, observe the LED turn on automatically
Checkpoint: Lab Loop
You now know:
- The ESP32 lab mirrors physical state every 2 seconds, then lets twin logic command the LED.
- The 10-entry circular buffer keeps recent history so averages, trends, and predictions can be recomputed without unbounded memory growth.
- Temperature control uses the current reading against the 30C high threshold; prediction explains the trend, but it does not by itself turn the LED on.
Once the base loop works, the challenge exercises extend one capability at a time: humidity prediction, anomaly detection, what-if simulation, and network staleness.
26.2.6 Challenge Exercises
Challenge 1: Add Humidity Prediction
Extend the prediction engine to also forecast humidity:
// Add to DigitalTwin struct:
float humidityTrend;
float predictedHumidity;

// Add to calculatePredictions():
// Calculate humidity trend similar to temperature
// Generate predictedHumidity valueGoal: Make the twin predict both temperature AND humidity trends.
Challenge 2: Implement Anomaly Detection
Add code to detect anomalies (sudden spikes):
Run it: Instead of guessing what a spike looks like in the data, open the Digital Twin Analytics workbench below and watch the time-series chart that overlays the physical signal on the twin’s reported state. Pick a scenario such as Wind turbine fleet or Water pump station, press Play, then lower the Event threshold and raise Samples per minute so a sudden deviation stands out against the trend and trips the State drift check. Step the pipeline stages from Collect telemetry through Clean and filter to Act on insight to see where an anomaly rule belongs. Use that observed spike behavior to define the standard-deviation threshold and the ANOMALY DETECTED condition you add in the code below.
void detectAnomalies() {
  // If current reading differs from average by more than 2 standard deviations
  // Set healthStatus to "ANOMALY DETECTED"
  // Consider: How would you calculate standard deviation from history?
}Goal: Alert when sensor values change unexpectedly fast.
Add What-If Simulation
Create a mode where you can test hypothetical scenarios:
void simulateWhatIf(float hypotheticalTemp) {
  // Temporarily set twin temperature to hypotheticalTemp
  // Run analytics and predictions
  // Show what WOULD happen without changing physical state
  // This demonstrates a key digital twin capability
}Goal: Test scenarios virtually before affecting the physical system.
Challenge 4: Network Simulation
Simulate network latency and disconnection:
Run it: Before you code the network-simulation challenge, use the Digital Twin Synchronization Demo below to see staleness happen. Raise the One-way latency and Jitter sliders and lengthen the Sync interval, then press Play and watch the Freshness check move from Fresh enough to Use with caution to Too stale for control as the twin’s reported state drifts from the physical state. Compare the Continuous, Periodic, and Event-driven modes to decide which one your buffered-and-replayed design should imitate when the link returns. Let what you observe about the Command path check shape the stale indicator and replay rules you then implement in the code below.
bool networkConnected = true;
unsigned long lastNetworkCheck = 0;

void simulateNetworkConditions() {
  // Randomly disconnect for 5-10 seconds every minute
  // When disconnected, twin should show "Stale" indicator
  // Buffer physical readings during outage
  // Replay buffered data when connection restores
}Goal: Understand graceful degradation when sync fails.
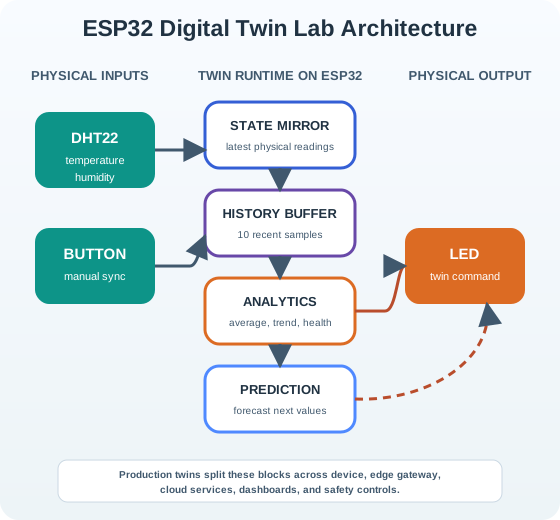
26.2.7 Lab Architecture Overview
The following diagram shows how the lab components map to a real digital twin architecture. The ESP32 acts as both the physical device and the twin host (in production, the twin would run in the cloud).
26.2.8 Key Digital Twin Concepts Demonstrated
This lab illustrates the fundamental concepts that distinguish digital twins from simple monitoring:
Concept 1: Bidirectional Synchronization
Physical -> Digital: Sensor readings update the twin state every 2 seconds.
Digital -> Physical: Button press is processed by twin logic, which then commands the LED. Temperature threshold triggers automatic LED activation.
This bidirectional flow is what makes it a twin, not just a shadow.
Concept 2: State History and Trends
The circular buffer maintains the last 10 readings, enabling:
- Average calculation: Smooths noisy sensor data
- Trend detection: Identifies rising/falling patterns
- Basis for prediction: Historical data feeds forecasting algorithms
Real digital twins store months or years of history for sophisticated ML models.
Concept 3: Predictive Analytics
The simple linear extrapolation demonstrates how twins forecast future states:
Predicted = Current + (Trend x Horizon)Industrial twins use advanced ML models trained on historical data, but the principle is identical: use patterns from the past to predict the future.
Concept 4: Twin-Side Intelligence
The twin makes decisions independently:
- Calculates health status based on thresholds
- Generates alerts for predicted threshold crossings
- Commands the LED based on conditions
This intelligence lives in the “digital” side, not the physical device, enabling remote updates and complex logic without modifying hardware.
26.2.9 Connection to Real-World Digital Twins
- ESP32 + DHT22 maps to an industrial PLC or embedded controller with many sensors.
- 10-entry history buffer maps to a time-series database that may retain years of telemetry.
- Linear trend prediction maps to trained ML models such as random forests, gradient boosting, or sequence models.
- Serial output display maps to a dashboard, alarm console, or 3D visualization layer.
- Button toggle maps to operator commands from SCADA or a work-order system.
- LED indicator maps to industrial actuators such as valves, motors, dampers, or relays.
The lab demonstrates the same architectural patterns used in enterprise digital twins, just at a smaller scale suitable for learning.
26.2.10 Scaling From Lab to Production
The lab runs everything on a single ESP32. In production, the architecture separates across multiple tiers:
- Twin runtime: The lab runs on one ESP32. Production usually splits the twin across device firmware, edge gateways, and cloud services because complex analytics exceed microcontroller resources.
- User interface: The lab prints to Serial Monitor. Production exposes REST APIs, WebSocket dashboards, alarm systems, and role-based operator views.
- State history: The lab keeps 10 samples in RAM. Production stores telemetry in a time-series database such as InfluxDB or TimescaleDB.
- Sync cadence: The lab polls every 2 seconds. Production mixes event-driven updates with sensor-specific periodic sampling.
- Decision logic: The lab uses one threshold rule. Production uses rule engines, model pipelines, and safety gates for multi-variable decisions.
- Security: The lab has no authentication. Production needs TLS, identity, authorization, audit logs, and change control.
Understanding this scaling path helps you design lab prototypes that map cleanly to production architectures.
Checkpoint: Production Readiness
You now know:
- A correct forecast example is 26C plus a 0.8C/cycle trend over 3 cycles, which predicts 28.4C.
- A pump-fleet twin is not automatically valuable: the example moves from negative ROI at 70% detection to positive ROI at 90% detection.
- Production readiness depends on validated prediction, edge-side data reduction, ownership boundaries, security, and failure baselines.
The final checks below test whether you can separate a working lab demo from a deployable twin program.
Pump Twin ROI Calculation
Scenario: A chemical plant operates 50 industrial pumps that cost $120,000 each. Unplanned pump failures cause production line shutdowns costing $15,000/hour. The plant wants to implement predictive maintenance using digital twins.
Given:
- 50 pumps, each with 8 sensors (vibration, temperature, pressure, flow, bearing temp, seal condition, motor current, runtime hours)
- Current failure rate: 3 unplanned failures per year across the fleet
- Average downtime per failure: 6 hours (diagnosis + repair + restart)
- Sensor data: 100 Hz sampling for vibration, 1 Hz for others
- Digital twin platform cost: $180,000/year
- Installation cost: $8,000 per pump (one-time)
Step 1: Calculate current annual failure cost
- Failures per year: 3
- Cost per failure: 6 hours x $15,000/hour = $90,000
- Emergency repair cost: $12,000 per incident
- Total annual cost: (3 x $90,000) + (3 x $12,000) = $270,000 + $36,000 = $306,000
Step 2: Estimate twin prediction capability Assume vibration analysis detects many bearing failures in advance and the pilot reaches a conservative 70% detection rate: - Preventable failures: 3 x 0.70 = 2.1, rounded to 2 failures/year - Remaining unplanned: 1 failure/year
Step 3: Calculate savings from predicted failures Predicted failures allow scheduled maintenance during planned downtime (zero production impact): - Avoided downtime cost: 2 x $90,000 = $180,000 - Planned vs emergency repair cost difference: 2 x ($12,000 - $6,000) = $12,000 - Annual savings: $180,000 + $12,000 = $192,000
Step 4: Calculate total cost of ownership
- Platform subscription: $180,000/year
- Installation (amortized over 5 years): ($8,000 x 50) / 5 = $80,000/year
- Annual TCO: $180,000 + $80,000 = $260,000
Step 5: ROI analysis
- Annual benefit: $192,000
- Annual cost: $260,000
- Net annual result: -$68,000 (not profitable in first scenario)
Step 6: Sensitivity analysis - what if we improve detection? At 90% detection rate (achievable with ML-enhanced twins): - Preventable failures: 3 x 0.90 = 2.7, rounded to 3 failures/year - Annual savings: $270,000 + $18,000 = $288,000 - Net annual benefit: $288,000 - $260,000 = +$28,000 (profitable)
Result: Digital twin ROI depends critically on prediction accuracy. At 70% accuracy, ROI is negative. At 90% accuracy (requiring ML models trained on historical failure data), payback occurs within year 2.
Key Insight: The value threshold for industrial digital twins lies in prediction accuracy, not data collection. A twin that monitors but doesn’t predict accurately is a $260K/year expense with zero ROI.
When Equipment Needs Twins
Use this framework to evaluate whether digital twin investment is justified:
- Failure cost, 40% weight: more than $10K/hour = 10 points; $5K-10K/hour = 5 points; less than $5K/hour = 0 points.
- Failure frequency, 30% weight: more than 5 unplanned failures/year = 10 points; 2-5 failures/year = 5 points; fewer than 2 failures/year = 0 points.
- Sensor feasibility, 20% weight: all critical failure modes can be sensed = 10 points; partial sensing = 5 points; no useful sensing = 0 points.
- Historical data availability, 10% weight: more than 1 year = 10 points; 6-12 months = 5 points; less than 6 months = 0 points.
Scoring:
- 80-100 points: Strong candidate - implement digital twin
- 50-79 points: Marginal case - pilot with 3-5 units first
- <50 points: Not recommended - use simpler monitoring
For the pump example:
- Failure cost: 10 points (>$10K/hr)
- Frequency: 5 points (3 failures/year)
- Sensor feasibility: 10 points (vibration sensors detect bearing wear)
- Historical data: 0 points (new deployment)
Weighted score: (10 x 0.4) + (5 x 0.3) + (10 x 0.2) + (0 x 0.1) = 4 + 1.5 + 2 + 0 = 7.5 out of 10, or 75%. That is a marginal case.
Recommendation: Pilot on 5 pumps for 6 months to collect historical failure data, then expand fleet-wide once models are trained and prediction accuracy is validated.
Twins Need Failure Baselines
The Error: Implementing digital twins on brand-new equipment with zero historical failure data, expecting immediate predictive value.
Why It Happens: Sales pitches for digital twin platforms emphasize “AI-powered prediction” without clarifying that ML models require training data - specifically, examples of what sensor patterns look like BEFORE equipment fails.
The Impact:
- First 6-12 months: Twin can only detect threshold exceedances (e.g., temperature above 80C), which operators already know
- No predictive capability until at least 5-10 failures are observed and correlated with sensor precursors
- Management loses confidence in ROI when “predictions” are just reactive alarms
The Fix:
- Start with high-failure-rate equipment: Deploy twins on pumps/motors that fail 5+ times per year, not on new equipment
- Collect before predicting: Run twins in “monitor-only” mode for 6-12 months to build baseline
- Transfer learning: Use failure patterns from similar equipment at other sites to bootstrap models
- Hybrid approach: Combine physics-based models (bearing vibration thresholds from manufacturer specs) with ML to reduce training data needs
Red Flag: If a vendor promises “predictive maintenance from day one” on equipment with no failure history, they’re overselling. True prediction requires pattern recognition, which requires historical patterns to recognize.
Realistic Timeline:
- Month 1-6: Data collection, threshold monitoring
- Month 7-12: Pattern identification, first predictive models
- Month 13+: Validated predictions with accuracy metrics
26.3 Digital Twin Pitfalls
Do Not Send All Raw Data
At 500 machines generating 50 readings per second, raw data ingestion costs 432 GB/day in bandwidth alone. Always use edge gateways for local aggregation, filtering, and anomaly-first forwarding to achieve 95-99% data reduction.
Digital Shadows vs Twins
A system that only displays sensor readings on a dashboard is a digital shadow, not a twin. A true digital twin must support bidirectional flow – the digital model sends commands or recommendations back to the physical system. If your “twin” cannot control or influence the physical asset, you have a shadow.
Pitfall 3: Ignoring Sensor Drift
Physical sensors degrade over time. If your twin blindly trusts sensor data without calibration checks and drift detection, you will make decisions based on incorrect state. Implement periodic validation against reference measurements and log drift patterns for predictive maintenance.
26.4 Summary
This chapter covered both the conceptual assessment and hands-on implementation of digital twin systems.
Assessment Takeaways:
- Digital twins enable bidirectional synchronization (monitoring AND control), distinguishing them from one-way digital shadows
- At scale (e.g., 500 machines, 25,000 readings/second), edge computing is mandatory for bandwidth reduction and local processing
- DTDL separates slowly-changing properties from time-series telemetry, enabling efficient storage and querying
- Physical-wins conflict resolution prioritizes real-world measurements and flags sensors for calibration when discrepancies persist
- Graph-based relationship modeling is critical for systems with complex entity interconnections (e.g., traffic networks, wind farms)
Lab Takeaways:
- Implemented a seven-step sync cycle: read sensors, mirror state, record history, analyze trends, predict, execute commands, display status
- Used a circular buffer for fixed-memory state history on a constrained device
- Built trend-based prediction using simple linear extrapolation – the same principle (at smaller scale) as industrial ML models
- Demonstrated twin-side intelligence where the digital model autonomously controls physical actuators based on threshold logic
Real-World Impact:
- Predictive maintenance twins can reduce unplanned downtime when failure modes are measurable and models are validated against real events
- Building twins can improve energy performance when occupancy, weather, HVAC constraints, and operator workflows are modeled together
- Product and process twins can support safer experimentation by testing changes virtually before altering physical systems
Start simple: Begin with telemetry mirroring and threshold-based alerts. Add prediction capabilities as historical data accumulates. This MVP approach typically shows ROI in weeks rather than months.
Cross-Hub Connections
Explore Further:
- Simulations Hub - Try interactive digital twin simulations and visualization tools
- Videos Hub - Watch digital twin implementations and case studies
- Quizzes Hub - Test your understanding of digital twin concepts
- Knowledge Gaps Hub - Common misconceptions about digital twins vs. simulations
Real-World Examples:
- Application Domains - Digital twin use cases across 14+ industries
Related Chapters
Foundation Concepts:
- IoT Reference Models - Understanding broader architectural frameworks
- Edge and Fog Computing - Processing architectures for digital twins
- Sensor Fundamentals - Physical-to-digital data acquisition
Communication Infrastructure:
- MQTT Protocol - Common protocol for twin updates
- Data Formats for IoT - Structuring twin telemetry
Data and Analytics:
- Big Data Overview - Handling twin data at scale
- Time-Series Databases - Storing twin telemetry
- Machine Learning for IoT - Predictive analytics in twins
Implementation:
- Network Design and Simulation - Testing twin architectures
- Cloud Platforms - Hosting twin infrastructure
26.5 What’s Next
- Review digital twin architecture: Digital Twin Architecture
- Study synchronization and modeling: Digital Twin Sync & Modeling
- Explore industry applications: Digital Twin Industry Applications
- Work through more examples: Digital Twin Worked Examples
- Learn the overview first: Digital Twins Introduction