24 Zigbee Network Analyzer
Zigbee network analyzer evidence, Zigbee diagnostic record, Zigbee traffic analysis, Zigbee link-quality review, Zigbee analyzer limitations
24.1 In 60 Seconds
A Zigbee network analyzer is useful when it turns device observations, route symptoms, bridge logs, and packet evidence into a bounded diagnostic record. It is weak evidence when it becomes a code exercise, a dashboard tour, or a claim that every real network issue has been explained.
This chapter reviews analyzer output as evidence: what was captured, which devices and paths were visible, what changed, which observations agree or conflict, what the analyzer cannot see, and what decision or retest follows.
24.2 Learning Objectives
By the end of this chapter, you will be able to:
- state a reviewable analyzer claim,
- separate captured observations from deployment proof,
- connect topology, traffic, route-change, and device-health evidence,
- recognize missing context in analyzer records,
- document analyzer limits before making operations decisions, and
- assign owners, exclusions, and retest triggers for diagnostic follow-up.
24.3 Quick Check: Zigbee Analyzer
24.4 Start With the Analyzer Claim
Do not start by asking whether the analyzer says the network is healthy. Start with the claim the evidence can support.
Weak claim: the analyzer shows the Zigbee network is fine.
Stronger claim: during the reviewed window, the captured records show the selected devices reporting through the expected path, a specific route-change symptom appears in both traffic and gateway evidence, the missing observations are listed, and a named owner will retest after the physical or configuration change.
The stronger claim keeps the analyzer useful without turning the tool into a substitute for engineering review.
24.5 Evidence Families
Use these evidence families before accepting an analyzer result.
Capture-scope evidence records the devices, gateway view, observation window, path, and event being reviewed.
Topology evidence records parent, relay, coordinator, gateway, and single-dependency observations.
Traffic evidence records source, destination, command class, direction, repetition, missing response, and visible delivery.
Route-change evidence records what path changed, what symptom appeared, what recovered, and what remained unknown.
Device-health evidence records stale reporting, repeated retries, power-state warnings, missed check-ins, or changing link-quality observations without turning one metric into a universal diagnosis.
Correlation evidence compares analyzer output with gateway logs, site observations, support reports, commissioning records, and recent changes.
Limit evidence records what the analyzer did not see, such as hidden interference, physical obstruction, key custody, gateway implementation behavior, maintenance work, or devices outside the capture scope.
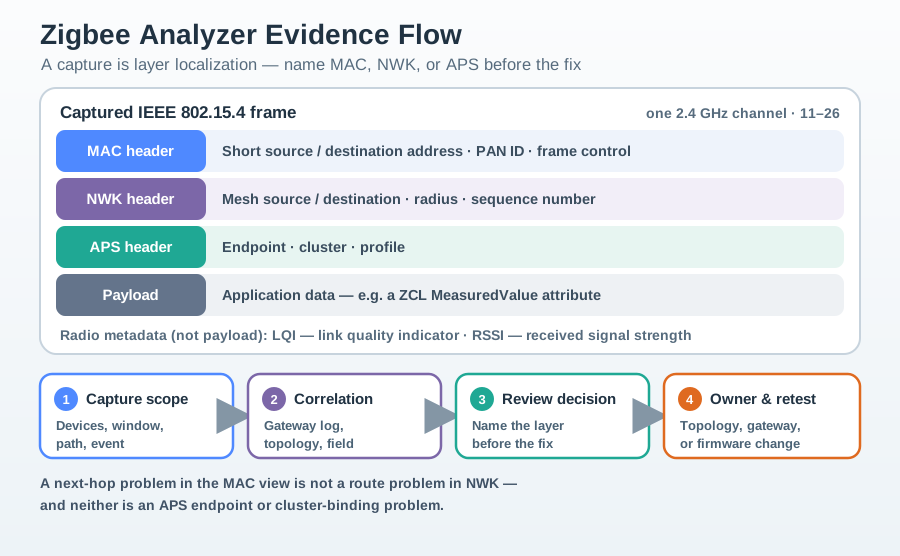
A packet capture adds another evidence family: layered frame evidence plus radio metadata. A Zigbee analyzer sniffs raw IEEE 802.15.4 frames on one channel; Zigbee 2.4 GHz networks use channels 11 through 26. A captured frame can include the MAC header, with short source and destination addresses, PAN ID, and frame control; the Zigbee NWK header, with mesh source, destination, radius, and sequence number; and the APS header, with endpoint, cluster, and profile information. Alongside those bytes, the analyzer records radio metadata such as LQI, the Link Quality Indicator, and RSSI, the received signal strength.
Reading a capture is therefore a layer-localization exercise. A next-hop destination problem in the MAC view is different from a route problem in NWK, and both differ from an APS endpoint or cluster-binding problem. The review should name the layer before naming the fix.
24.6 Set the Capture Boundary
An analyzer record needs a boundary before the result can be trusted.
Ask:
- Which device group or path is under review?
- What symptom triggered the review?
- Which traffic was visible to the analyzer?
- Which gateway, coordinator, router, or endpoint observations were included?
- Which devices or messages were outside the capture scope?
- Which field observations must be compared with the analyzer output?
Avoid accepting a broad statement such as “the analyzer saw no problem.” A narrow, bounded absence of evidence is useful. A broad absence of evidence usually means the review did not define what it was trying to find.
Two capture limits should be recorded before payload conclusions are trusted. First, Zigbee encrypts at the NWK layer with the network key, and some deployments also use APS link keys. A sniffer may see addresses, PAN ID, frame types, and route activity while the application payload remains ciphertext. To decode a joining device, the capture must start before the join so key transport is observed, or the analyzer must be preloaded with the known network key, install code, or other approved key material.
Second, a single sniffer hears one channel and one RF neighborhood. It will not observe a whole mesh by default. A multi-hop path, such as end device to router to coordinator, may require sniffer placement near the suspect hop or multiple coordinated capture points.
| Capture limit | Review consequence | Mitigation |
|---|---|---|
| No approved key material loaded | Payloads remain ciphertext even when frames are visible | Capture the join or preload approved key material. |
| Single channel | Off-channel traffic is invisible | Confirm and capture the network channel being reviewed. |
| Single RF vicinity | Distant hops or hidden paths are missed | Place sniffers near the suspect link or use multiple capture points. |
24.7 Review Topology and Path Evidence
Topology evidence is not a pretty map. It is a record of dependencies.
Review:
- which nodes appear as coordinator, relay, endpoint, gateway, or observer,
- which endpoint depends on which parent or relay,
- whether the path has an alternate route or a single visible dependency,
- whether the map agrees with recent commissioning or placement records,
- whether the analyzer view is stale, partial, or filtered,
- whether the observed path explains the user-visible symptom, and
- what field observation would confirm or challenge the map.
Treat topology as a question generator. It points to likely dependencies, but it does not prove the physical site behaves exactly like the captured view.
24.8 Review Traffic and Symptoms
Traffic review asks whether the analyzer sees the same problem that users, gateways, or support records describe.
Review:
- the message direction and endpoint affected,
- repeated attempts, missing responses, or duplicated events,
- route-change or parent-change evidence near the symptom,
- whether the symptom appears for one device, one path, one service, or a wider group,
- whether device-health observations explain or distract from the issue,
- whether logs from another layer agree with the analyzer record, and
- what remains invisible after the capture.
Do not diagnose from one attractive metric. A falling link-quality observation, a stale report, or a repeated message is a clue. It becomes stronger evidence only when the review connects it to the path, event, user impact, and field context.
The diagnostic value of a capture is in trends across the timeline, not a single frame. Falling LQI on a link can foreshadow a route change. Repeated NWK route-request broadcasts can show route-discovery churn, meaning the route is unstable or missing rather than steady. Route-record commands in many-to-one routing can reveal the source route the coordinator will use back to a device. Duplicate frames with the same APS counter can indicate retransmissions on a lossy link, and repeated rejoins with new short NWK addresses can point to a failing parent relationship.
That is why an intermittent endpoint should be reviewed by correlating LQI movement, retries, route discovery, rejoins, gateway gaps, and user-visible timing. A burst of route requests plus rising retries points toward routing or link instability. Repeated rejoins point toward association or parent behavior. Readable headers with no expected reports point toward APS binding, reporting configuration, or gateway path evidence.
24.9 Analyzer Review Record
Use a review record when accepting network-analyzer evidence.
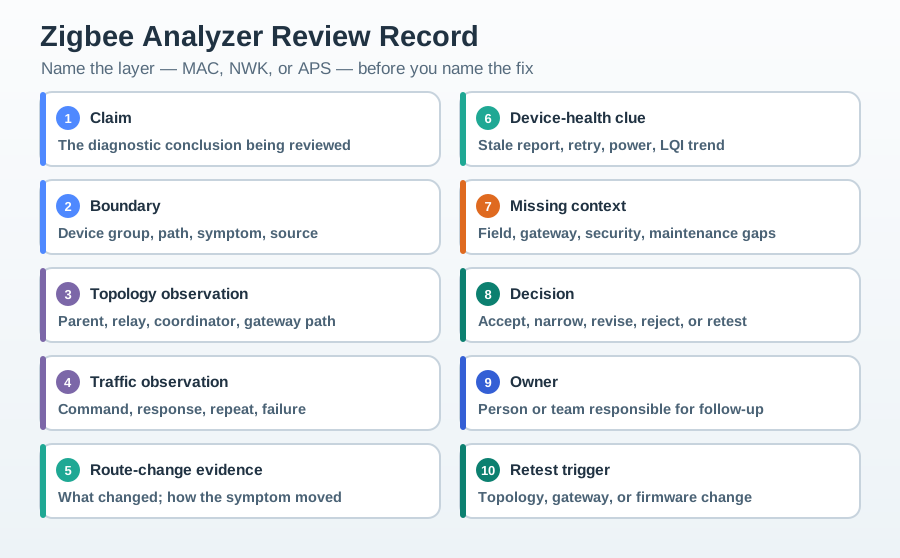
The record should include:
- Claim: diagnostic conclusion being reviewed.
- Boundary: device group, path, symptom, and observation source covered.
- Topology observation: parent, relay, coordinator, gateway, or single-dependency evidence.
- Traffic observation: command, response, repeat, failure, or recovery pattern.
- Route-change evidence: what changed and how the symptom moved or recovered.
- Device-health clue: stale report, retry pattern, power-state concern, or link-quality trend.
- Missing context: field condition, gateway behavior, security boundary, maintenance action, or excluded device group.
- Decision: accept, narrow, revise, reject, observe longer, or retest.
- Owner: person or team responsible for follow-up.
- Retest trigger: topology change, gateway change, endpoint replacement, support recurrence, firmware update, or changed traffic pattern.
24.10 Worked Review: Intermittent Endpoint
Scenario: An endpoint reports intermittently. The analyzer shows repeated attempts, a parent-path change, and a device-health clue. The gateway log shows a matching support-visible gap.
Review path:
- Record the endpoint, service impact, and observation source.
- Compare the analyzer path with the stored topology record.
- Check whether repeated traffic and gateway gaps occur in the same review window.
- Identify what the analyzer cannot prove about the physical site.
- Decide whether to retest placement, review parent dependency, or continue observation.
Decision: Accept the analyzer evidence as a bounded diagnostic clue. Require field context and a named retest before changing the deployment record.
24.11 Worked Review: Router Replacement
Scenario: A relay device was replaced. The analyzer shows changed paths for a small endpoint group, but only some support records show visible impact.
Review path:
- Record the change event and affected endpoint group.
- Compare before-change and after-change topology observations.
- Review repeated traffic, missing responses, and route-change evidence.
- Separate analyzer-visible changes from user-visible service impact.
- Assign the owner for retest and decide what change reopens the review.
Decision: Revise the topology and support notes when the analyzer and field records agree. Narrow the claim when the analyzer sees a path change but user impact remains unproven.
24.12 Knowledge Check: Analyzer Claim
24.13 Matching Quiz: Analyzer Evidence Family
24.14 Ordering Quiz: Analyzer Review Sequence
24.15 Common Analyzer Drift
Tool-manual drift: replacing review thinking with setup commands or script details.
Dashboard drift: treating a chart or health label as the final diagnosis.
Metric drift: relying on one signal without checking path, traffic, symptom, and context.
Topology drift: treating a map as proof that the physical site has the same dependencies.
Correlation drift: ignoring gateway logs, support reports, site observations, or recent maintenance changes.
Scope drift: applying one endpoint group’s evidence to the whole deployment.
Owner drift: ending with an analyzer screenshot but no person responsible for retest.
24.16 Analyzer Evidence Checklist
Before accepting analyzer evidence, verify that the record answers these questions:
- What exact diagnostic claim is being reviewed?
- Which device group, path, symptom, and observation source are included?
- What topology dependency or route change was observed?
- What traffic pattern supports, narrows, or contradicts the claim?
- What device-health clue is relevant, and what does it not prove?
- What gateway logs, site observations, or support records agree or conflict?
- What evidence is missing because the analyzer could not see it?
- Which devices, services, or time windows are outside the review?
- Who owns the follow-up decision?
- What future event reopens the review?
24.17 Knowledge Check: Correlation Boundary
24.18 Summary
A Zigbee network analyzer improves review quality when it connects traffic, topology, device-health clues, gateway records, and field context into a bounded diagnostic claim. It reduces quality when it becomes a tool tutorial or a dashboard-only approval step.
Use analyzer output to narrow the question, find dependencies, compare evidence sources, and plan retest. Accept only the claim that the evidence supports, and record what remains unknown.
24.19 Key Takeaway
Zigbee Network Analyzer Evidence Review should leave deployment evidence for network formation, binding, routing, security, scaling, diagnostics, and observed simulation or lab behavior.
24.20 Concept Relationships
- Capture boundary and traffic evidence: the boundary defines what was visible; traffic evidence shows what happened inside that scope.
- Topology observation and route-change evidence: topology shows dependencies; route-change evidence shows how those dependencies behaved during an event.
- Device-health clue and diagnosis: a health clue can guide investigation, but diagnosis needs traffic, path, symptom, and context.
- Analyzer limits and field evidence: limits explain what the analyzer cannot prove; field evidence closes the deployment gap.
- Decision and retest trigger: every accepted analyzer result needs an owner and a condition that reopens the review.
24.21 What’s Next
- Zigbee Lab: Mesh Simulator reviews modeled routing behavior before analyzer evidence is used.
- Zigbee Lab: Temperature Network applies diagnostic evidence to a sensing scenario.
- Zigbee Routing Evidence Review explains route discovery, repair, and gateway visibility evidence.
- Zigbee Security Evidence Review reviews what diagnostic evidence can and cannot prove about key custody and join behavior.