36 IoT Pricing: Revenue Models and Selection
More
Depth: Practitioner
Progress saves as you read. Mark sections complete as you go; your progress appears in the sidebar.
- Podcast audio coming soon
- Character narration audio coming soon
36.1 Turn a Tier into a Sustainable Service
A connected service now has clear tiers, but the team still has to decide what customers pay for each month. Charging per device, user, event, or outcome changes revenue stability, customer risk, and operating cost. This chapter compares revenue-model families, tests subscription, usage, and freemium economics, and selects a pricing structure from customer and operating evidence.
This is part 2 of 2. IoT Pricing: Value Metrics and Tiers establishes the value metric and tier boundaries. Here, keep that service team’s problem in view: a device sale arrives once, while hosting, support, and useful service continue. A high invoice alone cannot establish that the offer will last.
The team needs a way to charge that customers understand and that funds its obligations. We will first compare the approaches, then test bills and breakeven, and finally connect customer value to a launch decision.
KEY CONCEPTS
- Recurring revenue
Match the charging pattern to ongoing value.
- Metered usage
Connect the bill to trustworthy consumption evidence.
- Paid conversion
State which users form the denominator.
- Customer benefit
Test savings, value capture, and payback.
36.2 Learning Objectives
By the end of this chapter, you will be able to:
- compare recurring IoT revenue-model families
- test subscription, usage, and freemium economics
- select a pricing model from customer and operating evidence
36.3 Match the Revenue Model to the Value Pattern
A revenue model describes how the provider earns income from delivered value. Four primary families give the team different ways to fund the same connected service. Figure 1 compares their value patterns and risks.
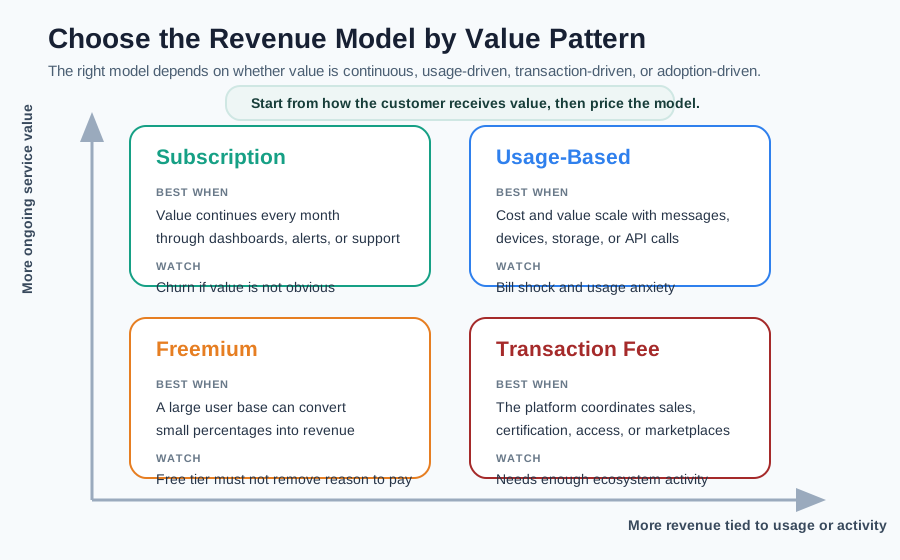
Read the four models in order, comparing value patterns, how revenue arrives, and what can fail. Subscription Revenue charges monthly or annually for continuous service. Customers can leave when ongoing value fades. Usage-Based Pricing charges for consumption, so revenue varies with usage patterns. Transaction Fees earn revenue from platform activity and need a critical mass of transactions. The Freemium Model pairs adoption with free basic tiers and identifies conversion rate as a concern. Finish at the Selection Check. Choose using customer behavior and service cost, then test the evidence for billing, metering, support, and retention.
Usage-based pricing meters consumption and charges for it. Pay-as-you-go flexibility lowers the entry barrier and scales with customer growth, while revenue varies with usage patterns. Amazon Web Services (AWS) IoT Core’s per-message example and cellular connectivity’s per-MB example show the mechanism. Trustworthy metering and clear overage rules are part of the offer.
Transaction fees earn revenue from platform activity. They align platform incentives with participant success and can grow with network effects, but marketplaces need a critical mass of transactions. Apple App Store commissions on eligible paid apps illustrate transaction charging; terms vary. SmartThings certification may involve provider testing fees, which should be distinguished from recurring marketplace transactions.
Freemium offers a free basic tier and paid upgrades. It reduces adoption friction, but a large user base must support enough paying customers. The free tier needs useful value and a visible reason to upgrade. Fitbit’s free tracking and paid Premium, alongside many consumer IoT apps, illustrate that balance. ChartMogul reports 3–5% as good and 8–12% as great for freemium self-serve SaaS; these are reference points, not a forecast for this service.
Figure 2 makes the choice more explicit. Work through product type, recurring versus one-time income, and data value before choosing a named model.
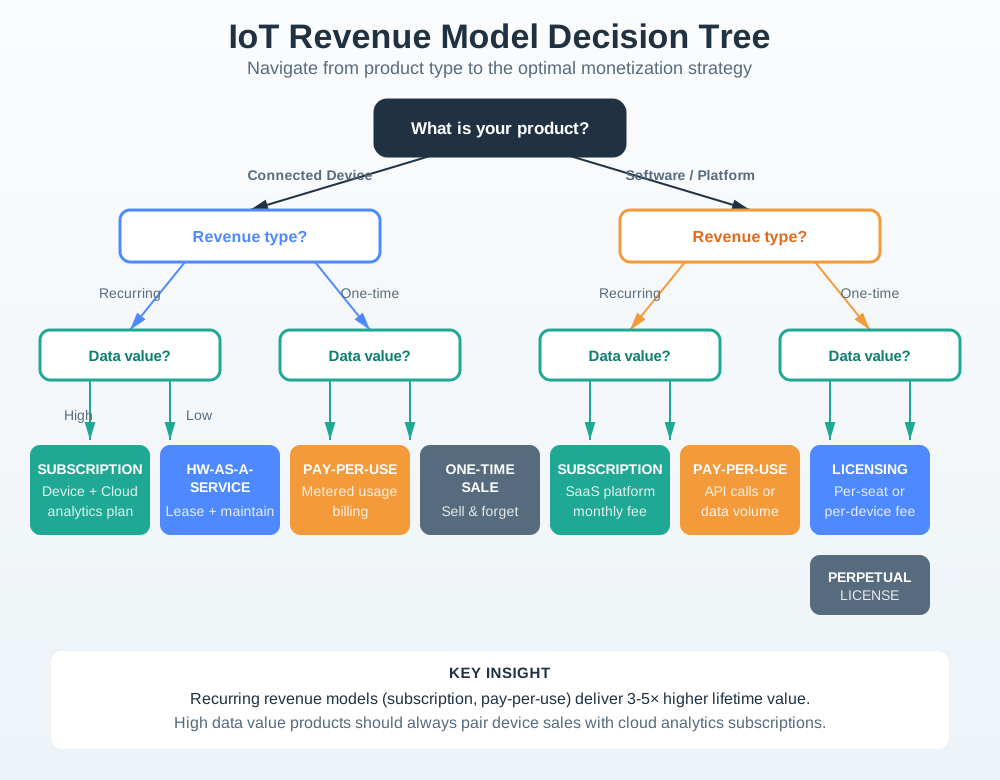
The device-or-software split matters because hardware costs need repayment. The recurring-or-once split concerns the service obligation the team accepts. The data-value question then helps distinguish a plain sale from a continuing subscription or licensing opportunity. The tree has eight named leaves, including hardware as a service, metered usage, and a perpetual licence, and states a bias toward recurring revenue. Use it to frame a hypothesis; customer behavior, billing, support, and retention evidence must sustain the choice.
When telemetry itself becomes the product, Monetizing Data explains how packaging and buyer value change. Data sales still need rights, buyer demand, and a privacy plan.
36.4 Compare Bills Before Claiming Sustainability
For the service team, the next problem is distinguishing revenue arithmetic from a viable business. Consider the fleet-tracking comparison: Model A charges $25 per vehicle per month for unlimited tracking; Model B charges $0.10 per location ping. At 3,000 pings per vehicle, B bills $300, twelve times A’s $25. Across 1,000 vehicles, stated monthly revenue is $25,000 versus $300,000.
That comparison supplies neither cost-to-serve nor willingness to pay, usage distribution, or churn. Predictable subscription bills may help budgeting; metering may align revenue with consumption. Neither proves retention or margin. Compare marginal delivery costs, contract constraints, and safety effects before choosing subscription, usage-based, or hybrid pricing.
The agricultural example makes the recurring obligation concrete. Soil-moisture sensors sell for $500 each and upload daily. In the exercise, cloud hosting costs $10 per sensor-month, other new service costs are below $5, and a $15 subscription does not change retention. Charging $15 per sensor-month for the dashboard, alerts, and historical analytics covers those continuing service costs while preserving the hardware sale. A 50-sensor farm pays $750/month, or $9,000/year, alongside its $25,000 hardware purchase.
A $0.50-per-upload alternative could discourage useful monitoring. A $100/month flat farm fee treats a 10-sensor farm and a 500-sensor operation alike, and free hardware still needs funding. Raising the sensor sale price to $800 does not by itself establish coverage of an ongoing obligation: cloud hosting alone costs $240 over two years, and hardware margin is unspecified. These examples show why the team must compare the charging unit with both customer value and continuing cost.
36.5 Test Freemium Breakeven
A conversion rate is the share of the stated user base that pays. Keep its denominator explicit. In the security-service example, 500,000 users are Free, 75,000 Basic pay $3/month, and 25,000 Premium pay $10/month. Premium represents 25% of the 100,000 paid users. Basic already contributes $225,000 monthly; removing it or reducing Premium to $7 requires demand and retention evidence. A measured Premium trial for Basic subscribers tests upgrades, while recruiting Free users tests first purchases.
For the smart-plug example, 2 million app users support a proposed $4.99 monthly Premium subscription against $500,000 annual app-development cost. Assuming all twelve payments arrive and no other service costs, annual revenue per payer is $59.88. Divide $500,000 by $59.88 and round upward: 8,351 paying users, about 0.42% of the base, cover the stated cost.
At 0.5% conversion, 10,000 payers generate $598,800 per year, approximately $599K. At 2%, 40,000 payers generate $2,395,200, approximately $2.4M, leaving about $1.9M after the stated cost. At the modeled 5%, 100,000 payers generate $5,988,000, approximately $6M, leaving about $5.5M. A large free base can therefore make a small conversion share meaningful—the “freemium flywheel”—but those remainders exclude any omitted costs.
36.6 Read the Metrics as Connected Evidence
Breakeven answers a narrow cost question. The team also needs to know whether its customers stay and whether acquiring them pays back. Figure 3 connects the revenue measures to that wider test.
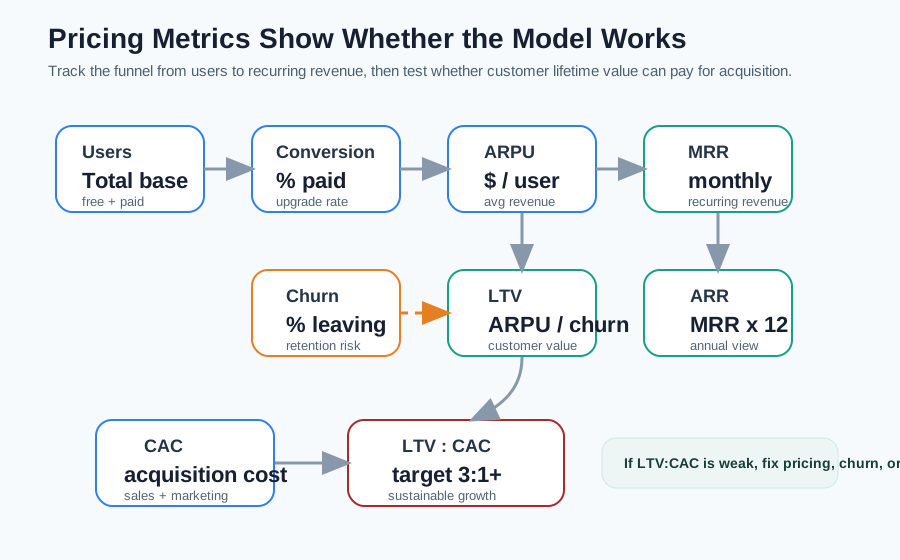
Start with users and conversion to obtain paying users. Average revenue per user (ARPU) divides revenue by the stated user count; keep clear whether that count means all users or paying users. Multiplying the paying count by average revenue per payer gives MRR, and twelve months gives the annual recurring view. In the activity-tracking exercise, 1.2 million of 10 million users pay $10 monthly: conversion is 12%, MRR is $12M, and the annualized amount is $144M. These figures alone cannot reveal hardware margin or acquisition spending.
Churn measures customers leaving. The dashboard’s simplified lifetime value (LTV) divides average revenue by churn; it is a revenue estimate, so gross margin still matters. Customer acquisition cost (CAC) records what it costs to win a customer. Compare LTV with CAC to assess acquisition economics rather than treating audience size as monetized demand. Business Model Fundamentals develops these calculations for subscription, usage, and transaction models.
This chapter uses LTV:CAC above 3:1 as a pricing-screening target, with pricing, retention, and acquisition cost as levers. It is a screening rule, not proof of viability. The example conversion target is 5–12%; below 2%, investigate free-tier value, and above 15%, check whether upgrade friction limits reach. Those diagnostic thresholds do not replace the smart-plug calculation or ChartMogul’s differently scoped benchmark. Subscription expansion that produces negative churn can strengthen long-term value relative to a one-time sale, while hardware margin and continuing service cost still need coverage.
36.7 Set a Price from Measurable Customer Benefit
Costs establish what the team must fund; measured customer benefit informs willingness to pay. A smart energy monitor costs $85 in bill of materials (BOM) and manufacturing and is assumed to save $200/month by identifying heating, ventilation and air conditioning (HVAC) inefficiencies. A 75% cost-plus markup produces $148.75, rounded to $149. Such markups feel easy and fair; the source’s consumer-electronics comparison uses 50–100%. Yet the modeled annual saving is $2,400.
Value-based pricing sets a target from measurable customer benefit. Testing 20–30% of first-year savings gives a different starting point: 20% of $2,400 is $480, about $331 above the rounded cost-plus price. At $480, customers retain $1,920 of first-year benefit, a 4:1 net-benefit-to-price ratio, and recover the price in 2.4 months.
| Approach | Price | Price less manufacturing cost | Customer annual net benefit |
|---|---|---|---|
| Cost-plus 50% | $127.50 | $42.50 | $2,272.50 |
| Cost-plus 75% | $148.75 | $63.75 | $2,251.25 |
| Value capture 20% | $480 | $395 | $1,920 |
| Value capture 40% | $960 | $875 | $1,440 |
These differences exclude other service costs. In the illustrative Sense Energy Monitor example, a $299 device with assumed $85 manufacturing cost and $150–300 monthly savings from phantom loads and HVAC issues pays back in about 1–2 months. The source also describes a move from $299 to $399 with minimal churn; without supporting evidence here, treat that outcome as an illustration to validate.
Quantify the benefit, choose a capture percentage, calculate a target, and test willingness to pay. Ask whether customers would pay $480 for $200 monthly savings; compare responses with the modeled payback. If competing offers cost $299, test the suggested $399–449 positioning rather than assuming the $480 target will sell. Energy savings, downtime prevention, and theft reduction can support value-based pricing only when their benefit is measurable.
36.8 Validate the Offer and Its Operating Promises
Return to the connected service’s tiers. Basic can drive adoption, Professional recurring revenue, and Enterprise margin from customers with higher willingness to pay. Clear feature differences, upgrade paths, and psychological anchoring—an Enterprise offer making Pro appear reasonable—help customers compare options. The building-platform exercise separates startups with 10–50 sensors, Growth customers with 200–500 needing APIs, and Enterprises with 5,000+ needing SLAs. Free Basic up to 50 sensors with email support and Pro at $5/sensor/month with API access form a starting pair; enterprise service-level agreements still require a separately priced offer.
Validate core needs before adding features. Over-engineering a prototype can waste weeks when users need simpler interactions. Include security in the initial design review: hardcoded credentials, unencrypted channels, and missing firmware signing become expensive production patterns. Test sensor failures, connectivity outages, and cloud unavailability, including a safe, locally functional fallback.
The billing design must also connect the cost floor to the offer. Device, connectivity, storage, inference, support, and replacement costs need coverage. Entitlement and usage meters bind a verified customer and device to the paid feature, unit, period, and auditable usage event. The billed metric should track customer value closely enough that a larger bill corresponds to more delivered benefit. The separate pricing-gate exercise screens LTV:CAC against 3.0 and gross margin against 0.60 before a pilot.
Use Case Studies to compare Philips LaaS outcome-based pricing at $1.50–$2.50/fixture/month and Nest Aware tiered subscriptions at $6–12/month as the source’s examples. Go-to-Market Strategy connects tiers with segmentation and phased launches. For implementation preparation, UX Design for IoT and Prototyping Essentials support testing the customer interaction and the minimum viable offer.
Summary
A sustainable IoT offer connects a customer-visible charging unit to continuing service cost. Subscriptions fund ongoing value, usage pricing follows consumption, transaction fees follow ecosystem activity, and freemium depends on paid conversion. Nest Aware, Ring Protect, Fitbit Premium, and AWS IoT Core illustrate different mechanisms.
Test revenue arithmetic before interpreting it. Conversion, ARPU, MRR, ARR, churn, LTV:CAC, and gross margin answer different questions. Value-based pricing adds a customer-benefit test; clear tiers and measured willingness to pay turn that target into an offer worth piloting.
Choose a charging model customers can explain, show that it covers service obligations, and validate the benefit and retention assumptions before scaling it.
Carry this pricing test into Application Domains Overview to compare the settings in which connected services deliver value.
