23 IoT Requirements: Five-Layer and Seven-Layer Models
23.1 Start With the Decision
A five-layer model is a useful first map. A seven-layer view splits the backend when data and business duties need clear owners.
23.2 Route Overview
This is part 2 of 2. Review IoT Requirements: Connectivity Costs and Trade-Offs for the preceding evidence.
23.3 Learning Objectives
- Map the five-layer teaching view to the seven-layer IoT model.
- Trace data through sensing, transport, processing, application, and business layers.
23.4 Chapter Roadmap
- Visual Bridge: From 5 Layers to 7
- Interactive Quiz: Match Concepts
- Interactive Quiz: Sequence the Steps
- Label the Diagram
- Code Challenge
- Summary
- Key Takeaways
- Knowledge Check
- IoT Requirements Quiz
- Eleven Characteristics Selection
- Checkpoint: Weighted Decisions
- IoT Data Flow Layers
- Concept Relationships
- See Also
- What’s Next
23.5 Visual Bridge: From 5 Layers to 7
The five-layer model used earlier in the chapter is a teaching shortcut. Detailed reference architectures split the backend into more specific data and business layers when you need sharper design boundaries.
Which part of the compact model is doing too much work? Figure 23.1 puts the two models side by side so the answer is visible.
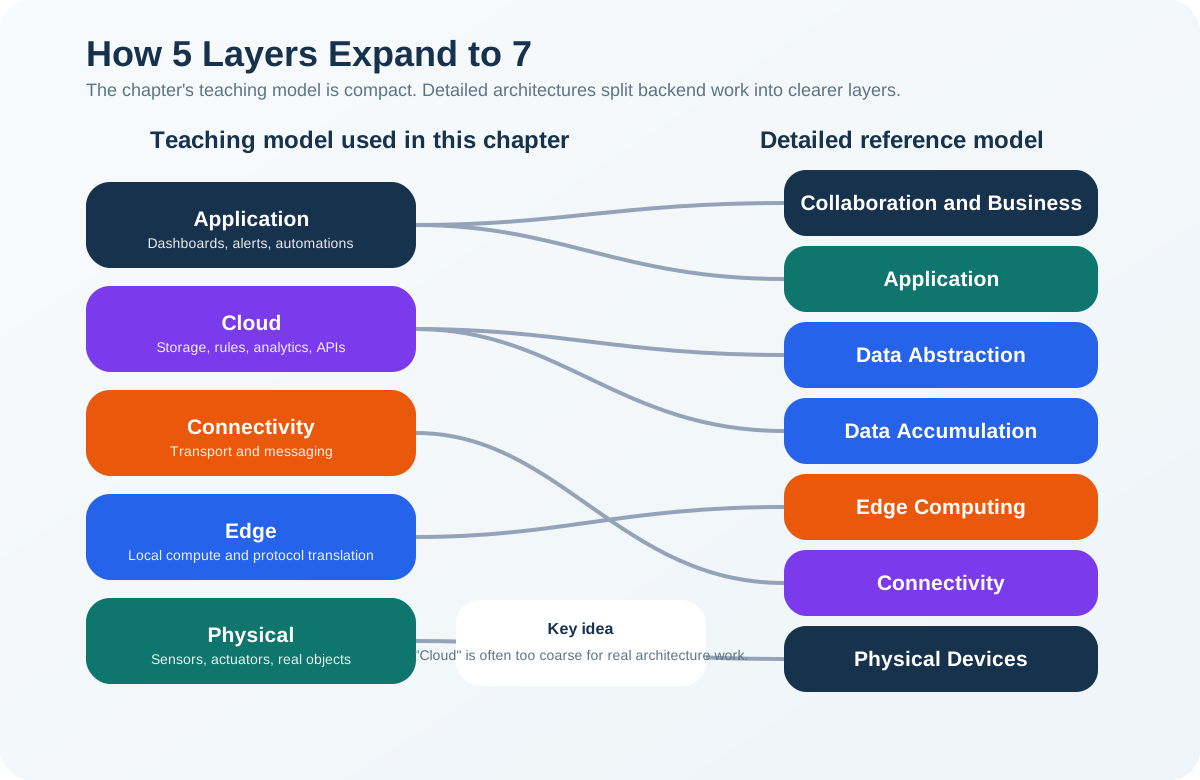
Start on the left of Figure 23.1 with the five-layer column this chapter has used. Physical, edge, and connectivity line up almost one to one with the seven-layer column beside them, so nothing is lost there. The difference sits at the top. The single cloud block on the left fans out into data accumulation, data abstraction, and application work on the right, and a business layer appears above them that the teaching model never names. That is the figure’s point, stated in its own closing note. One word was hiding storage choices, schema choices, and ownership choices that a real design has to give to someone.
Use the five-layer version when you are learning the flow. Switch to the seven-layer reference view when you need to separate storage, abstraction, applications, and business processes explicitly.
23.6 Interactive Quiz: Match Concepts
23.7 Interactive Quiz: Sequence the Steps
23.8 Label the Diagram
23.9 Code Challenge
23.10 Summary
In this chapter, you learned:
- IoT works in four steps: Sense -> Connect -> Process -> Act, repeating continuously
- Three minimum requirements define IoT: Thing + Computation + Internet connectivity
- Eleven characteristics distinguish ideal IoT systems: Ubiquitous, Smart, Agile, On Demand, Blend into Background, Secure, Low Maintenance, Fast, Upgradable, Growing, Adaptable
- Trade-offs are necessary: Different applications prioritize different characteristics
- Technology selection should be driven by requirements, not by “newest” or “fastest”
23.11 Key Takeaways
- The Three Ingredients Test is your filter: If a device lacks Thing, Computation, OR Internet connectivity, it’s not IoT regardless of marketing claims
- Connected vs IoT distinction matters for product positioning: Bluetooth-only = connected (proximity); Internet = IoT (global reach)
- The Eleven Characteristics are quality benchmarks, not checkboxes: No device excels at all eleven; prioritize 3-4 based on your use case
- Trade-offs define design decisions: Medical IoT prioritizes Secure+Fast; Agriculture prioritizes Growing+Low Maintenance; Consumer prioritizes On Demand+Upgradable
- Technology selection follows requirements: Choose LoRaWAN for long-range battery-powered sensors, Wi-Fi for high-bandwidth local devices, cellular for mobile assets
- Three Ingredients: Thing plus computation plus internet reach is the minimum IoT filter for any device.
- Connected vs. IoT: Local wireless such as Bluetooth is not the same as global internet reach, which affects classification and positioning.
- Eleven Characteristics: Quality goals are not equal requirements; prioritize the few that fit the domain.
- Trade-offs: No perfect IoT device exists, so match priorities to the use case.
- Technology selection: Requirements should drive connectivity choices, not trends.
23.12 Knowledge Check
23.13 IoT Requirements Quiz
23.14 Eleven Characteristics Selection
Scenario: A hospital system must choose between three remote patient monitoring (RPM) wearable devices for 5,000 chronic heart failure patients. All three meet minimum IoT requirements (Thing + Computation + Internet). Which characteristics matter most, and how do you score them?
The Three Devices:
- Device A: $89, 48-hour battery, 15-minute data interval, FDA cleared, proprietary protocol, and no OTA updates because devices must be returned.
- Device B: $199, 7-day battery, 5-minute data interval, FDA cleared, standard BLE plus FHIR, and automatic OTA updates.
- Device C: $145, 72-hour battery, 1-minute data interval, FDA cleared, standard protocols, and OTA updates with manual approval.
Step 1: Prioritize Characteristics for Healthcare RPM
For a medical wearable with 5,000 deployed devices, which of the 11 characteristics are non-negotiable vs. nice-to-have?
- Secure, critical 9/10: Patient health data needs strong protection; HIPAA compliance is required when the deployment is a covered entity or business associate.
- Fast, high 7/10: Heart failure alerts need less than five-minute latency.
- Low Maintenance, high 8/10: 5,000 devices with frequent battery visits would be unsustainable.
- Upgradable, high 8/10: FDA-required firmware patches and clinical protocol changes must reach the fleet.
- Growing, medium 6/10: The system may expand to 10,000 patients, but not 100,000.
- Adaptable, medium 5/10: Epic EHR integration matters, but the scope is defined.
- Smart, medium 6/10: Local anomaly detection helps, but is not the primary decision driver.
- On Demand, low 4/10: Medical monitoring is periodic, not an instant-response consumer interaction.
- Ubiquitous, low 3/10: The device works at home and clinic, not everywhere.
- Agile, low 4/10: Clinical protocols change slowly.
- Blend into Background, low 3/10: Patients expect visible medical devices.
Step 2: Score Each Device
- Secure, 20%: Device A scores 7/10 because the proprietary design is hard to audit; Devices B and C score 9/10 with standard protocols.
- Fast, 15%: Device A scores 5/10 because 15-minute intervals are too slow; Device B scores 9/10 at five minutes; Device C scores 10/10 at one minute.
- Low Maintenance, 20%: Device A scores 4/10 with a two-day battery; Device B scores 10/10 with a seven-day battery; Device C scores 6/10 with a three-day battery.
- Upgradable, 20%: Device A scores 2/10 because updates require return; Device B scores 10/10 with automatic OTA; Device C scores 7/10 with manual OTA.
- Growing, 10%: Device A scores 4/10 due to vendor lock-in; Devices B and C score 9/10 with open standards.
- Adaptable, 10%: Device A scores 3/10 with proprietary integration; Device B scores 10/10 with FHIR; Device C scores 9/10 with standards but a narrower integration set.
- Smart, 5%: Device A scores 6/10 with basic alerts; Device B scores 8/10 with edge anomaly detection; Device C scores 7/10 with cloud-only processing.
Weighted Scores:
- Device A: (7×0.20) + (5×0.15) + (4×0.20) + (2×0.20) + (4×0.10) + (3×0.10) + (6×0.05) = 4.4/10
- Device B: (9×0.20) + (9×0.15) + (10×0.20) + (10×0.20) + (9×0.10) + (10×0.10) + (8×0.05) = 9.5/10
- Device C: (9×0.20) + (10×0.15) + (6×0.20) + (7×0.20) + (9×0.10) + (9×0.10) + (7×0.05) = 8.1/10
In 60 Seconds: This chapter covers IoT requirements and characteristics, explaining the core concepts, practical design decisions, and common pitfalls that IoT practitioners need to build effective, reliable connected systems.
Step 3: Calculate Total Cost of Ownership (5-Year)
- Hardware for 5,000 devices: Device A costs $445,000; Device B costs $995,000; Device C costs $725,000.
- Battery replacements at $25 per visit: Device A costs $112,500 per year, or $562,500 over five years; Device B costs $6,250 per year, or $31,250; Device C costs $87,500 per year, or $437,500.
- Firmware updates: Device A costs $225,000 for return shipping across three updates; Device B costs $0 with OTA; Device C costs $75,000 for two manual updates.
- Integration: Device A costs $150,000 because of proprietary integration; Device B costs $25,000; Device C costs $40,000.
- Five-year TCO: Device A totals $1,382,500; Device B totals $1,051,250; Device C totals $1,277,500.
Step 4: Calculate Clinical Value
- Early alert detection: Device A catches 72% of events in time, Device B catches 94%, and Device C catches 96%.
- Prevented hospitalizations per 5,000 patients per year: Device A prevents 360, Device B prevents 470, and Device C prevents 480.
- Cost per hospitalization: All three use the same $12,500 avoided-cost assumption.
- Annual savings: Device A saves $4.5M, Device B saves $5.875M, and Device C saves $6.0M.
- Five-year clinical value: Device A produces $22.5M, Device B produces $29.375M, and Device C produces $30.0M.
Decision:
Device B wins on quality score and five-year TCO; Device C has the highest modeled clinical value:
- Highest quality score: 9.5/10 vs. 8.1 (Device C) vs. 4.4 (Device A)
- Lowest TCO: $1.05M vs. $1.28M (Device C) vs. $1.38M (Device A)
- Clinical value: $29.4M (Device B) vs. $30M (Device C) vs. $22.5M (Device A)
Device B costs $110 more per unit than Device A, but saves $331K in 5-year TCO and delivers $6.9M more in clinical value.
Device C has slightly better clinical outcomes ($600K over 5 years) but costs $226K more than Device B and scores lower on critical characteristics (Low Maintenance, Upgradable).
Key Lessons:
-
Not all 11 characteristics matter equally: For medical RPM, 75% of the decision weight comes from just 4 characteristics (Secure, Fast, Low Maintenance, Upgradable). Domain determines priorities.
-
TCO ≠ purchase price: Device A’s $89 price looks attractive, but 5-year TCO is 31% higher than Device B due to battery replacement visits and firmware update logistics.
-
Characteristics predict TCO: Low Maintenance and Upgradable directly correlate with operational costs. Devices scoring poorly on these characteristics always cost more long-term.
-
Weighted scoring prevents bias: Without structured scoring, humans gravitate toward “favorite features.” Device C’s 1-minute data frequency is impressive but matters far less than Device B’s 7-day battery and auto-OTA for a 5,000-device deployment.
Application to Your Projects:
- List the 11 characteristics
- Prioritize 3-4 as non-negotiable for your domain
- Assign weights summing to 100%
- Score each option on the prioritized characteristics
- Calculate weighted total + TCO + domain-specific value
- Document the rationale for the decision
This framework prevents “gut feel” decisions and ensures the right trade-offs for your use case.
 Checkpoint: Weighted Decisions
You now know:
- In medical RPM, 75% of the decision weight comes from four characteristics: Secure, Fast, Low Maintenance, and Upgradable.
- Device B wins on quality score (9.5/10) and five-year TCO ($1.05M); Device C has the highest modeled five-year clinical value ($30M vs. Device B’s $29.375M).
- A structured score, TCO, and value calculation can overturn the tempting $89 purchase price of Device A.
The final data-flow section ties the chapter back to architecture: every requirement has to land somewhere in the physical, edge, connectivity, cloud, or application layer.
23.15 IoT Data Flow Layers
The big picture: IoT systems move data through five architectural layers — Physical, Edge, Connectivity, Cloud, and Application — with each layer transforming raw sensor readings into actionable user value.
Step-by-step breakdown:
- Physical Layer (Data Capture): A smart thermostat’s temperature sensor (DHT22) measures 18.3°C every 30 seconds — Real example: generates 2,880 readings per day, each 2 bytes = 5.76 kB/day raw data
- Edge Layer (Local Processing): The thermostat’s microcontroller (ESP32) averages the last 10 readings, detects “temperature dropping 0.3°C/hour” trend, and flags “heat needed soon” — Real example: reduces data from 2,880 points to 288 aggregated readings (10x compression) before transmission
- Connectivity Layer (Data Transmission): Wi-Fi sends the aggregated reading + trend flag to AWS IoT Core via MQTT protocol — Real example: 50-byte payload transmitted every 5 minutes = 14,400 bytes/day, a 10x reduction versus sending the same 50-byte payload every 30 seconds
- Cloud Layer (Intelligence and Storage): AWS Lambda function compares current pattern against 6 months of historical data (about 52,000 five-minute aggregates per thermostat over six months), ML model predicts “optimal heating start time is 6:15 PM for 7:00 PM comfort” — Real example: processes data from 1 million+ thermostats simultaneously, generating personalized schedules
- Application Layer (User Value): Mobile app displays “Heating starts in 15 min” notification and shows “You’ll save $12 this month vs. always-on heating” — Real example: 30% energy savings ($180/year) delivered through optimized scheduling based on learned patterns
Why this matters: Understanding this data flow reveals where processing should happen. Sending every 30-second reading in a 50-byte payload would use 144 kB/day, while aggregating to one such payload every five minutes uses 14.4 kB/day, a 10× reduction in transmitted payload bytes. At a hypothetical fixed price per byte, a $2/month transfer charge would fall to $0.20/month. Actual Wi-Fi and cloud charges depend on the service and protocol overhead. Edge aggregation can therefore reduce traffic and sometimes cost.
23.16 Concept Relationships
- Three Ingredients Test -> IoT Introduction: Thing, computation, and internet reach expand into minimum requirements.
- Eleven Characteristics -> IoT Perspectives: Different stakeholders prioritize different characteristics.
- Architecture Layers -> Reference Architectures: The five-layer model expands into complete system design patterns.
- LoRaWAN for Agriculture -> LoRa and LoRaWAN: LPWAN technology selection explains the warehouse and field-monitoring examples.
- Connectivity Selection -> Protocol Comparison: The same framework helps choose Wi-Fi, LoRaWAN, cellular, or a gateway pattern.
23.17 See Also
Continue the IoT Overview Series:
- IoT Introduction - The Three Ingredients Test that defines minimum requirements
- IoT Perspectives - How stakeholders prioritize different characteristics
- Device Evolution - How Embedded → Connected → IoT progression builds capability
Architecture Deep Dives:
- Reference Architectures - Complete system design patterns for all five layers
- Edge Computing - Local processing to meet Fast and Low Maintenance characteristics
Connectivity Selection:
- Wi-Fi for IoT - When to use Wi-Fi (local high-bandwidth)
- LoRa and LoRaWAN - When to use LPWAN (long-range, battery-powered)
- Cellular IoT - When to use NB-IoT/LTE-M (mobile assets)
23.18 What’s Next
- Next: Common Pitfalls explains mistakes to avoid when choosing vendors, architectures, and deployment assumptions.
- Previous: IoT Perspectives compares how different stakeholders weight these same characteristics.
- Related: IoT Perspectives reinforces stakeholder trade-off analysis.
- Advanced: Device Evolution revisits the embedded -> connected -> IoT progression through a capability lens.
- Hub: Simulation Playground collects interactive IoT protocol experiments.
23.19 Continue Your Route
This final part closes the route from Visual Bridge: From 5 Layers to 7 through What’s Next. Return to IoT Requirements: Connectivity Costs and Trade-Offs or continue from the applications module index.