33 IoT Business Models: Platforms and Revenue Strategy
More
Depth: Practitioner
Progress saves as you read. Mark sections complete as you go; your progress appears in the sidebar.
- Podcast audio coming soon
- Character narration audio coming soon
33.1 Build a Model That Funds the Service
An IoT business model connects a customer outcome to a payment and the work needed to keep delivering it. A connected service may have a clear outcome and a pricing idea, yet still depend on device makers, developers, connectivity providers, and support partners whose costs must be covered. This chapter follows who creates and captures value, then tests whether the chosen revenue model survives churn, delivery costs, and platform risk.
Keep the smart thermostat company in view. It sells a $249 device without a subscription and is considering a $149 device with $9.99/month energy analytics. Lowering the upfront price creates an immediate funding gap; offering analytics creates continuing cloud and support obligations. A subscription label alone cannot establish whether that trade improves the business.
This is part 2 of 2; IoT Business Models: Value and Recurring Revenue establishes the first route. Here, we trace ecosystem payments, compare recurring and transaction models, then use the thermostat to test lifetime contribution against acquisition cost. The problem is to fund every required role while retaining enough margin. Start with the value flow, then choose and test the revenue mechanism.
KEY CONCEPTS
- Ecosystem balance
Trace who creates value, who pays, and which partners must be funded.
- Revenue mechanism
Compare one-time sales, subscriptions, conversion, and data products.
- Lifetime contribution
Include retention and delivery costs before comparing LTV with CAC.
- Controllable risk
Match the service promise to evidence and the supplier’s exposure.
33.2 Learning Objectives
By the end of this chapter, you will be able to:
- trace value and revenue through an IoT ecosystem
- compare platform effects and recurring revenue models
- test LTV:CAC, risk, and model-selection assumptions
33.3 Fund Each Role in the Ecosystem
For the thermostat, a customer payment must sustain more than the device maker. A network effect occurs when participation on one side of a platform changes its usefulness to others. Device variety can attract developers; useful apps can attract consumers; consumer demand can encourage further device support. The same links can transmit decline when participants leave.

Start at the central IoT Business, then follow each revenue path to the offer funded. Hardware Sales funds deployed products through transactions. Subscriptions funds continuing cloud capability through recurring payments. Data Licensing funds information, and API Access funds integration. Each needs a defensible product. Professional Services funds high-touch delivery and can also rely on transactions. Each path supports a different kind of offer. More participants help commercially only when they improve these offers without delivery costs growing faster than revenue.
IoT Value Proposition Framework:
| Stakeholder | Revenue Model | Value Contribution |
|---|---|---|
| Device Manufacturers | Hardware sales, volume | Generates sensor data |
| Platform Operators | Transaction fees 15-30% | Processes and analyzes data |
| Connectivity Providers | Data usage fees | Stable network traffic |
| App Developers | App revenue 70-85% | Delivers user experience |
| End Customers | Pay for value | Receives services |
The value flow starts with device sensors collecting information. Cloud or edge analytics process the raw data, then extract actionable insights. Service delivery turns those insights into the customer’s experience. Revenue sharing must align the incentives of the stakeholders responsible for each step.
Revenue sharing gives the participants a reason to stay, but the split must leave enough to operate the service. Platform transaction fees of 15–30% can compound at scale while putting pressure on the other sides. Inspect the separate activity to test balanced participation among device makers, app developers, and consumers.
The simulator is a model of assumed relationships, not proof that platform value grows exponentially or that a particular loss guarantees collapse. Use its outputs to ask which revenue path the activity funds and what evidence would confirm the connection.
33.4 Follow a Payment Before Comparing Models
The stakeholder map explains roles; following one payment tests what remains after those roles are funded. In the illustrated subscription, the customer pays $50/month. The platform receives 20% ($10), the developer receives 50% ($25), connectivity costs 10% ($5), and support costs 10% ($5). The remaining 10% ($5) is the illustrated margin. Those shares total $50 and 100%, or $600 a year.
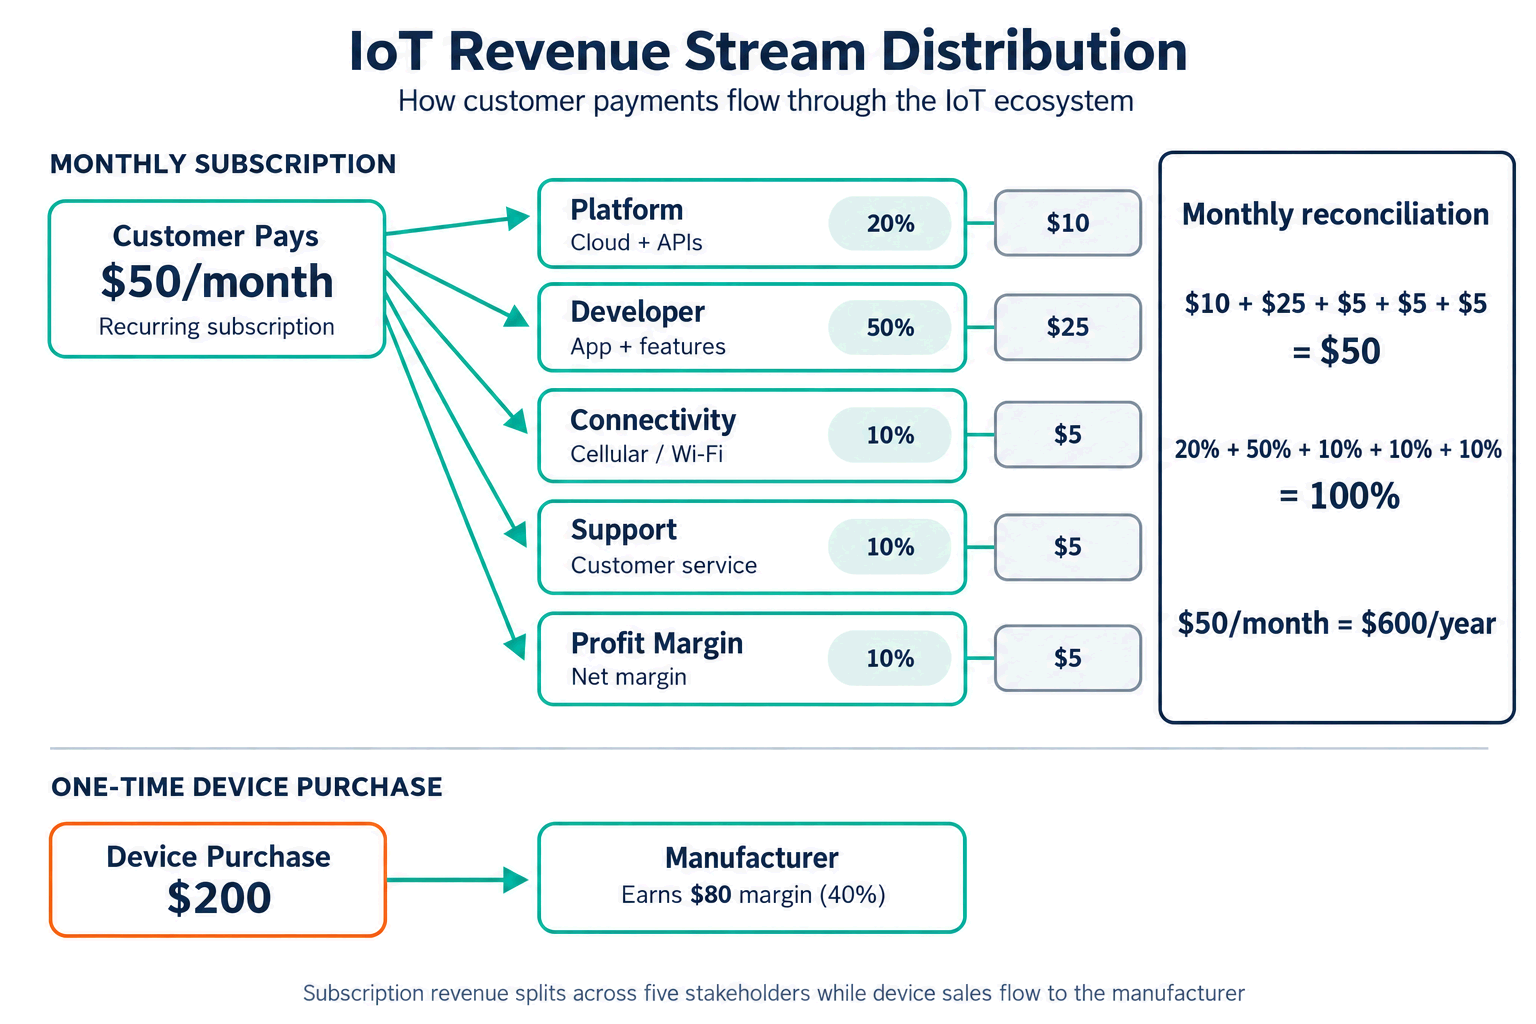
The separate $200 one-time device purchase gives the manufacturer an $80 margin (40%). These are worked assumptions, not benchmark rates. The device sale and subscription have different cost and cash-flow shapes: required ecosystem roles must be funded in either case. The thermostat team should distinguish the payment collected from the amount left to cover acquisition and other obligations.
That distinction also guides architecture. Edge-Fog Computing helps locate processing costs, while Cloud Computing explains the service models behind continuing delivery. A cheaper device does not remove those obligations.
33.5 Choose a Revenue Hypothesis and Test Its Assumptions
With the payment split explicit, compare what the customer continues to receive. Product-as-a-Service charges for an ongoing service or outcome; the customer may own or lease the asset. Freemium supplies basic features free and charges for premium analytics or automation. Neither makes continuing income automatic.

Start with delivered value. Continuous data plus a need for real-time insight points toward a subscription service; batch insights suggest selling an aggregated data product. Without continuous data, ongoing cloud needs suggest a free basic tier with paid premium features. Otherwise the tree asks whether usage can be metered, pointing toward outcome-based pricing tied to measurable results or a traditional hardware sale. Metering alone does not validate an outcome promise: every endpoint still needs willingness-to-pay, privacy, cost, and risk evidence.
The comparison activity separates the payment mechanisms; its revenue totals must still be checked against delivery costs. Read the printed assumptions in the next figure before comparing its results.

Distinguish the lifetime receipts in these illustrations from lifetime value (LTV) measured as expected contribution before acquisition cost. Customer acquisition cost (CAC) is the cost of acquiring one customer.
Revenue Streams Comparison:
| Business Model | Pricing Structure | Revenue and period | Key Metric |
|---|---|---|---|
| Traditional | $200 hardware sale | $200 over 3 years | One-time revenue |
| Product-as-a-Service | Device included + $50/month | $1,800 over 3 years | 9x traditional revenue |
| Freemium Platform | Free + $10/month premium (12% convert) | $14.40 annual ARPU | Scales with users |
| Data Monetization | Free device, sell insights | $5-50/user/year | Grows with data volume |
Here ARPU means average revenue per user. At $10/month and 12% conversion, freemium generates $1.20 per total user per month, or $14.40 per year; the table’s ARPU is annual, unlike the three-year hardware and service totals. Data monetization’s $5–50/user/year is also annual. The service’s $1,800 is nine times $200 in gross revenue, rather than evidence of nine times the contribution or profit.

Follow the customer across three years. The traditional path collects its $200 on Day 1. The service has a $0–$50 upfront barrier and collects $600 each year at $50/month, totaling $1,800 while carrying cloud, support, reliability, and retention obligations. A one-time sale does not inherently end the customer relationship; the contrast here concerns the illustrated payment paths. The value stack in Part 1 makes the same condition explicit: recurring income needs continuing value and controlled costs.
For another nominal comparison, $10/month for 36 months produces $360 versus a $200 sale: $160, or 80%, more before churn and costs. Pricing Strategies develops subscription prices and freemium tiers; Monetizing Data examines the pricing of information products. Data Management supplies context for the data value those products depend on.
33.6 Test the Thermostat Against Acquisition Cost
The thermostat now turns the model choice into arithmetic. Compare expected lifetime contribution before acquisition cost with CAC; a revenue-only proxy cannot answer the same question. The subscription attach rate is the share of device buyers who take the paid plan, and monthly churn is the share of subscribers lost each month.
Scenario: A smart thermostat company currently sells devices for $249 with no subscription. They are evaluating a shift to a $149 device with a $9.99/month energy analytics subscription.
Current Model Metrics:
- Device price: $249 (one-time)
- Manufacturing cost: $110
- Customer acquisition cost (CAC): $85 (Google Ads, affiliate marketing)
- Hardware contribution before CAC: $249 - $110 = $139
- Contribution after CAC: $139 - $85 = $54 (no recurring revenue)
- LTV:CAC = $139 / $85 = 1.64:1 (below the chapter’s 3:1 planning target)
Proposed Subscription Model:
- Device price: $149
- Subscription: $9.99/month
- Average customer lifetime: 28 months (the scenario’s planning assumption)
- Monthly churn rate: 3.5%
- Subscription attach rate: 35% of buyers
Step 1 - Calculate the pre-service-cost amount:
- Hardware margin: $149 - $110 = $39
- Subscription receipts (for 35% who subscribe, before delivery costs): $9.99 x 28 months x 0.35 = $97.90
- Simplified pre-CAC amount before recurring service delivery costs: $39 + $97.90 = $136.90
Step 2 - Calculate the amount/CAC proxy:
- Simplified amount/CAC proxy = $136.90 / $85 = 1.61:1 (still below 3:1 target)
This proxy omits recurring delivery costs: include subscription delivery and support costs before comparing it with the hardware contribution model.
Step 3 - Identify improvement levers:
| Lever | Action | Impact before service costs | New amount/CAC proxy |
|---|---|---|---|
| Reduce churn | Add usage alerts, seasonal tips | Extend lifetime to 36 months | $39 + ($9.99 x 36 x 0.35) = $165 → 1.94:1 |
| Increase attach rate | Bundle 3 months free | 35% → 50% attach rate | $39 + ($9.99 x 28 x 0.50) = $179 → 2.11:1 |
| Reduce CAC | Referral program | CAC drops to $60 | $136.90 / $60 = 2.28:1 |
| Combination | All three together | Amount $219, CAC $60 | 3.65:1 before service costs |
No single listed change clears the 3:1 target. Together, 36 months, 50% attach, and $60 CAC give $39 + ($9.99 × 36 × 0.50) = $218.82, about $219, and a 3.65:1 proxy. Usage alerts and seasonal tips, onboarding bundles, and referrals are hypotheses to test. The three-month-free offer must also be costed rather than assumed to produce 28 fully paid months. Clearing the proxy is a reason to investigate further; recurring delivery and support costs can still pull contribution LTV below the target.
A separate example uses $450 lifetime value and $120 CAC, giving 3.75:1. If the $450 is revenue rather than contribution, even that apparently strong ratio leaves viability undetermined. The ratio cannot by itself ensure a healthy margin or a successful launch. Financial Metrics and Analysis develops contribution, churn, and payback calculations in more detail.
33.7 Account for Retention Before Forecasting Lifetime Value
The thermostat’s 28-month planning lifetime and 3.5% monthly churn are related assumptions. Before extending the lifetime to 36 months, distinguish receipts from a customer who actually stays from the expected contribution of a new paying customer. The detail derives the survival-weighted calculation; the audit follows the chapter’s numbers.
A customer who actually pays for 36 months generates 36 × $9.99 = $359.64, about $360, in receipts. The forecasting mistake is assuming every new paying customer will do so. With constant 3.5% monthly churn, about 27.7% remain after 36 months; each future month’s contribution must be weighted by survival probability.
LTV = Σ(month=1 to ∞) [(Monthly_Revenue × Gross_Margin) × (1 − Churn_Rate)^(month − 1)].
For $9.99/month, 70% gross margin, and 3.5% churn, expected contributions are:
- Month 1: $9.99 × 0.70 × 0.965^0 = $6.99.
- Month 12: $9.99 × 0.70 × 0.965^11 ≈ $4.73.
- Month 36: $9.99 × 0.70 × 0.965^35 ≈ $2.01.
The infinite series gives $199.80, approximately $200, of subscription contribution per starting paying customer. For positive monthly churn below 100%, the constant-churn infinite-horizon formula is exactly (Monthly_Revenue × Gross_Margin) / Monthly_Churn_Rate, apart from rounding. This follows the geometric-series identity explained by OpenStax. There is no 5% churn cutoff. Keep this paying-customer calculation separate from the thermostat’s all-buyer proxy, which also includes hardware contribution and a 35% attach rate.
33.8 Match the Promise to Risks You Can Control
Once the math is explicit, test the stories that can make the model look stronger on a slide than it behaves in operation.
Misconception 1: “Build the hardware first, monetize later.” Many startups invest heavily in device hardware and firmware, then try to bolt on a subscription model as an afterthought. The result is a device that functions perfectly without the paid service, giving customers no reason to subscribe. Recurring revenue must be designed into the product architecture from day one — the device should become more valuable with the service, not merely functional without it.
Misconception 2: “More users automatically means more revenue.” Platform business models depend on network effects, but raw user counts are vanity metrics. At equal revenue per paying user, a platform with 1 million free users and 0.5% conversion generates less revenue than one with 100,000 users and 12% conversion. The critical metric is not total users but the conversion rate from free to paid tiers, combined with average revenue per paying user. Keep that paying-user denominator separate from ARPU across all users.
Misconception 3: “Selling raw data is a viable business model.” Companies routinely overestimate the value of their raw IoT data and underestimate the effort required to monetize it. Raw sensor readings can be sold, but derived insights may offer additional value to buyers. Data monetization review The value lies in derived insights — anomaly patterns, predictive models, benchmarking indices — which require analytics investment. Furthermore, selling raw data to brokers risks losing competitive advantage and invites privacy and compliance issues (especially under General Data Protection Regulation (GDPR), where IoT data often qualifies as personal data).
Misconception 4: “Low churn means the product is great.” Low churn can indicate genuine product value, but it can also indicate that customers are locked in by switching costs, long contracts, or integration complexity rather than satisfaction. Involuntary retention creates fragile revenue: these customers churn catastrophically when contracts expire or alternatives emerge. Measure Net Promoter Score (NPS) alongside churn to help distinguish loyal customers from trapped ones; low churn alone cannot make that distinction.
Misconception 5: “Outcome-based pricing is always superior.” While outcome-based models (e.g., pay-per-unit-saved) align vendor and customer incentives, they also shift measured-outcome risk toward the vendor. If external factors (weather, market conditions, user behavior) affect outcomes, the vendor absorbs losses that are not their fault. Outcome-based pricing works best when the vendor has strong control over the variables that drive the outcome and when baselines can be accurately measured.
Revenue potential is only one axis of a model decision; the supplier’s exposure changes with the promise being made. Use Figure 6 to compare model positions vertically by potential customer lifetime value and horizontally by vendor risk, then follow the diagonal commitment arrow.

Read Figure 6 from the hardware-sale corner toward the models with greater illustrated commitment. Subscription and data models move toward continuing delivery and governance obligations, while outcome-based pricing places more of the measured-result risk on the supplier. The positions are a reasoning aid, not empirical guarantees. They close the running narrative: choose the revenue mechanism only after matching the service promise, evidence boundary, controllable risks, and economics.
Use Case Studies: Real-World Transformations to compare Philips lighting-as-a-service, Amazon Echo voice-assistant ecosystems, and John Deere data monetization. IoT Use Case Studies connects revenue examples to evidence. Before scaling the thermostat, Go-to-Market Strategy adds B2B sales cycles, launch choices, and pilot-to-scale frameworks.
For further business-model quizzes, use the Learning Hubs.
Summary
Six primary models—Product-as-a-Service, platform, data monetization, freemium, outcome-based pricing, and razor-and-blade—combine payment and customer relationships differently. Razor-and-blade subsidizes hardware to support recurring ecosystem income. The four-stage progression from product sale through connected product and service to outcome-based pricing increases the continuing promise; a platform ecosystem adds multi-sided participation rather than guaranteeing a higher return.
Continuous data enables analytics, insights, and service delivery beyond hardware that may commoditize. Its value depends on a useful offer, permission to use it, and the investment needed to deliver it. Balanced ecosystem participation can improve that offer; departures can trigger negative effects. The thermostat shows why neither more users nor recurring revenue settles viability: LTV, CAC, ARPU, attach rate, and churn must be tied to contribution and evidence. There is no universal 5–9× revenue or profit multiplier.
Use these planning ranges as questions for validation, rather than universal guarantees:
| Metric | Planning range or comparison | Warning to investigate |
|---|---|---|
| LTV:CAC | 3:1 to 5:1 | Below 3:1 misses this chapter’s viability target. |
| Freemium conversion | 3–5% good; 8–12% great in ChartMogul’s SaaS sample | Compare low conversion with the product’s own cohort. |
| Monthly churn | Example range: 2–5% | Churn above plan requires retention evidence. |
| Payback period | Example range: 12–18 months | Above 24 months, check capital needs. |
Choose the model that funds a useful continuing outcome and its partners. A revenue multiplier becomes a business case only after retention, delivery costs, acquisition, and controllable risks support the contribution.
