16 IoT Evolution: Technology Cycles and Convergence
16.1 Start With the Decision
A tenfold gain can change which system design is practical. The cycle model must show the driver and the point where technologies meet.
16.2 Route Overview
This is part 2 of 2. Review IoT Evolution: Systems Foundations for the preceding evidence.
16.3 Learning Objectives
- Apply the 10x technology cycle pattern to IoT examples.
- Explain convergence through cost, compute, and network drivers.
16.4 Chapter Roadmap
- The 10x Technology Cycle Pattern
- The Two Drivers of Each Technology Cycle
- Checkpoint: 10x Cycle
- MVU: IoT Value Creation
- IoT Market Growth Impact
- MVU: The Platform Economics of IoT
- Five Phases of IoT Evolution
- What Changed Between Phases
- Checkpoint: Connectivity Phases
- Knowledge Check: Technology Cycles
- How Technology Convergence Expanded IoT Options
- Two Laws Behind Computing
- Dennard scaling and the mid-2000s power wall
- Mid-2000s power-efficiency pivot
- Continue to Part 2
16.5 The 10x Technology Cycle Pattern
This stylized sequence depicts large increases in device scale between computing eras; it is not a measured growth rule or a forecast.
Key insights from this growth trajectory:
- Mainframe Era (1960s): ~10^3 devices globally - room-sized computers costing $1M+, accessible only to governments and large corporations
- Personal Computer Era (1980s): ~10^6 devices - desktop machines at $2,000, bringing computing to businesses and homes (1,000x increase)
- Mobile Phone Era (2000s): ~10^9 devices - pocket-sized smartphones at $200, making connectivity ubiquitous (1,000x increase again)
- IoT Era (2030s forecast): about 39 billion active connected IoT devices in 2030 and more than 50 billion by 2035, spanning homes and industry; a $2 sensor is an illustrative component price, not the average price or count definition for those connections.
The Economics Driving This Growth:
These illustrative comparisons show changes in cost, size, and functionality:
- Falling example prices: $1M mainframe -> $2,000 PC -> $200 phone -> $2 sensor (500x, 10x, and 100x reductions between these examples).
- 10x size reduction: Room -> Desktop -> Pocket -> Embedded (disappears into objects)
- 10x functionality increase: Calculation -> Documents + Internet -> Apps + Camera -> AI + Sensing + Control
Lower cost and smaller form factors have expanded computing into more objects over time.
Figure 16.1 shows the four eras as overlapping curves rather than one line, which is what makes the pattern readable.
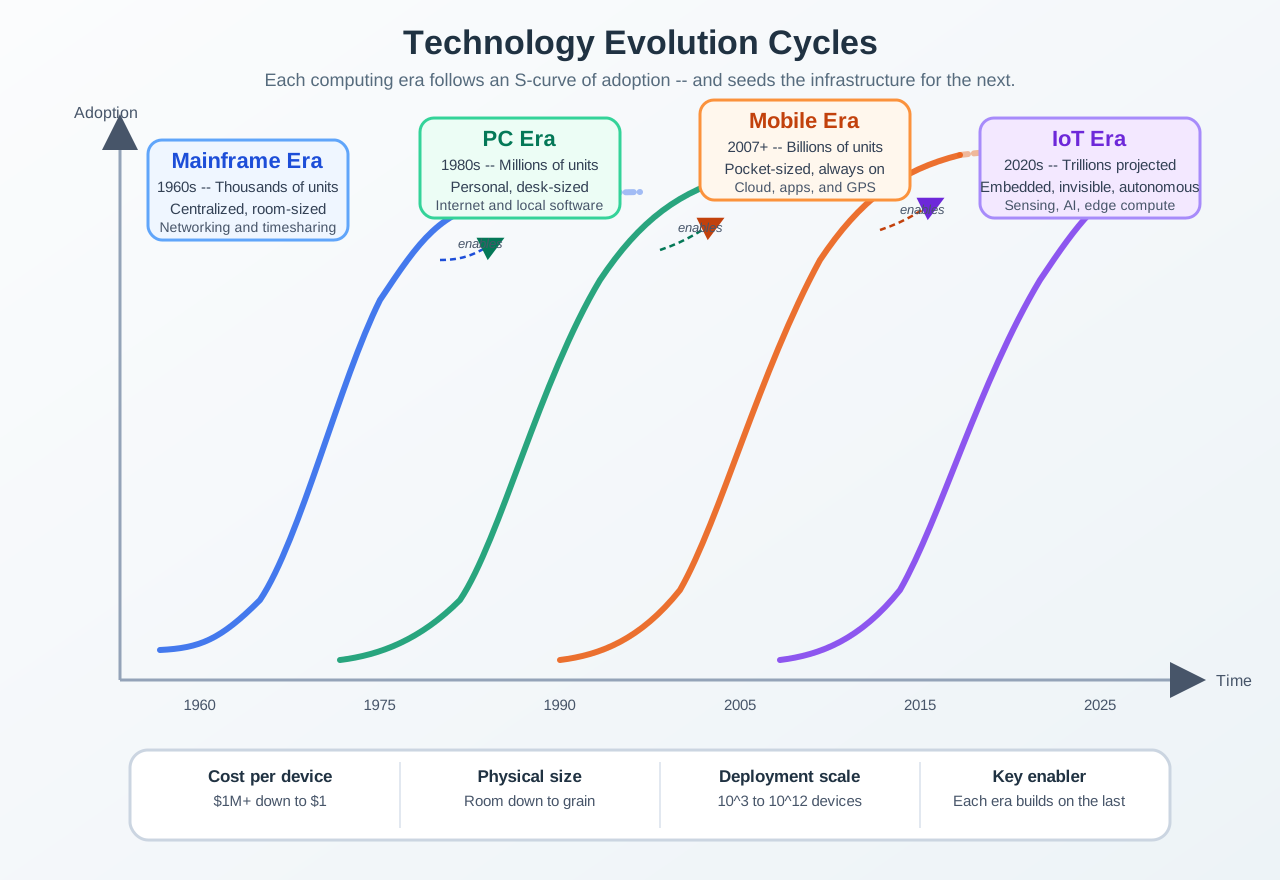
Each era rises, flattens, and is overtaken, and the short arrows between the curves carry the word that matters: enables. The mainframe did not so much lose to the PC as pay for it, and the same relationship repeats through mobile and then to embedded devices. Read the three rows underneath for the mechanism. Cost per device falls from over a million to about one, physical size goes from a room to something granular, and deployment scale climbs by nine orders of magnitude. Figure 16.1 supports the claim that IoT continues a pattern rather than breaking one, and that the next curve is probably being paid for by this one.
Historical Technology Cycles and Scale:
| Era | Decade | Typical Units | Price Point | Key Innovation |
|---|---|---|---|---|
| Mainframe | 1960s | ~1 Million | $1M+ | Centralized computing for enterprises |
| Minicomputer | 1970s | ~10 Million | $100K | Departmental computing |
| Personal Computer | 1980s-90s | ~100 Million | $2-5K | Individual computing power |
| Desktop Internet | 1990s-2000s | ~1 Billion | $500-1K | Global information access |
| Mobile Internet | 2010s | ~5 Billion | $200-500 | Computing in your pocket |
| Internet of Things | 2020s-30s | ~20-40 Billion | $1-100 | Computing in everything |
16.6 The Two Drivers of Each Technology Cycle
1. Lower Price: Each cycle makes computing 10-100x cheaper per unit
- Mainframe: $1M per computing unit
- PC: $2,000 per computing unit
- Smartphone: $200 per computing unit
- IoT sensor: $1-10 per computing unit
2. Improved Functionality and Services: Each cycle enables new use cases
- PCs enabled individual productivity
- Internet enabled global communication
- Mobile enabled always-on connectivity
- IoT enables ambient intelligence in physical environments
IoT is the logical continuation of this pattern - bringing computation to the remaining 99% of physical objects that were previously “dumb.”
 Checkpoint: 10x Cycle
You now know:
- The chapter treats the 1960s mainframe, 1980s PC, 2010s smartphone, and IoT sensor eras as order-of-magnitude comparisons, not forecasts.
- The classroom pattern moves from about $1M mainframes to $2K PCs, $200 phones, and few-dollar sensors.
- The design lesson is placement economics: cheaper endpoints add options near the physical process, while cloud and human workflows still matter.
16.7 MVU: IoT Value Creation
Core Concept: IoT can extend a one-time product sale into an ongoing service relationship. Data analytics, predictive insights, and ecosystem integration may add value, but lifetime revenue and gross-profit multiples depend on device price, service cost, and retention; there is no universal 5–9× outcome.
Why It Matters: 90% of IoT value comes from analytics and services, not just connectivity. A connected device without compelling data insights is just a gadget with Wi-Fi. Business models must capture value from data generated over years of device operation.
Key Takeaway: When evaluating IoT opportunities, ask: “What recurring value does the data enable?” not just “Can we connect this device?” Success requires both compelling hardware AND sustainable data-driven services.
16.8 IoT Market Growth Impact
Global IoT Deployment Statistics (2025):
Market Size and Growth:
- $1.5 trillion global IoT market value (2025)
- 18-21 billion connected IoT devices deployed worldwide (IoT Analytics/Statista 2025)
- 14% YoY growth in IoT connections (IoT Analytics 2025)
- $11 trillion projected economic value by 2030 (McKinsey Global Institute)
- 40+ billion IoT devices projected by 2034 (Statista)
Industry-Specific Adoption Rates:
- Manufacturing: 87% of enterprises use IoT for predictive maintenance (Gartner)
- Healthcare: 64% of providers deploy remote patient monitoring (Deloitte)
- Agriculture: 60% of commercial farms use precision farming IoT (USDA)
- Energy: 73% of utilities implement smart grid IoT solutions (IEA)
Quantified Business Benefits:
- 25-40% reduction in equipment downtime with predictive maintenance
- 30% average energy savings in IoT-enabled smart buildings
- $200 billion annual cost savings in manufacturing through IIoT (Industrial IoT)
- 50% reduction in water waste with smart irrigation systems
- 20-30% improvement in supply chain efficiency with IoT tracking
Real Company Examples:
- Amazon: 200,000+ IoT-enabled robots in fulfillment centers, processing 5 billion items annually
- John Deere: 1.5 million connected tractors, generating $3 billion in precision agriculture revenue
- Philips Healthcare: 15 million connected medical devices, improving patient outcomes by 18%
- Nest (Google): 40 million smart thermostats deployed, saving users $2.8 billion in energy costs
16.9 MVU: The Platform Economics of IoT
Core Concept: IoT follows a “platform economics” pattern where value increases exponentially with the number of connected devices. Unlike standalone products, IoT systems exhibit network effects: each additional device makes the entire network more valuable. A single smart thermostat saves energy; a network of thousands enables city-wide demand response worth millions.
Why It Matters: The 10x growth pattern is not just a historical curiosity — it’s a guide for strategic investment. Companies that understand the platform economics of IoT can position themselves at inflection points. The shift from selling hardware ($50 one-time) to selling data services ($5/month for 10 years = $600 lifetime value) represents a 12x revenue multiplier.
Key Takeaway: When evaluating IoT markets, look for the next “10x cost reduction” that will unlock a new device category. The current frontier: sub-$1 wireless sensors with 10-year battery life are enabling massive-scale environmental monitoring, structural health sensing, and precision agriculture that was economically impossible even 5 years ago.
16.10 Five Phases of IoT Evolution
Each phase in the evolution of IoT built on the capabilities and infrastructure of the previous phase. Understanding this progression helps explain why IoT requires such a diverse technology stack and why interoperability remains a challenge.
Phase 1: Network (1969-1990)
The initial phase involved connecting two or more computers to form basic networks, allowing direct communication between hosts. ARPANET, the precursor to the internet, connected just four university nodes in 1969. Key developments included TCP/IP protocol standardization (1983) and the establishment of packet-switched networking as the dominant paradigm. Devices were expensive, specialized, and operated by trained technicians.
Phase 2: The Internet (1991-2006)
The introduction of the World Wide Web by Tim Berners-Lee (1991) connected large numbers of computers globally, enabling unprecedented access to information and services. HTTP/HTML standardized how information was shared. E-commerce, email, and search engines created new economic models. By 2000, there were approximately 400 million internet users — but connectivity still required sitting at a desk with a wired connection.
Phase 3: Mobile Internet (2007-2012)
With the proliferation of mobile devices, the internet expanded beyond desktops. The iPhone (2007) and Android ecosystem demonstrated that always-on connectivity was viable and desirable. 3G/4G networks provided bandwidth for mobile apps. App stores created a new software distribution model. By 2012, mobile internet usage began to surpass desktop usage — computing was no longer place-bound.
The mobile shift also changed what an “application” could mean. A phone combined processors, graphics, signal processing, location, camera, motion sensors, short-range radios, cellular service, storage, and a user account in one carried object. Apps could then compose those capabilities into services such as maps, field notes, mobile payments, ride sharing, or StoryCorps-style audio storytelling. For IoT teams, this is the bridge from voice-centered telephony to feature-centered systems: start from the problem, then decide whether phone location, camera, accelerometer, microphone, network reach, or cloud storage is the smallest evidence path that supports the user job.
Phase 4: Social + Cloud Integration (2004-2015)
This phase marked the integration of people into the internet via social networks (Facebook 2004, Twitter 2006) and cloud platforms (AWS 2006, Azure 2010). The combination of mobile devices, social identity, and cloud computing created a “digital twin” of human social behavior. Cloud APIs made it possible for any device to store and process data remotely without dedicated infrastructure.
Phase 5: Internet of Things (2010-present)
The current stage involves connecting everyday objects to the internet, transforming them into interconnected devices capable of communicating with each other and their environments. Unlike previous phases that connected people to information, IoT connects things to each other and to people. This creates fundamentally new capabilities: physical environments that sense, reason, and act autonomously.
Inspect Figure 16.2 to see what a product gains as it moves from embedded intelligence to connection and then to a full IoT feedback loop.
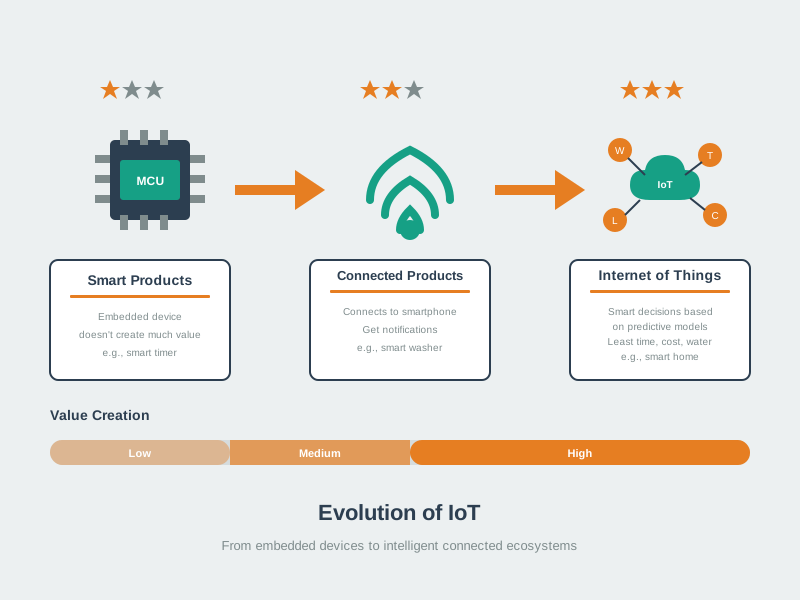
Read Figure 16.2 from left to right. A smart product can use an MCU to sense or control locally without any network. A connected product adds communication, which lets another system observe or command it, but connection alone does not create an IoT service. The final stage joins sensing, data feedback, and automation so observations can improve the next action. That progression matters because each step adds dependencies and operating cost; a design should stop at the stage required by the outcome rather than treating connectivity as the goal.
Inspect Figure 16.3 to see which entities each network era connected and which earlier capabilities IoT still depends on.
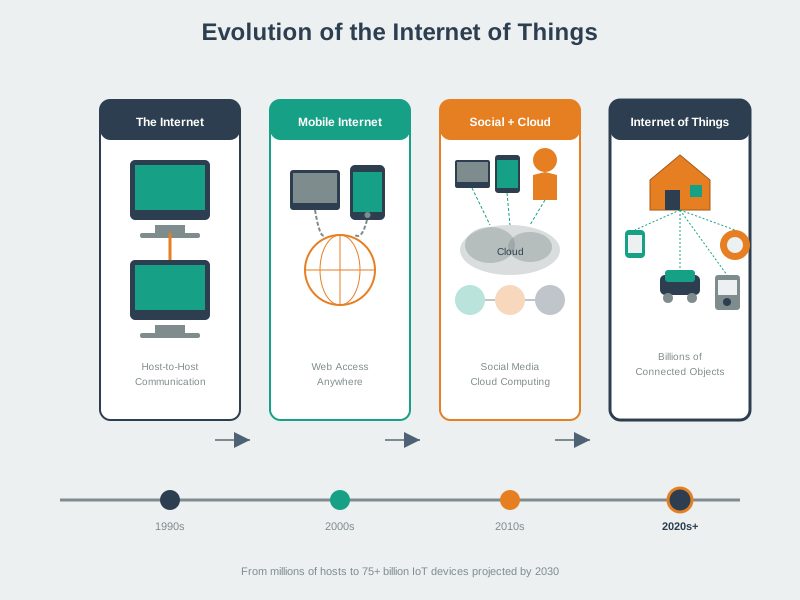
Follow Figure 16.3 from computers communicating directly, through people reaching information and then using mobile access. Social and cloud systems connect people to services and provide shared APIs. IoT adds things that sense, reason, and act with people and with other systems. The dates mark a conceptual order, not clean replacement points: each phase carries Internet protocols, mobile networks, and cloud platforms forward. The final step is distinct because sensing and actuation close a physical feedback path, not because earlier infrastructure disappears.
16.11 What Changed Between Phases
Use this what changed between phases section as a guided decision record, not as a list to memorise. First identify the stated input, assumption, or scenario; then compare each option on the same units and time boundary. Next check which value changes the outcome and which evidence would reveal an invalid assumption. For what changed between phases, the useful result is the reasoning chain: observed condition, governing constraint, calculation or classification, and operational consequence. Record that chain before choosing an answer or carrying a value into the next section. Where the panel supplies several choices, reject each distractor against the chapter’s named mechanism instead of relying on wording cues. Where it supplies a table or timeline, compare rows at like-for-like scale and preserve the difference between an early indication, an actionable threshold, and a final outcome. This turns what changed between phases into evidence that can be reviewed, recalculated, and connected to the running design narrative.
The critical insight is what type of entity got connected in each phase:
| Phase | What Got Connected | Communication Pattern | Scale |
|---|---|---|---|
| Network | Computers to computers | Machine-to-machine (fixed) | Dozens |
| Internet | People to information | Human-to-content (desktop) | Millions |
| Mobile | People to internet (anywhere) | Human-to-cloud (mobile) | Billions |
| Social+Cloud | People to people + services | Human-to-human + APIs | Billions |
| IoT | Things to things + people | Machine-to-machine (autonomous) | Tens of billions |
Each phase didn’t replace the previous one — it built on top of it. IoT devices use internet protocols (Phase 2), connect via mobile networks (Phase 3), store data in cloud platforms (Phase 4), and add physical-world sensing and actuation (Phase 5).
Checkpoint: Connectivity Phases
You now know:
- The chapter’s phase story starts with ARPANET in 1969 and the Web in 1991 before mobile and cloud made always-connected services normal.
- IoT differs from earlier phases because it connects things to things plus people, not only people to information.
- Each phase remains part of the stack: protocols, mobile links, cloud APIs, sensing, and actuation combine rather than replacing one another.
IoT Evolution Timeline:
| Era | Year | Milestone | Key Developments |
|---|---|---|---|
| Network Era | 1969 | ARPANET | TCP/IP established, 2-4 computers, Military/academic use |
| Internet Era | 1991 | World Wide Web | HTTP/HTML standards, Millions of PCs, E-commerce emerges |
| 1999 | IoT Term Coined | Kevin Ashton names “IoT”, RFID supply chains, Early M2M | |
| Mobile Internet | 2007 | iPhone Launch | 3G/4G networks, Mobile apps ecosystem, Smartphones ubiquitous |
| Early IoT | 2010 | Connected-device growth | Cisco estimated 12.5B Internet-connected devices, including phones and PCs; early smart-home and industrial IoT applications, cloud platforms |
| Industry 4.0 | 2014 | AI Integration | AI/ML integration, Edge computing, early 5G research |
| Pervasive IoT | 2020+ | Billions of Devices | 20B+ deployed, Edge AI at scale, Digital twins, Autonomous systems |
16.12 Knowledge Check: Technology Cycles
Question 1: According to IoT Analytics, approximately how many active connected IoT devices are forecast for 2030?
a) 10 million (~10^7) b) 1 billion (~10^9) c) about 39 billion (~3.9 × 10^10) d) 1 quadrillion (~10^15)
16.12.1 Answer
c) about 39 billion (~3.9 × 10^10). IoT Analytics forecasts this many active connected IoT devices in 2030; it counts connected nodes and gateways, not every end sensor.
Question 2: What is the primary economic driver behind each computing technology cycle?
a) Government funding for research programs b) Consumer demand for faster gaming performance c) Lower prices combined with improved functionality d) Military requirements for secure communications
16.12.2 Answer
c) Lower prices combined with improved functionality — Long-run integration and manufacturing trends often expand capability while reducing unit cost, although the rate differs by product, process generation and complete-system requirements. Treat the cycle as a comparison prompt, not a fixed forecasting law.
Question 3: Which phase of IoT evolution was characterized by connecting things to things rather than people to information?
a) Phase 2: The Internet b) Phase 3: Mobile Internet c) Phase 4: Social + Cloud Integration d) Phase 5: Internet of Things
16.12.3 Answer
d) Phase 5: Internet of Things — The critical distinction of the IoT phase is that it connects physical objects to each other and to people, enabling autonomous machine-to-machine communication. Previous phases connected people to information (Internet), people to the internet from anywhere (Mobile), and people to people (Social+Cloud).
16.13 How Technology Convergence Expanded IoT Options
The first half showed that device count, capability and cost changed the opportunity. The next question is how efficiency, integration, radios, networks and software widened useful distributed-compute options over time.
Computing evolution is only one part of the IoT story. The mid-2000s power-efficiency pivot was one contributor; continued integration, lower-cost microcontrollers, radios and sensors, networking, software platforms and application demand jointly widened practical IoT and edge-computing options.
16.14 Two Laws Behind Computing
Moore’s Law (1965): The Transistor Doubling
In 1965, Intel co-founder Gordon Moore observed that the number of transistors on a microchip doubles approximately every two years. This observation, known as Moore’s Law, has held remarkably true for over 50 years:
- 1971: Intel 4004 processor had 2,300 transistors
- 1995: Intel Pentium Pro had 5.5 million transistors (2,391x increase)
- 2005: Intel Pentium D had 230 million transistors (100,000x increase)
- 2020: Apple M1 chip has 16 billion transistors (6,956,522x increase)
16.15 Dennard scaling and the mid-2000s power wall
Under ideal constant-field scaling, transistor dimensions and supply voltage shrink together. Individual transistors switch faster and use less energy, allowing greater density without proportional growth in power density. Real process scaling increasingly departed from that ideal as supply-voltage reduction slowed and leakage, interconnect and cooling constraints grew.
16.16 Mid-2000s power-efficiency pivot
Across the 90 nm and 65 nm generations, practical frequency growth slowed as power density, leakage and thermal limits became harder to manage. Industry responses included multicore processors, more specialised logic and greater emphasis on performance per watt.
| Period | Common processor response | Architecture implication |
|---|---|---|
| Earlier scaling era | Rely more heavily on higher single-core frequency | Central servers often remained economically attractive |
| Mid-2000s onward | Combine multicore, efficiency and specialised logic | More placement options emerged across device, edge and cloud |
This transition did not by itself create IoT. Continued integration, lower-cost microcontrollers and radios, sensors, networking, software platforms and deployment demand together widened the workloads that could run near physical processes.
Inspect Figure 16.4 to see why processor design shifted from clock growth toward performance per watt and more varied compute placement.
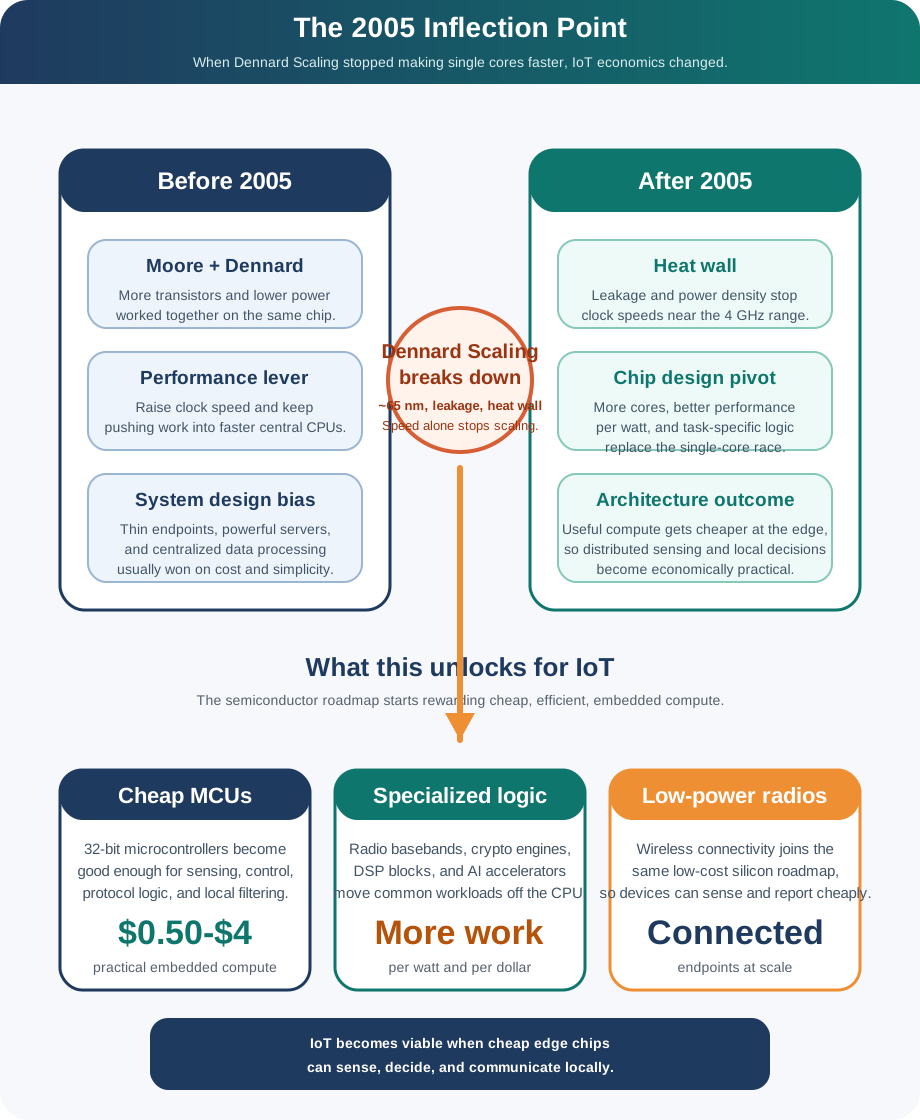
Find the bend in the curve. Then ask what changed. Read Figure 16.4 from the earlier Moore-plus-Dennard era, when higher single-core frequency often made central servers attractive, to the 90 nm and 65 nm pivot. Slower voltage scaling, leakage, power density, and heat limited practical frequency growth. Designers responded with multicore processors, efficient cores, and specialized logic, creating more choices across device, edge, and cloud. The figure also preserves the causal limit: this transition did not create IoT by itself. Lower-cost controllers and radios, sensors, networks, software platforms, and deployment demand together made more physical-process workloads practical.
16.17 Continue to Part 2
Continue with IoT Systems Evolution: Computing and Placement.
16.18 Continue Your Route
This final part closes the route from The 10x Technology Cycle Pattern through Continue to Part 2. Return to IoT Evolution: Systems Foundations or continue from the applications module index.