31 IoT Business Models: Revenue and Benefits
More
Depth: Practitioner
Progress saves as you read. Mark sections complete as you go; your progress appears in the sidebar.
- Podcast audio coming soon
- Character narration audio coming soon
31.1 Make the Revenue Claim Reviewable
An IoT business model describes how an organization creates, delivers and captures value through connected technologies, products and services. It includes revenue mechanisms, customer relationships, value propositions and the partners that deliver the solution. A product can gain subscribers while support costs and cancellations erase its margin. The revenue claim must survive both customer and cost checks.
Consider the chapter’s connected-device app: 10,000 users activate it, but only some pay for a premium tier. Installation enthusiasm cannot prove that those users will renew. Monitoring, control, analytics and updates must keep delivering something useful after the device is installed. The problem is to identify who pays, what keeps helping them and whether the price covers continuing delivery.
Building on IoT Business Models: Value Loops, this second part of three compares subscription, freemium, service and data-revenue approaches. We will use the app to test conversion costs, then calculate lifetime value relative to acquisition cost and write a recurring-revenue approval gate.
KEY CONCEPTS
- Product-as-a-Service
An ongoing service with defined operating risks; the customer may own or lease the asset.
- Platform models
Multi-sided markets connect device makers, developers and users through network effects.
- Data monetization
Device data generates revenue as raw data, insights or analytics.
- Freemium and tiers
A free basic service supports adoption; paid upgrades and pricing tiers fund added value.
- Outcome-based pricing
Payment depends on measurable results such as energy savings or downtime reduction.
- Revenue metrics
Lifetime value, acquisition cost, average revenue per user and churn test the model.
31.2 Learning Objectives
- Compare subscription, freemium, service, and data-revenue models.
- Calculate LTV-to-CAC and test a recurring-revenue gate.
31.3 Choose What the Customer Keeps Buying
Begin with the payer and the user roles that receive, operate or renew the service. Name the recurring outcome before choosing the price. Then choose a billable unit, the quantity charged for: a device, site, seat, API call, data volume, usage tier or measured outcome. An entitlement defines the user’s rights and feature access, including what happens when the service fails.
A home sensor subscription needs a monthly alert, automation or energy insight that remains useful after installation. A fleet tracker must account for tracked assets, reporting frequency, support load, cellular cost and the workflow using its alerts. An outcome-based predictive-maintenance offer goes further: it must join asset telemetry to work-order evidence, avoided downtime, false-positive cost and renewal proof before promising shared savings.
A regular lamp creates a purchase transaction. A smart lamp can add updates and premium features over time. The thermostat comparison makes the revenue change concrete:
| Traditional offer | IoT-enabled offer |
|---|---|
| Sell a thermostat for $200 | Sell a thermostat for $100 and charge $10/month for energy analytics |
| One-time purchase | Ongoing subscription |
| Relationship ends after the sale | Customer relationship can last for years |
The service’s continuing responsibility matters as much as its continuing revenue. Read Figure 1 from left to right: connectivity adds monitoring and updates, a service offer makes continuing capability part of the promise, and outcome pricing makes an agreed result the billable unit.
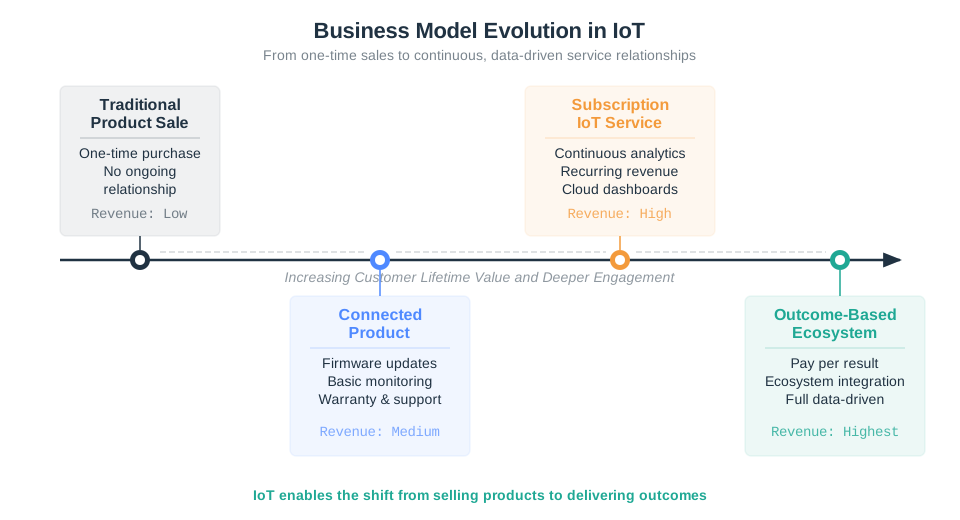
The same responsibility can support several revenue structures. Choose the structure that matches what the customer values and what the supplier undertakes to deliver.
| Model | How it works | Example |
|---|---|---|
| Product-as-a-Service (PaaS) | Pay for an ongoing service or outcome | Rolls-Royce TotalCare charges for engine maintenance by engine flying hour. |
| Razor and blade | Cheap hardware supports profitable services | Amazon Echo is presented here as hardware sold at cost, with Alexa purchases supplying revenue. |
| Freemium | Basic features are free; premium features cost money | Nest Cam offers free live view; Nest Aware/Google Home Premium adds paid video history and alerts. |
| Data monetization | Sell insights from collected data | TomTom licenses traffic analytics and APIs to business and public-sector customers. |
| Platform | Connect buyers and sellers and take a commission | Apple App Store charges a commission on eligible digital app sales and in-app purchases. |
TotalCare illustrates why ownership and service risk need separate treatment: an airline owns or leases its aircraft while Rolls-Royce takes maintenance-planning and shop-visit cost risks. A recurring app fee with no repair duty makes a different promise.
31.4 Test the Free Tier Before Scaling
For the connected-device app, freemium means free basic access with paid premium upgrades. It works only when the free tier attracts adoption and the paid tier removes an operational problem that a customer will fund month after month. Cosmetic extras and activation growth alone do not establish positive economics.
Suppose 10,000 users activate the app and 10% upgrade to a $15/month premium tier. That produces 1,000 paying users and $15,000 monthly revenue. The original example applies its $2/user/month service-cost assumption across all 10,000 users, producing $20,000 monthly cost and a $5,000 monthly loss. Although the input is labelled “cost per free user,” the calculation charges every user; use that all-user assumption when interpreting these results.
The gap explains why the free tier needs disciplined onboarding, clear upgrade triggers and tight cost control. Premium access should remove a real operational pain point. The free tier should limit the support burden from heavy users. Activation should move users to their first high-value outcome quickly enough for conversion to occur before they cancel.
The separate calculator lets you test whether a wider adoption funnel pays for itself. Judge paid value and the cost of serving free accounts together, rather than treating more activations as proof of a sustainable offer.
31.5 Set a Subscription Viability Gate
Conversion makes revenue visible; retention and delivery cost determine how much remains. The simple comparison below shows why recurring offers attract attention, without treating revenue as profit.
| Model | Initial charge | Revenue over 36 months | Customer relationship |
|---|---|---|---|
| One-time sale | $200 | $200 total | Transaction complete |
| Subscription | $10/month | $360 total | Ongoing relationship |
Another comparison uses a $99 device plus $8/month for 24 months. Its 75% subscription gross margin can outweigh its 25% hardware margin even when the device price drops. Lifetime revenue and gross profit depend on price, service cost and retention; there is no universal 5–9× subscription multiple. Hardware margins can erode, so consider recurring service economics from the initial product design.
Lifetime value (LTV) estimates value over a customer relationship. Distinguish revenue LTV from contribution-based LTV: the latter accounts for the cost of delivering the service and is the basis of the gate here. Customer acquisition cost (CAC) is the cost of gaining one customer. Average revenue per user (ARPU) measures revenue per user, while churn is the percentage of customers who cancel over the stated period. Higher LTV and lower churn help, but delivery and acquisition costs still need checking.
Before launch, write one decision gate that joins the pricing proposal to evidence:
- Customer outcome: the recurring problem the service solves.
- Monthly value signal: the metric proving usefulness after installation.
- Revenue assumption: expected ARPU, churn and support cost.
- Acquisition assumption: expected CAC and payback period.
- Decision rule: accept, revise pricing or hold launch according to whether contribution LTV:CAC reaches at least 3:1.
Test cloud cost, hardware replacement and gross margin alongside support cost. Join telemetry to account, device, plan, feature, support, cost and outcome records so renewal evidence can be audited. Accept only when the service produces a measurable outcome and clears the gate without relying on hardware margin alone. A ratio below 3:1 fails this chapter’s chosen gate; it does not by itself prove every business unsustainable.
The calculator estimates payback from constant monthly contribution over the expected paid lifetime. Treat its health labels as illustrative benchmarks, then apply the explicit approval rule above. A positive contribution or an attractive device sale does not substitute for passing that rule.
31.6 Follow Service Value Into Operations
The app’s economics depend on a useful continuing outcome. The following service cases make that requirement visible at the physical asset and at the hand-off to people.
The first application turns recurring operation into something a provider can observe and support. In Figure 2, begin with the physical kiosk, then trace the inventory and machine-health signals outward to remote operations. Ask which continuing activities justify revenue after installation.
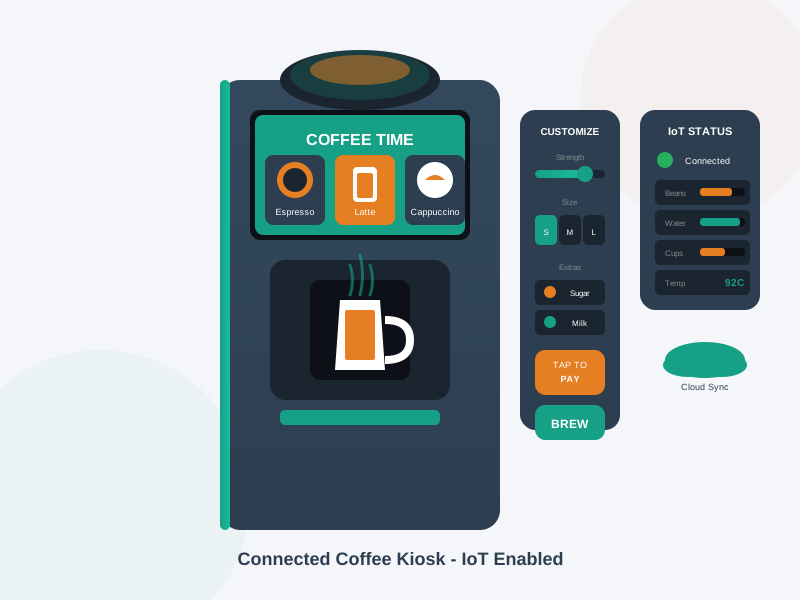
Figure 2 places level and condition sensing at the asset, with connectivity carrying those observations to replenishment and maintenance decisions. Consumables can support repeat transactions, while remote monitoring can reduce unnecessary visits and expose failures earlier. The business-model connection is the continuing loop: sensing must lead to an operational action that a customer or operator values, not merely to a dashboard.
Inspect Figure 3 to follow an arrival signal across the digital and store workflows that must meet at the hand-off.
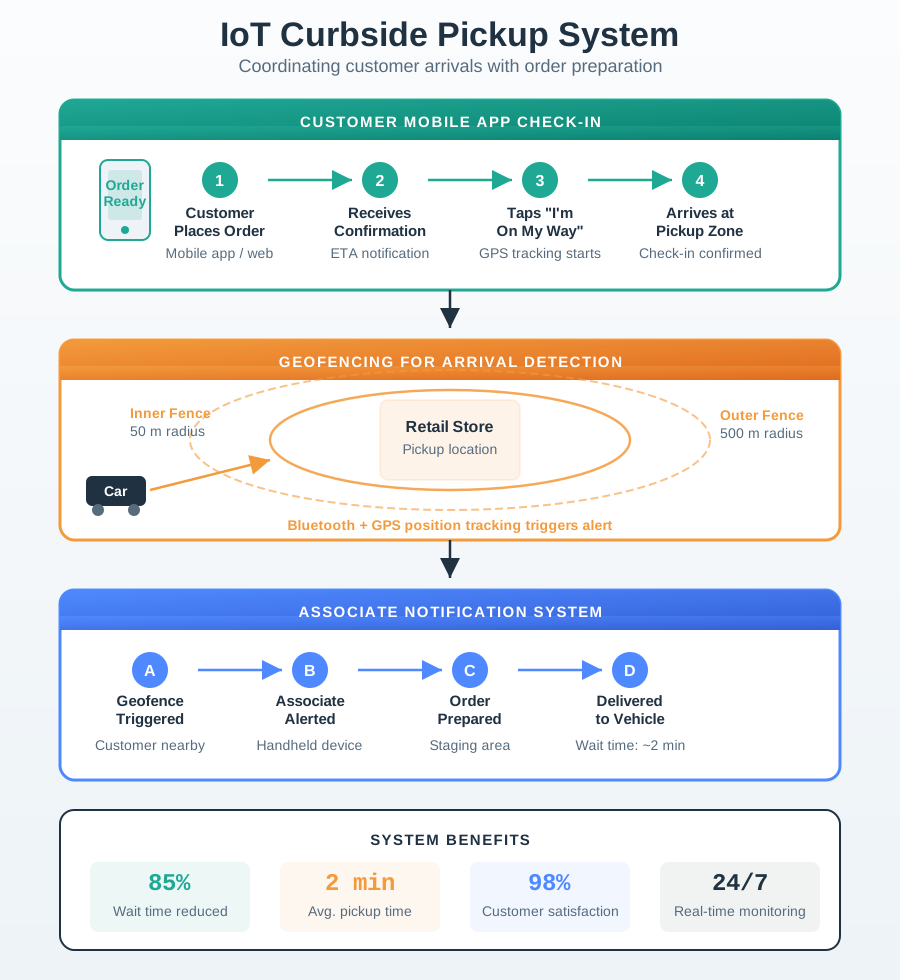
Follow one order to the kerb and check each change in responsibility along the way. Read Figure 3 from mobile check-in through geofencing, associate notification, and the final order hand-off. Location data has no standalone customer value here; it helps staff time preparation around arrival. The timing boundary links the digital promise to the physical encounter at the store. An early signal can waste staff effort, while a late signal leaves the customer waiting. Continuous service coordination creates value only when sensed context helps improve the real hand-off. The business must also measure how much waiting this coordination removed for the customer.
Care services make the limits of an outcome promise especially important. Inspect Figure 4 from the disposable moisture sensor tag to the caregiver’s reader and app. Separate what the system observes from the human response it can support.
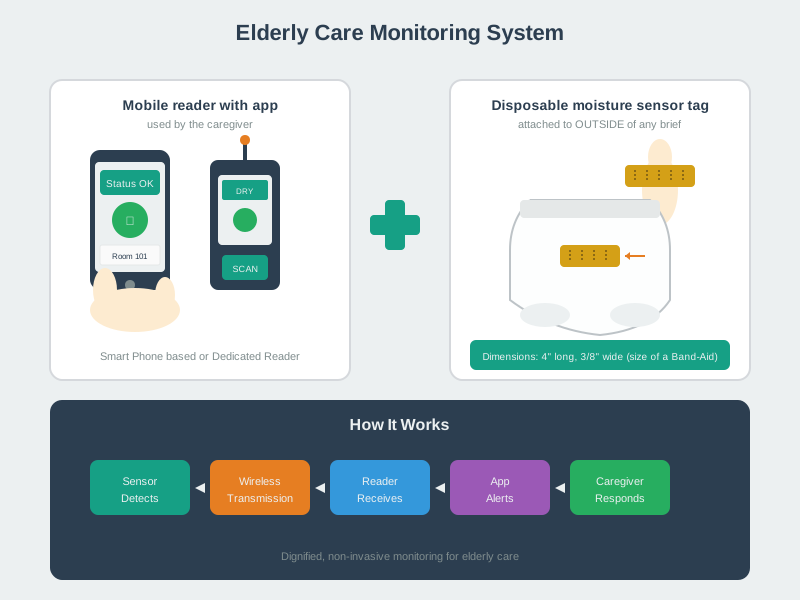
In Figure 4, a disposable moisture sensor tag sends observations to a caregiver’s mobile reader and app. The sensors can provide evidence and prompt attention, but they do not guarantee a clinical or quality-of-life outcome by themselves. This qualifies the progression in Figure 1: as a commercial promise moves toward outcomes, responsibility for reliability, escalation, privacy, and the limits of inference becomes more important.
31.7 Deliver Benefits With User Agency
Care monitoring also raises a broader question: who benefits, and who retains control? Explore the IoT Benefits for People with Disabilities video to consider assistive technologies through the person’s agency and the delivered service rather than device novelty.
Continuous value comes from software updates, analytics and service improvements. Device-generated insights can produce data revenue, while delivery often depends on partners across hardware, software, connectivity and service provision. Subscriptions and service relationships can create customer lock-in; cloud architectures enable scaling across geographies and use cases. These characteristics describe how the offer operates, but they still need evidence that the ongoing relationship benefits its users.
The same continuous-value characteristics also appear in commercial settings, where they reveal the governance questions that accompany data-driven services. Use Figure 5 to trace a proximity event from the store environment to a customer-facing action and to the retailer’s analytics path.
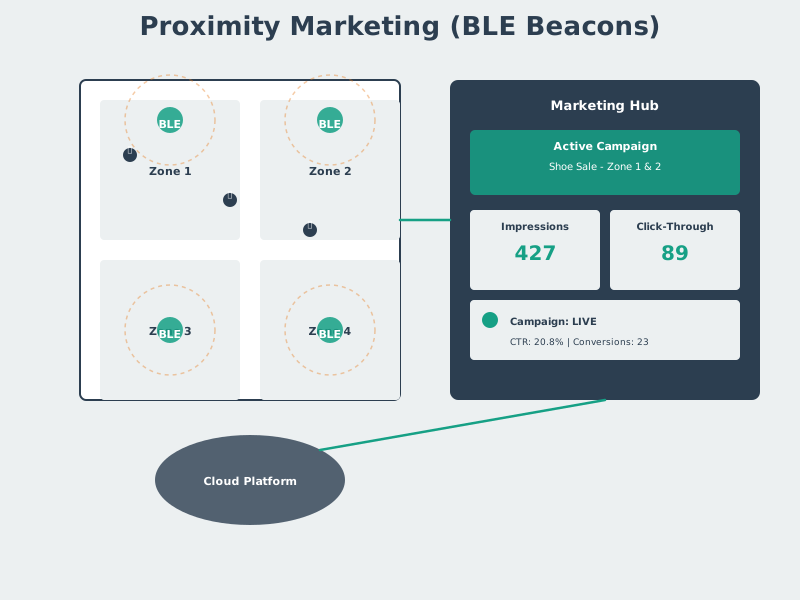
In Figure 5, beacons provide proximity observations, a mobile service turns those observations into navigation or an offer, and the analytics path aggregates movement patterns for operational use. The business value comes from that service-and-evidence loop, while consent, minimisation, and meaningful user choice constrain how it should operate. This returns the chapter to its core test: continuing data collection is justified only by continuing value delivered responsibly.
Summary
An IoT revenue model connects a payer, a recurring outcome, a billable unit and defined service rights. Subscriptions, freemium, data revenue, platforms and outcome pricing carry different delivery obligations. The connected-device app shows why adoption can grow while costs exceed revenue.
Review conversion, retention, acquisition and service costs together. The viability gate requires a measurable customer outcome and at least 3:1 contribution LTV:CAC under the stated assumptions. Operational cases add the final test: sensing must lead to useful action, with privacy, escalation and user choice considered wherever the service affects people.
Approve recurring revenue only when the service keeps delivering a measurable benefit and its contribution covers acquisition and continuing delivery costs under explicit assumptions.
Carry this evidence into IoT Business Models: Canvas and Entitlements, beginning with the IoT Business Model Canvas.
