32 IoT Business Models: Canvas and Entitlements
More
Depth: Practitioner
Progress saves as you read. Mark sections complete as you go; your progress appears in the sidebar.
- Podcast audio coming soon
- Character narration audio coming soon
32.1 Tie a Paid Promise to a Safe Product State
An IoT business canvas connects partners, costs, channels and revenue to the service a customer receives. An entitlement states who may use a feature and under which conditions. Together they answer a practical question: a customer paid for a feature, but the device is offline when it checks the licence. What permission does it retain, when does that permission expire, and how does it recover?
Picture a farm buying a yearly crop-alert service with its weather station. Payment later fails during a storm. The product team must protect the paid service without disabling a local frost warning or leaving the farmer unsure which features still work. The business canvas must name entitlement state, cache rules, expiry and recovery alongside the recurring costs that fund the promise.
This is part 3 of 3; IoT Business Models: Revenue and Benefits supplies the preceding evidence. IoT Business Model Fundamentals introduces recurring revenue, LTV:CAC, freemium pricing, platform effects and value-flow economics. Here the task is to turn those ideas into an operating contract: map each paid tier to its payer, recurring value signal, enforceable permission and cost driver, then identify the product, telemetry, billing and lifecycle records that keep the promise.
The problem is that a pricing label such as “subscription”, “platform”, “premium analytics” or “outcome based” says little about usage meters, renewal triggers or behavior when payment evidence is unavailable. Start with the canvas, compare the obligations of the revenue models, then map permissions to costs and design enforcement that preserves local safety.
KEY CONCEPTS
- Value and revenue
Connect the capability to its payer and customer result.
- Paid permission
Name the feature, device group, period and source of permission.
- Cost drivers
Measure the usage that changes service cost.
- Safe fallback
Keep urgent local actions working when a plan lapses.
32.2 Learning Objectives
- Map partners, costs, channels, and revenue in an IoT business canvas.
- Design licensing and entitlement rules for connected and offline use.
32.3 The IoT Business Model Canvas
The farm’s paid crop alerts need a common planning frame: who supplies the devices and services, who pays, and what customer result justifies renewal. Figure 1 connects what the system must create to how revenue is captured and which customer result is claimed. Read it across those three columns before assigning technologies or prices.

Start Figure 1 on the left with devices, connectivity, analytics, and software services. The centre asks how each continuing capability is funded; the right asks whether it produces cost savings, operational efficiency, a new capability, or reduced risk. The arrows are hypotheses to test, not automatic consequences of connecting a device. This frame carries the running narrative from application examples into a model whose costs and evidence can be examined.
The next step is to ask which costs the offer must cover.
Inspect Figure 2 from recurring customer payment down through platform functions and operating costs to the upfront physical investment.
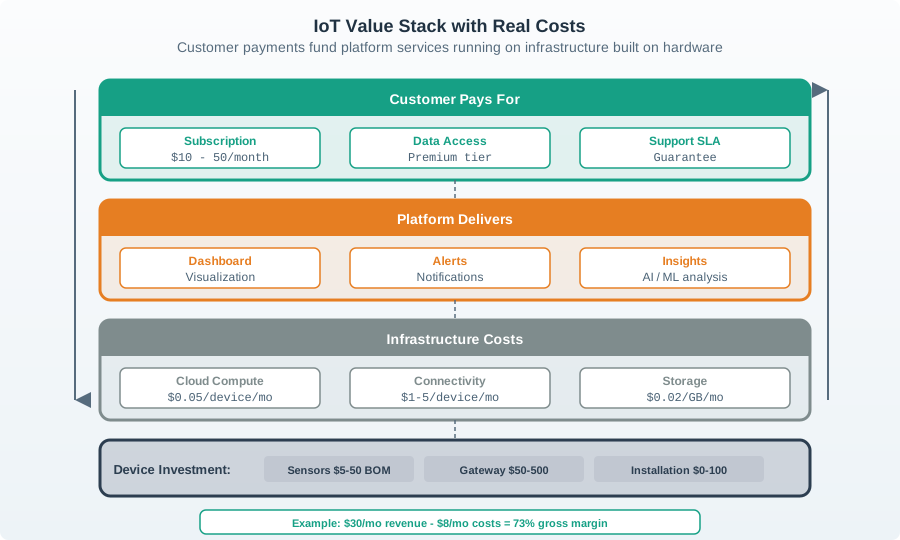
Move from device value to service value. Find the payer. In Figure 2, revenue enters through subscriptions, data access, or support commitments. It must fund the platform functions customers experience, the compute, connectivity, and storage those functions consume, and the deployed hardware beneath them. The printed amounts are illustrative inputs for a model, not universal prices. The important connection is structural: a recurring offer is viable only when its continuing revenue covers continuing delivery and recovery of the initial investment.
IoT Business Model Canvas:
| Value Creation | Revenue Stream | Customer Value |
|---|---|---|
| IoT Devices (Hardware) | Hardware Sales (One-time) | Cost Savings (OpEx vs CapEx) |
| Connectivity (Network) | Subscriptions (Recurring) | Operational Efficiency (Automation) |
| Data Analytics (Insights) | Data Monetization | New Capabilities (Innovation) |
| Services (Software) | Transaction Fees (Platform) | Risk Reduction (Predictive) |
Each layer builds upon the previous to create sustainable business models.
Cost coverage alone does not establish that a product should exist. Figure 3 widens the decision from the internal value stack to six commercial questions. Scan clockwise from market analysis, testing whether each consideration supplies evidence that the next one can be answered.
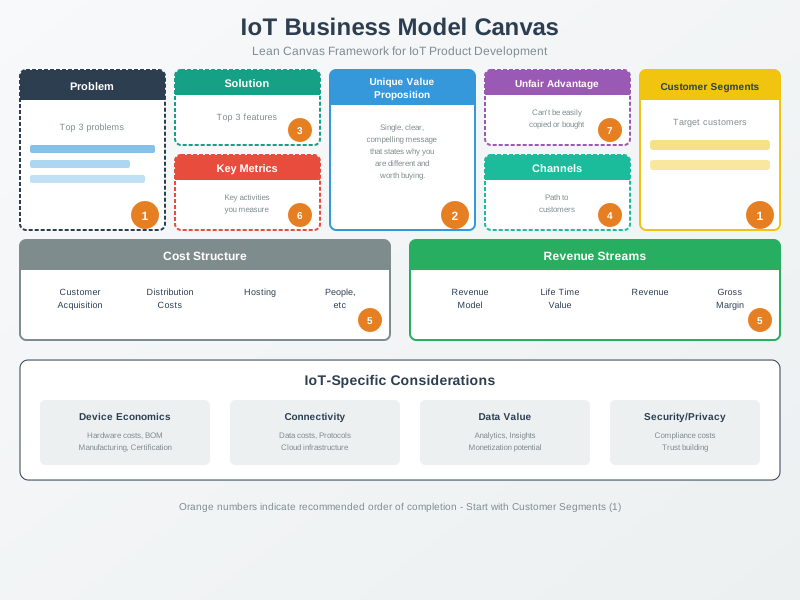
Figure 3 starts with a defined market and value proposition, then asks how revenue and costs fit, how the offer reaches customers, and which metrics reveal whether the model works. No box can repair an unsupported neighbour: attractive revenue mechanics do not create demand, and a strong technical value proposition does not supply a viable channel. The sequence turns Figure 2 into a testable business plan.
The framework becomes useful when its fields constrain one another rather than remaining generic labels. Inspect Figure 4 from the target customer to the claimed saving, then compare the hardware and subscription prices with the acquisition and lifetime-value assumptions.
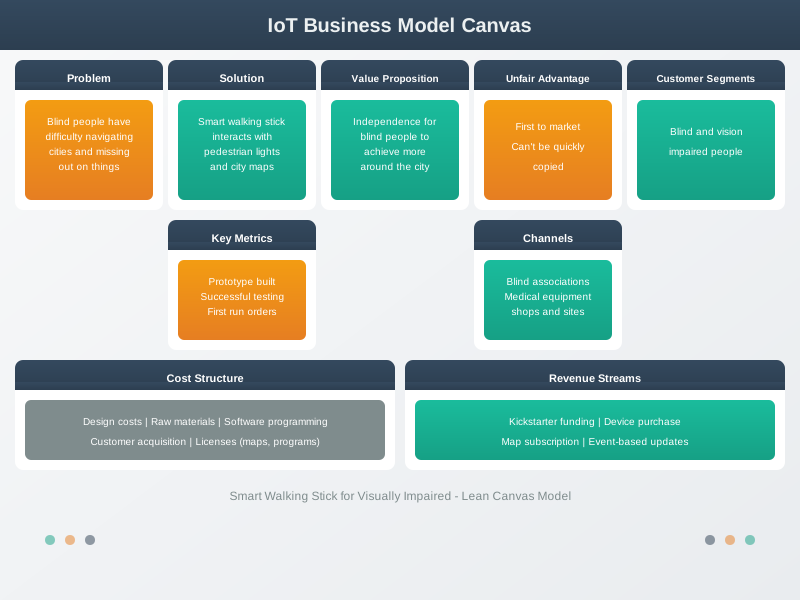
In Figure 4, the customer segment and energy-saving proposition come first because they define who must find the outcome credible. The price, subscription, customer-acquisition cost, lifetime value, and payback period then form linked assumptions that should be validated with observed retention and delivery cost. This completes the value-stack move: the model is not a collection of optimistic numbers but a chain of claims that operations and customer evidence must support.
32.4 Match Revenue to the Continuing Obligation
With the canvas in place, compare the obligations each revenue model creates. Connectivity creates continuing costs and continuing value: cloud ingestion, storage, analytics, app support, over-the-air (OTA) updates, cellular data plans, warranties, security response, and customer success. The model has to explain who pays for that system after the device is installed, which value signal keeps them paying, and which operating costs could grow faster than revenue.
The same sensor product can support different models. A smart thermostat may be sold as hardware with an optional energy service. A fleet tracker may be priced per vehicle per month. An industrial monitoring system may bundle gateways, installation, dashboards, support, and service-level commitments into a managed subscription. The right model depends on whether the customer values ownership, convenience, risk transfer, regulatory evidence, avoided downtime, or access to an ecosystem.
Figure 5 sets five ways of charging for the same product against the promise each one obliges the vendor to keep.
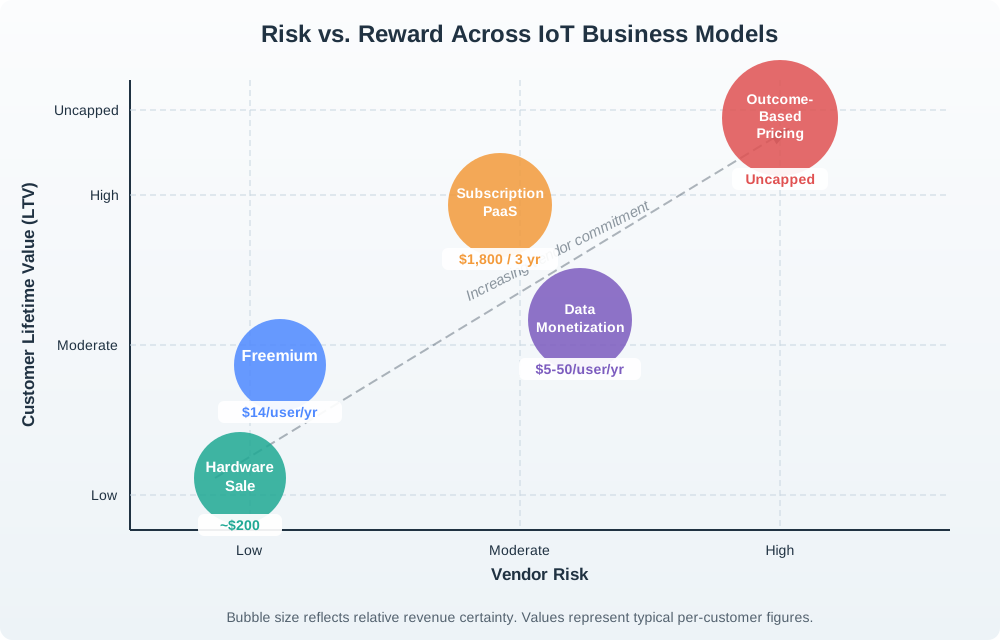
Read Figure 5 along the diagonal. In the low-risk corner a hardware sale books about $200 once and then ends, and freemium earns a small yearly figure from the few users who convert. The middle band holds subscription, where $50 a month over three years is worth far more than the device, and data monetisation, where the amount per user varies widely. The top corner is outcome pricing, drawn as uncapped because the vendor is paid for a measured result. Moving up and right means accepting monitoring, incident response and cloud operations for as long as the device runs. The values are scenario assumptions, not benchmarks.
The quadrant is useful because it separates two questions that are often mixed together. First, how much lifetime value can the offer capture if the connected service succeeds? Second, how much obligation does the vendor accept after deployment? A low-risk hardware sale may still require warranty support and firmware updates, but the customer carries most operational risk. A subscription or outcome-based offer shifts more responsibility to the vendor, so the business must fund monitoring, incident response, cloud operations, and customer success for as long as the device is active.
- Hardware sale: Revenue happens early, but support, warranty, cloud, and update costs continue.
- Subscription: Value must recur through insight, automation, compliance, uptime, safety, or convenience.
- Platform: The product must serve more than one participant, such as device owners, installers, developers, partners, or operators.
32.5 Map Each Paid Feature to Value and Cost
For the farm, the paid crop-alert tier must specify what it unlocks while the local frost warning remains available. The practical check is to connect each paid feature to a measurable product behavior. Energy analytics may require interval metering, tariff data, weather normalization, and a user-facing recommendation loop. Predictive maintenance may require vibration capture, edge filtering, model scoring, alert triage, and maintenance workflow integration. Remote unlock may require identity proof, revocation, audit logs, and fallback access. The paid tier should map to a capability the product can actually enforce and prove.
32.5.1 Value, Cost, Entitlement Map
Pricing also has to match operating cost. A device that publishes high-frequency telemetry over LTE-M or NB-IoT has a different cost profile from a Wi-Fi device that sends summary events. A product that promises OTA fixes needs release operations, staged rollout, rollback policy, and support scripts. Those requirements belong in the business model, not only the engineering plan, because they decide gross margin, payback period, and the minimum healthy contract length.
For example, a fleet cold-chain monitor might charge per trailer per month, but the internal model should split that fee across cellular data, cloud ingestion, retention, alert routing, dashboard access, compliance reporting, and support. If a customer asks for one-minute temperature samples instead of five-minute samples, the practitioner can show the cost and battery impact immediately. If the product team adds a premium compliance report, it should identify the data retention, audit trail, and export workflow that justify the premium price.
32.6 Keep Product, Billing and Safety in Agreement
32.6.1 Business Models Need Infrastructure
Recurring IoT revenue needs infrastructure that can enforce and observe the offer. Device identity ties the installed unit to an account. Provisioning records connect ownership, location, firmware version, warranty status, and allowed services. Billing systems such as Stripe Billing, Chargebee, Recurly, Apple In-App Purchase, Google Play Billing, or enterprise invoicing need clean entitlement signals from the product, not spreadsheet reconciliation after the fact.
The data plane also matters. MQTT topics, HTTP APIs, webhook deliveries, data-retention jobs, and customer exports can all become billable boundaries or cost leaks. A product using AWS IoT Core, Azure IoT Hub, EMQX, Kafka, Snowflake, BigQuery, or similar services should tag events with customer, device, firmware, region, plan, and feature identifiers before data enters shared pipelines. Without those tags, finance cannot tell whether margin changed because of customer growth, a firmware retry loop, a roaming SIM policy, dashboard exports, or a pricing decision.
Entitlement enforcement should fail safely. A cancelled subscription might disable cloud analytics, long retention, exports, and nonessential integrations, but it must not break local safety functions such as alarms, lock release, or medical alerts. Feature flags, device shadows or twins, local fallback rules, and staged firmware rollout systems have to agree on what happens during trial, upgrade, downgrade, renewal failure, account transfer, and device decommissioning. That agreement is what turns a pricing page into an operable service. Entitlement design must address signed permission records, time limits, copied state and reconciliation; business rules must never overrule an urgent safe local path.
- Entitlements: Keep device, account, tier, feature flag, and retention rules explicit and auditable.
- Metering: Measure active devices, message volume, storage, API calls, alerts, exports, and support actions.
- Lifecycle: Define what happens during trial, upgrade, downgrade, renewal failure, transfer, cancellation, and decommissioning.
The operating dashboard should therefore combine product and finance signals: active billable devices, devices past hardware payback, message cost per device, gross margin per plan, churn by cohort, support cases per account, renewal status, and incident history. When those signals are visible together, the team can see whether an attractive growth metric is hiding a weak model, such as subsidized devices churning before payback or a “premium” feature whose cloud workload costs more than the price uplift.
32.7 Summary
The canvas connects value creation, revenue and customer outcomes. A credible plan also connects market evidence, pricing, acquisition costs, retention and continuing delivery costs. Hardware sales, subscriptions, platforms, data monetization and outcome pricing carry different obligations after installation.
The farm’s crop-alert contract must say who receives each paid capability, which usage drives cost and how permission changes during the customer lifecycle. Device, app, support and billing records must agree, including when the device is offline. A subscription change must preserve urgent local safety and provide a clear recovery path.
Price the service only when its paid promise, operating costs, entitlement rules and safe fallback describe the same product behavior.
Carry this contract into IoT Business Models: Platforms and Revenue Strategy to connect it to platform choices and revenue strategy. See applications module index.
