8 IoT History: Adoption and Cost
More
Depth: Practitioner
Progress saves as you read. Mark sections complete as you go; your progress appears in the sidebar.
- Podcast audio coming soon
- Character narration audio coming soon
8.1 Start with the Pump Decision
A useful connected device can stay niche until cost, trust, and supporting networks cross a threshold. This chapter examines why technical merit alone does not set the adoption date, and how historical examples can help us evaluate an IoT proposal without mistaking enthusiasm for evidence. It is part 2 of 3, following IoT History: Paradigm Evidence.
Your company manufactures traditional industrial pumps. A junior engineer proposes adding sensors to monitor vibration, temperature, and flow rate. The VP of Sales replies: “Our customers want reliable pumps, not gadgets. They’ve never asked for this.” The engineer sees new capabilities; the VP sees cost and complexity. Both need a way to test their assumptions.
The problem is deciding whether the proposal changes what customers can do, and whether they can afford and trust it. We will examine the mechanisms that narrow a forecast, test the limits of historical analogies, and then use adoption and cost curves to frame the pump decision. The smart watch journey provides a second example of value moving beyond a device’s familiar purpose.
KEY CONCEPTS
- Paradigm blindness
Familiar behavior and metrics can hide new uses.
- Adoption S-curve
Early experiments, rapid growth, and maturity need different evidence.
- Cost trajectories
Cheaper hardware can open markets while other barriers remain.
- Emerging value
The first connected feature may lead to a different service.
8.2 Learning Objectives
- Explain paradigm blindness with adoption and cost-curve evidence.
- Use an S-curve to compare early, rapid, and mature adoption.
8.3 Recognize What a Forecast Leaves Out
Paradigm blindness means evaluating a new technology through assumptions inherited from the current one. Five mechanisms help diagnose it. They are questions to investigate, rather than proof that a skeptical expert must be wrong.
Anchoring to existing behavior assumes people will keep doing what they do today. The often-retold AT&T/McKinsey cellular forecast illustrates this risk, but its details need a traceable primary record. A forecast bounded by landline habits could miss demand for mobility and later services. In the pump scenario, “customers have never asked” describes past requests; it does not establish what customers would value after trying continuous monitoring.
Linear extrapolation of exponential change treats a changing cost as though it will remain near today’s level. The chapter’s historical price examples are a $4,000 phone in 1983, a $200 phone by 1998, and a $50 phone by 2005. These are illustrative price points rather than a like-for-like handset price series. Falling costs can unlock new market segments, but semiconductor improvement associated with Moore’s Law does not establish the rate for every complete device.
Measuring new technology by old metrics misses its distinctive capability. Sir William Preece’s comparison of telephone and telegraph emphasized message delivery rather than real-time conversation, emotional connection, and immediate coordination. Likewise, judging a smart light bulb only by its ability to produce light misses its connected functions. Judging the proposed pump sensors only by pump reliability misses the possibility of earlier maintenance decisions.
Ignoring second-order effects overlooks consequences beyond the initial use. Mobile calling was followed by SMS, mobile internet, app stores, ride-sharing, food delivery, mobile banking, and social media. These were not all part of the original 1983 proposition. Their emergence was a sequence of new uses, rather than evidence that each service mechanically caused the next.
That sequence also changed revenue. Tiny text payloads could be priced, bundled, and broadcast to many recipients, then extended or displaced by Internet-native chat, feeds, video, and streaming. As phones became software platforms, value moved beyond the carrier’s voice minute toward application ecosystems, operating systems, developer tools, content libraries, and user data. An IoT platform’s first feature may likewise differ from where its durable value or risk eventually sits.
Survivorship bias in expert selection favors people who succeeded under current conditions. Their experience is valuable, but a stake in existing systems can narrow the alternatives they consider. For the pump proposal, consult that expertise while asking explicitly which assumptions about customer behavior, cost, and service revenue might change.
8.4 Test the Analogy Before Trusting It
Historical mistakes help reveal assumptions; they cannot validate a product. Five pitfalls keep that distinction practical.
“Everything is the next telephone” mistakes any connected product for a paradigm shift. Some IoT products are solutions looking for a problem. Ask whether the proposal enables a new behavior or solves a previously impossible problem. Skepticism is warranted when neither is clear.
Technological possibility is not market viability. A connected toothbrush can track brushing habits, yet remain niche if the data produces no meaningful health outcome or behavior change. The useful question is: “What decision does this data enable that was not possible before?” Apply it to the pump’s vibration, temperature, and flow readings before selecting hardware.
Timing can defeat an otherwise promising idea. Gartner’s “hype cycle” includes a “trough of disillusionment.” Early IoT adopters in 2014–2016 faced unreliable connectivity, gaps in interoperability standards, and poor security. Recognizing those engineering failures is prudent. It is not evidence of paradigm blindness by itself.
Cost curves cannot solve every barrier. Regulatory approval, privacy, infrastructure, and user trust can delay adoption even when sensors become cheap. Individual anecdotes cannot settle a market question either. One mistaken telephone prediction does not invalidate an expert’s specific objection to an IoT deployment. Name the mechanism and test the objection on its merits.
Today’s examples make that test concrete. A connected refrigerator could support inventory reminders and food planning, but food-waste reductions need evidence from a tested household intervention. Connected lighting can offer schedules, presence simulation, accessibility, and possible circadian effects on sleep; energy and health outcomes require study-specific settings, baselines, and ranges. Bridge sensors can support condition monitoring, with savings estimated from an asset-specific maintenance and risk model. Livestock tracking can support grazing, health alerts, and theft response, but yield or warning-time claims need herd-study evidence.
These examples return us to the pump decision: identify a changed decision first, then establish the conditions under which customers would use it.
8.5 Reframe the Incumbent’s Decision
Clayton Christensen’s Innovator’s Dilemma (1997) explains how successful companies can struggle to adopt disruptive technologies. Four tensions connect that framework to the VP’s response.
First, expertise can become a liability. AT&T’s landline knowledge and telecom engineering’s focus on voice quality could make wireless mobility seem inferior. A manufacturer optimized for reliable products may similarly see sensor data as unnecessary complexity. The remedy is to compare the new capability alongside the existing measure of quality.
Second, customers usually request improvements to familiar products. “Faster horses, not automobiles” is commonly attributed to Henry Ford, but should not be treated here as a verified quotation. Likewise, saying that no AT&T customer asked for a mobile phone in 1983 is too absolute to establish from the material here. The useful point is narrower: pump customers may ask for reliability until a competitor shows them predictive maintenance.
Third, early economics can look poor. A $4,000 mobile phone with poor quality and a 30-minute battery was unattractive for many existing uses. Early IoT sensors can also be expensive, unreliable, and lack a clear return on investment. For the pump discussion, assume a $50 sensor, a $500 pump, and a $50,000 outage. Those assumed values show why comparing the sensor only with the pump’s purchase price could miss the customer’s larger loss. They do not prove that sensing will prevent an outage.
Fourth, services can emerge after deployment. SMS became an unexpected mobile use; smartphones supported ride-sharing, social media, and mobile payments. IoT supports predictive maintenance, precision agriculture, and remote healthcare. Smart meters illustrate a move from billing accuracy to grid optimization and demand-response programs; any claim that these programs are worth billions needs a defined scope and supporting evidence.
The same reasoning applies to lighting: connected bulbs can support dynamic evacuation guidance, possible elderly-care monitoring through usage patterns, and occupancy-based lighting and heating, ventilation and air conditioning (HVAC) control. Li-Fi is another distinct capability; the cited “up to 224 Gbps” should be understood as a reported experimental upper figure, not an ordinary connected bulb’s service rate. These possibilities deserve separate evaluation rather than a single claim that a connected bulb is revolutionary.
For pumps, frame sensing as a reliability service and test it in a pilot. Candidate uses include predictive maintenance, usage-based billing per gallon pumped, adjustment to operating conditions, remote fleet management across hundreds of pumps, warranty validation, and energy optimization. Treat the original examples of pumps using 20% of industrial electricity, downtime falling 25–40%, and service revenue worth 3–5 times a pump sale as claims to validate for a defined setting, not guaranteed pilot outcomes. A competitor could develop maintenance contracts and an accumulated data advantage, but the pilot must establish actual benefits.
8.6 Read Adoption by Segment
An adoption S-curve describes slow early uptake, faster growth, and eventual slowing toward maturity. Time runs across the horizontal axis and adoption up the vertical axis. It is a useful model, but the timing and steepness are not guaranteed. A working prototype alone establishes neither demand nor rapid adoption.
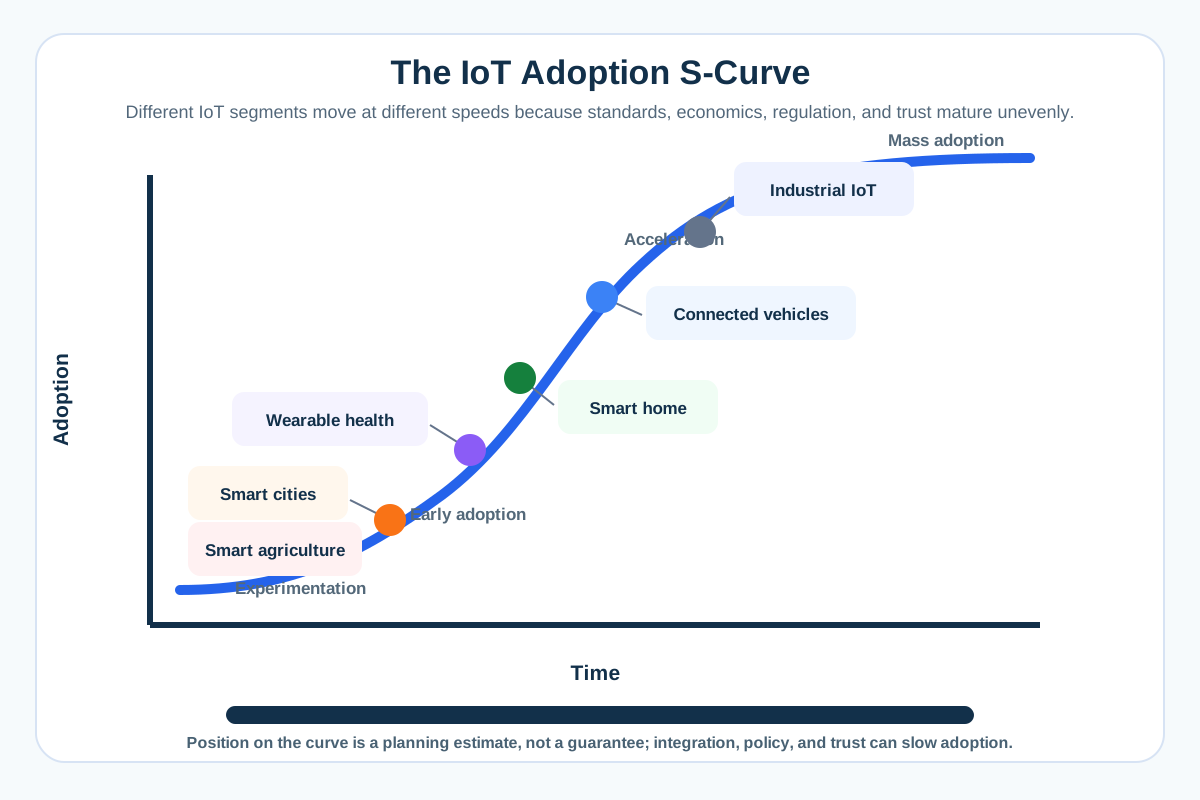
The chapter’s conceptual curve places experimentation before mass adoption and spreads IoT segments along it. Industrial deployments and connected vehicles sit further along than smart cities or farm sensors. Those positions are estimates: integration work, regulation, policy, and public trust can hold a cheap technology back. There is no single measured “IoT adoption percentage” that safely describes all those markets.
| Segment | How to interpret its position and evidence |
|---|---|
| Industrial IoT | Adoption and maintenance outcomes vary by sector. Percentages and dollar sizes need a dated market scope and measured downtime evidence. |
| Smart home | A survey needs a date and a defined household or adult denominator. Matter interoperability is a separate question. |
| Connected vehicles | Penetration needs a geography, model year, and connectivity definition. V2X deployment measures separate infrastructure. |
| Smart agriculture | The schematic places it in Phase 1–2, transitioning as precision farming demonstrates ROI while connectivity and cost constrain uptake. |
| Smart cities | The schematic places it in Phase 1–2, with maturing pilots and continuing integration, scaling, and privacy challenges. |
| Wearable health | The schematic places it in Phase 2–3, accelerating around FDA-cleared Apple Watch ECG capability and wider continuous-glucose-monitor use. |
Read these as a framework for investigating the source’s 2026 outlook, rather than a current market census. The simulation’s examples—industrial IoT at years 10–12 and about 60% adoption, smart homes at years 8–10 and about 35%, and smart agriculture at 12%—are illustrative coordinates, not measured sector adoption.
The separate explorer lets you change timing and steepness and compare innovators, early adopters, early majority, late majority, and laggards. For the pump business, the practical question is which customers have moved beyond experiments and what supporting services make wider uptake possible.
8.7 Use Cost Curves as Conditional Projections
Falling component costs and manufacturing scale can make additional applications viable. An exponential cost decline applies the same proportional reduction repeatedly. It differs from subtracting the same number of dollars every year. Moore’s Law motivates discussion of semiconductor improvement; it is not a universal price law for BLE, LoRaWAN, cellular IoT, or a complete installation.
The cost calculator explores assumed halving times of 3 years, 2 years, and 18 months. It starts with an adjustable component cost from $1 to $1,000 and projects 0–15 years ahead. These are scenario inputs. BLE, LoRaWAN, and cellular IoT prices should likewise be illustrative inputs unless compared at matched purchase volumes, specifications, vendors, and dates.
A statement such as “$100 today becomes $1 in 10 years” is a particular assumed trajectory, not an inevitable result. Ask what becomes viable at 10 times cheaper while still accounting for security review, support, privacy, installation, and operations. The same discipline applies to imagining a device becoming 10 times smaller: consider what new uses it could support without treating that change as a promised schedule.
For the pump pilot, the sensor’s future price matters only alongside integration and operating costs. A tenfold component-cost drop can open additional markets when those other costs also fit. It cannot by itself supply trust, approval, or a maintenance team able to act on the data.
8.8 Follow the Smart Watch’s Changing Value
The smart watch journey shows why the measure of value can change after introduction. During dismissal in 2013–2014, Android Wear and Samsung Galaxy Gear attracted objections that phones already told time, battery life was poor, and screens were too small. Those objections compared the device with existing watches and phones. Battery limitations were real, but telling time was only one possible use.
At the Apple Watch launch in 2015, skepticism continued to focus on what watches did worse than familiar products. Swiss watch executives dismissed the potential effect on their market. The historical lesson is to examine the basis of that comparison rather than infer that every criticism was mistaken.
During 2018–2020, health monitoring became a prominent new source of value: atrial-fibrillation detection, fall detection that could call emergency services, and electrocardiogram (ECG) capability with Food and Drug Administration (FDA) clearance. Claims that the ECG was the first such consumer capability, that these functions saved lives, or that none appeared in the original pitch need specific evidence. A feature’s availability and its demonstrated clinical outcome are different claims.
The source describes 2022–2026 as a move toward health infrastructure, with insurance incentives and hospital integration of watch data into patient records. Those examples need provider and program context. A smart watch’s cleared medical functions do not turn every watch or every feature into a medical device. Still, the shift from timekeeping toward health illustrates value emerging from sensors, connectivity, and processing on the wrist.
Return to the pump with the same openness and discipline. Connectivity can change behavior; new uses may emerge two or three steps beyond the first application. The familiar gaming → graphics cards → AI training sequence illustrates why an initially narrow use may support wider ones. Ask what new data the pump creates, whom it could serve, and what second-order effects widespread adoption might bring. Then test those possibilities through customer decisions and pilot evidence.
Summary
Historical comparisons help expose anchoring, linear extrapolation, old metrics, missed second-order effects, and narrow expert selection. They strengthen a review when they lead to a testable question about new behavior or value. They do not establish that a particular IoT product will succeed.
Adoption curves separate early experiments, rapid growth, and maturity, but each segment needs its own evidence. Cost projections show what cheaper components might enable while leaving integration, trust, privacy, and operations in the decision. For the pump company, a pilot can test whether vibration, temperature, and flow data improve reliability decisions enough to justify the service.
Evaluate what connectivity enables, then test whether customers can use, afford, and trust it. A compelling historical analogy is the start of that investigation.
Carry this evidence into IoT History: SHIFT and Resistance, which begins with Checkpoint: Reframing Resistance.
