6 IoT Financial Metrics: Unit Economics
More
Depth: Practitioner
Progress saves as you read. Mark sections complete as you go; your progress appears in the sidebar.
- Podcast audio coming soon
- Character narration audio coming soon
6.1 Can the Connected Service Recover Its Costs?
A connected service can grow revenue while losing money on every new customer. This chapter follows acquisition cost, subscription revenue, device support, margin, churn, payback, and lifetime value through the connected-product lifecycle. The aim is to decide whether the service can recover its acquisition and delivery costs before investing in growth.
Imagine a team pitching IoT growth without being able to explain its unit economics. Its smart thermostat offer costs $150 to acquire a customer through advertising, sales, and free installation. The customer pays $10 a month. After twelve months, that is $120 in revenue; after three years, it is $360. Comparing $360 with $150 gives 2.4:1, but that comparison still leaves cloud cost, support, warranty replacements, and retention unexplained. Hardware cash today can conceal a service obligation tomorrow.
The problem is to bring those obligations and receipts into one defensible customer record. We will first build a cohort ledger, then calculate the metrics, and finally test the ratio against cash timing and business stage. The worked examples use percentages, exponents, and summation formulas, alongside revenue, margin, and customer metrics. IoT Business Model Fundamentals supplies the business-model context.
This is part 1 of 2. Here we calculate and interpret LTV, CAC, ARPU, churn, contribution margin, and payback, and identify the full lifecycle costs needed for platform comparison. Forecasting, TCO, platform choice, Peloton-style collapse, smart-building LTV, and cash-flow timing carry the launch decision into the second part. Calculators and checks open separately so you can test the assumptions after following the explanation.
KEY CONCEPTS
- Lifetime value
LTV estimates retained customer contribution before acquisition cost.
- Acquisition cost
CAC allocates sales and marketing spend to new customers.
- Revenue per user
ARPU measures monthly revenue per active customer.
- Churn and retention
Customer losses compound across successive periods.
- LTV:CAC
Compare lifetime contribution with the cost of acquiring that cohort.
- Total cost of ownership
TCO includes integration, storage, API usage, and compliance.
- Payback period
Monthly contribution determines how long acquisition cash stays tied up.
6.2 Learning Objectives
By the end of this chapter, you will be able to:
- Calculate Key Business Metrics: Apply LTV, CAC, ARPU, and churn rate to IoT business cases
- Evaluate Business Viability: Use LTV:CAC ratios to assess model sustainability
- Model Revenue Projections: Forecast revenue with churn and growth assumptions
- Compare Business Models: Use financial frameworks to select optimal models
- Assess Total Cost of Ownership: Evaluate IoT platform costs beyond initial pricing
6.3 Financial Metrics Tell a Cohort Story
Financial metrics are useful only when they describe a specific customer cohort, device fleet, and recurring service promise. LTV, CAC, ARPU, churn, payback, and TCO are not independent scoreboard numbers. They are a connected story about how much value a customer receives, how expensive it was to win that customer, how much the connected service costs to operate, and how long the relationship lasts. In IoT, the story is harder than ordinary software because hardware, installation, connectivity, warranty, support, storage, field service, and safety requirements all affect the same margin.
The first reader habit is to ask what is being counted. A device sale can create cash today while hiding future support cost. A high ARPU account can still be weak if it needs expensive truck rolls or cellular traffic. A low CAC channel can be misleading if it brings customers who churn after one billing cycle. A strong LTV:CAC ratio can still strain cash if payback takes too long. This chapter treats each metric as one lens on the same unit-economics system.
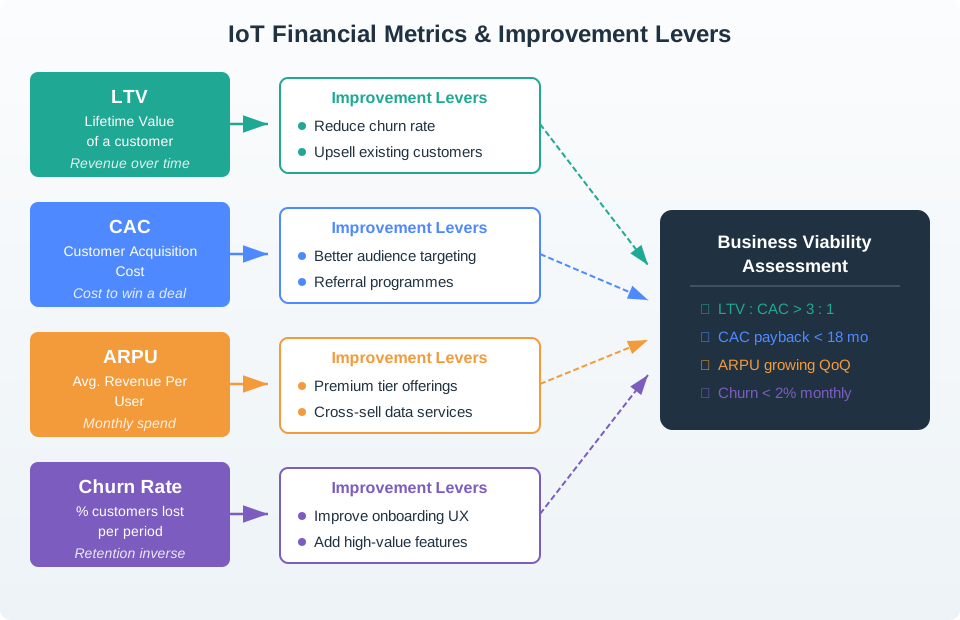
The improvement levers must also describe that same cohort. Reducing churn can raise LTV; better audience targeting can reduce CAC. Premium tiers and cross-selling can increase ARPU, but weak onboarding or missing high-value features can shorten the relationship and erase the gain. Business viability is the reconciliation of those effects, rather than another independent score.
Use the cohort ledger to connect those visual relationships to operational evidence:
| Metric | Question it answers | IoT evidence needed |
|---|---|---|
| LTV | How much margin does a cohort create before it leaves? | Plan revenue, gross margin, churn, attach rate, support load, replacement cost |
| CAC | How expensive is acquisition and activation? | Channel spend, demos, installation labor, onboarding time, sales cycle |
| Payback | How long is acquisition cash tied up? | CAC, contribution margin, billing cadence, hardware subsidy, deployment lag |
| TCO | What does the platform cost at scale? | Hub traffic, storage, analytics, support, compliance, integration maintenance |
The table adds the evidence grain that a summary visual cannot carry. Plan revenue, gross margin, churn, and replacement cost explain LTV; channel spend, installation labour, onboarding time, and sales-cycle length explain CAC. Payback exposes how long acquisition cash remains tied up, while TCO keeps hub traffic, storage, support, compliance, and integration maintenance from disappearing behind revenue.
The goal is not to memorize thresholds. The goal is to notice which number would change a launch decision. If LTV:CAC is below 3:1, acquisition or retention needs work. If payback is longer than the expected customer lifetime, growth burns cash. If TCO grows faster than ARPU, the service may scale revenue while losing margin. The metrics are decision tools, not decorations for a dashboard.
6.4 Build the Ledger Before the Dashboard
Practitioners should build a unit-economics ledger before building executive charts. The ledger links every device, account, plan, billing event, support event, cost driver, and renewal outcome to a durable identifier. A dashboard that shows revenue by month is not enough. The team must be able to explain which cohort produced the revenue, which channel acquired it, which devices generated cost, and whether the customer renewed because the connected service kept producing measurable value.
A practical stack usually combines product telemetry, billing records, support data, and cloud cost allocation. Stripe Billing, Chargebee, Paddle, NetSuite, or an ERP system may hold subscription state and invoices. Amazon Web Services (AWS) IoT Core, Azure IoT Hub, EMQX, or a fleet backend may hold device events. A warehouse such as BigQuery, Snowflake, Redshift, or Postgres may join account identifiers, device identifiers, plan tiers, usage events, support tickets, and cloud-cost tags. Tools such as dbt can make the metric definitions explicit so finance, product, and engineering use the same LTV, churn, and margin logic.
- Define the grain. Decide whether metrics are calculated per customer, site, device, asset, gateway, or contract.
- Separate revenue from contribution margin. Subtract connectivity, cloud, support, warranty, payment, and field-service costs before claiming LTV.
- Track cohorts by acquisition source. A partner channel, paid search campaign, reseller, or installer network may have different CAC and churn.
- Connect churn to product evidence. Link cancellations to onboarding failures, alert quality, device uptime, support delays, or missing integrations.
The practitioner mistake is to average too early. A blended ARPU can hide one profitable industrial fleet and one unprofitable consumer segment. A single churn percentage can hide a problem with a firmware release, a cellular coverage region, or a support policy. Keep cohort cuts visible until the launch decision is clear. Then summarize with the smallest set of metrics that explain the decision.
6.5 Metric Accuracy Depends on Event Grain
Under the hood, IoT financial metrics are data-modeling problems. A correct LTV calculation requires revenue and cost events to meet at the same grain. If billing is by account, telemetry is by device, support is by ticket, cloud cost is by service tag, and field work is by work order, the metric pipeline must map those records to a shared account or asset model. Otherwise the team may report healthy revenue while the expensive devices, noisy customers, or high-retention segments remain invisible.
Churn also needs precise event definitions. Subscription churn may mean payment cancellation, non-renewal, downgrade, device deactivation, loss of connectivity, or non-use. In IoT those states are not equivalent. A customer may keep paying while devices are offline, which hides product risk. A device may stay online while the paying contract is cancelled, which creates entitlement and support risk. A fleet may downgrade from premium analytics to basic monitoring, which changes ARPU, margin, and future expansion probability without becoming full churn.
Cost attribution is the other hard part. AWS Cost and Usage Reports, Azure Cost Management exports, Kubernetes labels, storage lifecycle policies, IoT hub metrics, and support-ticket systems can all help, but only if identifiers are consistent. The model should allocate ingestion, rules, storage retention, analytics jobs, notification traffic, support time, replacement hardware, and installation cost to the same account or device cohort used for revenue. That lets the team distinguish gross margin from contribution margin.
- Identity join: customer, tenant, device, site, contract, and plan identifiers must reconcile across systems.
- Event timestamp: acquisition, activation, first value, invoice, support, cancellation, and renewal dates should be modeled separately.
- Metric version: formulas for LTV, churn, CAC, and TCO should be versioned so historical reports remain explainable.
The under-the-hood test is whether a metric can survive a finance review. If an executive asks why payback changed, the team should trace the change to acquisition channel mix, churn movement, margin cost, billing plan, or device behavior. If the answer is only “the dashboard changed,” the metric is not mature enough for a launch decision.
6.5.1 Turn the Ledger Into a Launch Decision
- Choose the metric grain: customer, site, device, asset, contract, or cohort.
- Collect revenue, acquisition cost, support cost, connectivity cost, cloud cost, and renewal evidence at that grain.
- Calculate LTV, CAC, LTV:CAC, ARPU, churn, contribution margin, payback, and TCO with one documented formula set.
- Compare the result against the launch decision: scale, revise pricing, improve retention, reduce acquisition spend, or reject the model.
- Recheck the metric after a cohort ages, because early revenue can look healthy before churn and support costs arrive.
6.5.2 Test the Grain Against the Business
Beginner Example: A smart thermostat subscription should not compare hardware revenue with advertising spend only; it should include attach rate, monthly fee, churn, cloud cost, support, and warranty replacements.
Intermediate Example: A fleet-management vendor can separate paid-search customers from installer-referred customers to see whether lower CAC also brings better retention and lower support load.
Advanced Example: A predictive-maintenance platform should connect asset telemetry, work orders, support tickets, cloud inference cost, avoided downtime, and renewal outcome before claiming a strong LTV:CAC ratio.
6.6 Follow Revenue Through Retention
With the ledger defined, we can work through its money flows. A lemonade stand that spends $5 on supplies and sells for $10 has a simple transaction. A lemonade subscription that delivers every week for a monthly fee must also ask how long customers keep ordering, how much they pay over that relationship, what it cost to win them, and how many quit. Those questions become customer lifetime, LTV, CAC, ARPU, and churn. For this chapter, use margin-based LTV when judging viability; total customer payments are lifetime revenue and still have delivery costs to cover.
The Sensor Squad’s examples make the same distinction concrete. Temperature Terry compares CAC with the price of a trading-card booster pack and LTV with the value of all the cards inside. Light Lucy asks what happens when members leave a club of 100 friends. At 2% monthly churn, about 78 remain after a year; at 5%, about 54 remain. Each percentage applies to the members still present that month. Max the Motion Sensor asks whether customer value exceeds what was spent to acquire it. Bella the Buzzer adds storage, security, and support to the platform bill before deciding whether it is affordable.
Average revenue per user (ARPU) is average monthly revenue per active customer: revenue divided by active customers. Use the same month for revenue and customer counts. Churn rate is the percentage of starting customers who discontinue service during a stated period: lost customers divided by starting customers. A payment cancellation, a device becoming inactive, and a downgrade are different events. A customer may keep paying while devices are offline, so define the event before counting it.
Churn reduces the retained customer base repeatedly. With 10,000 starting customers and 2% monthly churn, twelve-month retention is 0.9812: approximately 0.785, or 7,850 customers. At 5% churn, it is 0.9512: approximately 0.540, or 5,400 customers. The three percentage point difference therefore means about 2,450 additional customers lost in a year. The figures use rounded retention factors.
Under a constant-rate model, average customer lifetime is 1 / monthly churn. At 2% it is 50 months; at 5% it is 20 months. That gives a 2.5× lifetime gap and, at unchanged revenue and margin over the full lifetime, a 2.5× LTV gap. The one-year retained customer counts differ by about 1.45× instead. Over 36 months, about 48% remain at 2% churn and 16% at 5%. The horizon matters whenever you compare those claims.

6.7 Calculate Lifetime Contribution
Retention becomes a financial estimate when we apply revenue and margin to each month. Lifetime value (LTV) is expected gross contribution from one customer over the stated horizon, after gross margin and retention but before acquisition cost. ARPU, gross margin, and retention drive LTV; sales and marketing spending drives CAC. Their ratio summarizes the relationship, but does not replace the underlying records.
For months 1 through n, use:
LTV = Σ(ARPU × Gross Margin × Retention^(month − 1)).
The exponent starts at zero because month one has full retention. With $20 monthly ARPU, 70% gross margin, and 5% monthly churn, retention is 95%. The monthly contributions are:
| Month | Calculation | Expected contribution |
|---|---|---|
| 1 | $20 × 0.70 × 1.00 | $14.00 |
| 2 | $20 × 0.70 × 0.95 | $13.30 |
| 3 | $20 × 0.70 × 0.9025 | $12.63 |
Continue that retention decay through month 36. The sum is approximately $235.82, rather than $504, which would apply $14 to every month without churn. This is a 36-month estimate, not a claim that every customer leaves exactly at month 36. Keep the horizon alongside the result so it can be compared with acquisition spending responsibly.
The calculator lets you change monthly ARPU, gross margin, monthly churn, and the LTV period. It reports total LTV, average lifetime, monthly contribution, and retention. Check which assumption changes the launch decision rather than choosing a favorable number in isolation.
6.8 Compare Acquisition Cost With Value
Now compare that contribution with the cost of winning the customer. Customer acquisition cost (CAC) is sales and marketing spend divided by new customers acquired. For example, $1,540,000 annual sales and marketing spend divided by 50 new customers gives $30,800 CAC. Keep the acquisition source visible: channels can produce customers with different costs and retention, even when their invoices look alike.
The LTV:CAC ratio divides customer lifetime contribution by acquisition cost for the same cohort. If you spend $100 acquiring someone who pays only $50 in total, the relationship loses money even before delivery cost. The ratio bands provide a first screening rule:
| Ratio | Interpretation |
|---|---|
| Below 1:1 | Unsustainable; lifetime contribution cannot recover acquisition spending. |
| 1:1 to below 3:1 | Marginal; improve retention or acquisition efficiency before scaling. |
| 3:1 to below 5:1 | Healthy unit economics; continue optimizing and consider moderate growth. |
| 5:1 or higher | Strong economics; consider greater growth investment after checking cash and absolute margins. |
Use at least 3:1 as the chapter’s minimum healthy target. A 5:1 ratio means $5 in lifetime contribution for each $1 spent acquiring the customer. It is a screening signal, not proof that fixed costs or cash requirements are covered.
Return to the thermostat offer: $10 per month for three years gives $360 lifetime revenue and a revenue-to-CAC ratio of 2.4:1 against the $150 acquisition cost. The company should seek longer retention or lower acquisition costs, but must first subtract delivery costs to claim contribution-based LTV:CAC. Attach rate, monthly fee, churn, cloud cost, support, and warranty replacements belong in that review. A hardware-revenue comparison against advertising alone misses the recurring service obligation.

6.9 Check When the Cash Comes Back
Even a healthy lifetime ratio can leave acquisition cash tied up for too long. Payback period is the number of months needed to recover CAC from monthly contribution. The simple formula is:
Payback = CAC / (ARPU × Gross Margin).
The parentheses matter: first calculate monthly contribution, then divide acquisition cost by it. At $5,000 CAC, $500 monthly ARPU, and 70% margin, monthly contribution is $350 and payback is about 14.3 months. That is inside the chapter’s target of less than 18 months for healthy SaaS/IoT economics. Shorter payback reduces growth cash requirements and exposure to customers leaving before acquisition cost is recovered.
Compare that timing with expected customer lifetime and the deployment’s billing cadence, hardware subsidy, and activation lag. A ratio describes the total relationship; payback asks when cash returns. If payback exceeds expected customer lifetime, adding customers burns cash. The calculator varies CAC, ARPU, and margin to show the relationship between monthly contribution and recovery time.
6.10 Decide Whether the Economics Can Scale
“A high LTV:CAC ratio always means a great business.” Not necessarily. If CAC is extremely low (e.g., $10) and LTV is $50, the 5:1 ratio looks healthy, but the absolute profit per customer ($40) may be too small to cover fixed costs like platform maintenance, engineering salaries, and customer support infrastructure. Always evaluate absolute margins alongside ratios.
“Raising prices is the fastest way to improve ARPU.” Price increases can accelerate churn. At unchanged gross margin, raising monthly ARPU from $20 to $30 while monthly churn rises from 3% to 6% reduces simplified revenue LTV from about $667 to $500; test price and retention together.
“Hardware margin is the real profit driver in IoT.” The hardware-versus-service comparison matters for companies such as Nest, Ring, and Peloton: slim or negative hardware margins can make recurring subscription and data-service revenue central to the lifetime economics. Check the actual product and cohort before assuming which stream supplies most lifetime revenue. Treating hardware as a customer acquisition channel rather than a profit center often produces better long-term economics.
“Monthly churn below 5% is acceptable.” At 5% monthly churn, only 54% of customers remain after 12 months and just 16% after 36 months. For a subscription IoT cohort, 3% monthly churn implies about 31% annual churn under a constant-rate model; assess it against the product’s margin, CAC and payback target. At 1.5% monthly churn, the constant-rate model implies about 16.6% annual churn and roughly 5.6 years of expected customer lifetime; set a target from this product’s economics.
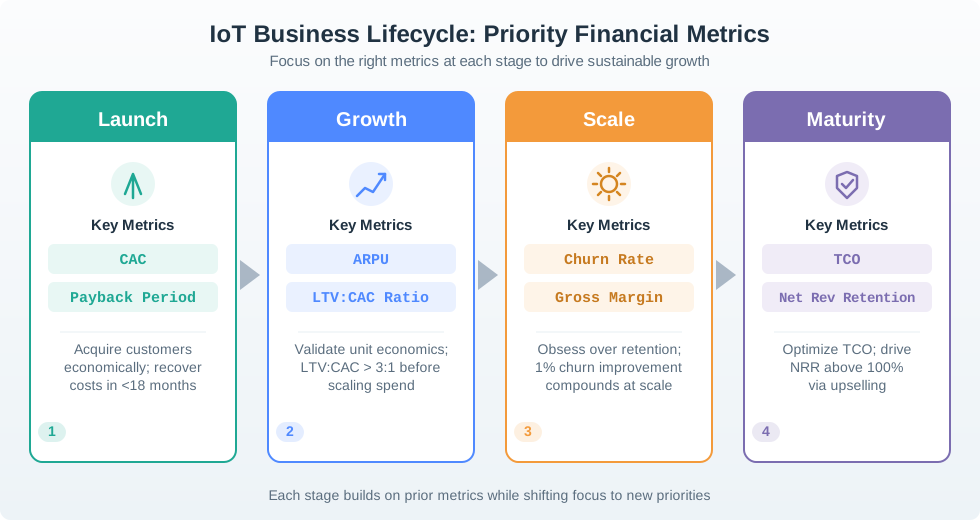
Business stage determines which weakness needs attention first. At launch, prove that customers can be acquired economically and that payback is within 18 months. During growth, ARPU and LTV:CAC matter: validate a ratio above 3:1 before scaling spending. At scale, prioritize churn and gross margin because even a 1% churn improvement compounds across the customer base. At maturity, optimize platform TCO and seek net revenue retention above 100% through expansion and upselling among existing customers.
Total cost of ownership (TCO) is the full platform cost over the deployment lifecycle. Include platform fees, integration, data storage, API usage, and compliance; calculate their shares from the selected deployment. These costs belong alongside support, security, and ongoing integration maintenance when comparing platform and business-model choices. If TCO grows faster than ARPU, revenue can scale while margin falls.
6.11 IoT Unit Economics Metrics
Use IoT Unit Economics Metrics Contracts to carry the ledger into a layered workflow. It covers hardware and installation cost, connectivity and cloud cost of goods sold (COGS), cohort margin, LTV:CAC and payback, telemetry and billing identity, and attribution across IoT hubs, storage, warehouses, support, and field operations. The workflow turns a promising headline ratio into evidence that can be traced and revised as the cohort ages.
6.12 Summary
A useful financial review begins with one cohort and a documented metric grain. Link revenue, acquisition spending, connectivity, cloud, support, warranty, field service, and renewal evidence before calculating LTV, CAC, ARPU, churn, payback, or TCO. Distinguish contract cancellation from device inactivity, and keep revenue separate from contribution.
Retention compounds. At constant monthly churn, 2% implies a 50-month average lifetime while 5% implies 20 months. The worked 36-month example with $20 ARPU, 70% margin, and 5% churn yields about $235.82. Compare that contribution with CAC, then test the timing: a 3:1 minimum ratio and a payback below 18 months are useful screening targets, while absolute margins and full lifecycle costs still determine whether growth is viable.
Scale only when the same cohort’s retained contribution can recover acquisition and delivery costs in a cash-flow timetable the business can sustain.
