22 Industry 4.0: Industrial Revolutions and Adoption
More
Depth: Practitioner
Progress saves as you read. Mark sections complete as you go; your progress appears in the sidebar.
- Podcast audio coming soon
- Character narration audio coming soon
22.1 From One Monitored Machine to a Connected Plant
Industry 4.0 connects physical production with digital information so that machines, people, and business systems can coordinate their work. Industrial Internet of Things (IIoT) systems operate where timing, reliability, safety, and traceability are part of the product. One prevented failure can pay for a sensor program when the avoided downtime cost is real and the maintenance action is trusted.
A factory has proved that one monitored machine can warn staff before a stoppage. Its next decision is harder: which technologies should connect the wider plant, where should each decision sit, and how can the team modernize without turning a useful pilot into an unsafe control shortcut? New sensing must fit the installed control and maintenance path. Analysis must not silently take authority from safety controls, and the team must compare downtime and service cost before claiming improvement.
The problem is therefore how to turn a useful warning into an integrated operating process. We will first compare the four industrial revolutions, then test the value of predictive maintenance and digital twins, place decisions across ISA-95 levels, and choose a defensible adoption step. These examples prepare the wider discussion of brownfield integration, operational technology (OT) security, and deployment economics. Review Industry 4.0: Trusted Operations when you need the operating-authority boundary behind the factory’s pilot.
KEY CONCEPTS
- Plant integration
New sensing must fit the installed control and maintenance path.
- Operational boundary
Analysis must preserve the authority of safety controls.
- Adoption evidence
Compare downtime and service cost before claiming improvement.
22.2 Part Objectives
- Test the four industrial revolutions with a concrete scenario and pass criteria.
- Validate adoption pitfall: phase skipping with a concrete scenario and pass criteria.
22.3 What Each Industrial Revolution Added
The factory’s connected machine still depends on motors, controllers, and production equipment from earlier eras. Each industrial revolution reorganized work as well as adding technology. The chapter uses 1784, 1870, 1969, and 2011+ as timeline anchors; the examples explain what changed rather than suggesting that every invention appeared in its anchor year.
Industry 1.0: mechanization (1784). Water wheels and steam engines replaced human and animal power, mechanical looms automated weaving, and the factory system centralized production. Imagine a textile mill where workers had woven cloth entirely by hand: exhausting, slow work becomes mechanically powered production. The James Watt steam-engine illustration replaces 50 workers’ muscle power with one engine, like upgrading from rowing a boat to using a motor. In British cotton spinning, Maw and colleagues estimate worker output per day in the 1790s at 9–18 times hand-spinning levels, depending on the machine and yarn comparison.
Industry 2.0: mass production (1870). Electricity enabled more flexible factory layouts, division of labor, and conveyor belts. Henry Ford’s assembly line in 1913 moved a car past specialized workers: one installed wheels, another the engine. This division of labor changed how cars were assembled. Think of one chef preparing whole meals giving way to a restaurant kitchen with stations. Interchangeable parts enabled standardization; telegraph and telephone improved coordination. Electrification and assembly lines increased output by changing factory layout and production flow.
Industry 3.0: automation (1969). Computers and electronics automated selected repetitive tasks. A programmable logic controller (PLC) replaced relay logic with software. Supervisory control and data acquisition (SCADA) systems enabled centralized monitoring, while computer numerical control (CNC) machines automated precision manufacturing. Industrial robots, including Unimation in 1961, performed dangerous tasks. A programmed CNC machine can mill, drill, and shape metal precisely, running 24/7 without intervention during an automated cycle. The analogy is moving from handwritten recipes to a programmable bread machine: repeatable execution still follows a program.
Industry 4.0: cyber-physical systems (2011+). A cyber-physical system connects physical processes with digital sensing, computation, and action. The same CNC machine now has vibration sensors that, in the illustration, detect bearing wear 2 weeks before failure. Replacement parts are ordered automatically; when Machine #3 needs a bearing, Machines #1 and #2 adjust their schedules. The change resembles individual smart devices becoming a coordinated smart home: information allows the system to adapt together.
IoT sensors provide real-time visibility; AI and machine learning support predictive analytics; cloud and edge computing process data at scale. Vertical integration connects field devices to enterprise resource planning (ERP), while horizontal integration connects supply-chain partners. Digital twins add virtual representations of assets. These capabilities can support self-optimization with minimal human intervention, within an approved operating boundary. The organizational transformation takes 3–5 years in the chapter’s adoption framing.
An Industry 4.0 report cites expected staff-productivity gains of 15–30% and equipment-downtime reductions of 30–50% for adopting projects. These are planning estimates, not guaranteed results. Sensor installation alone cannot establish that the factory has achieved them.
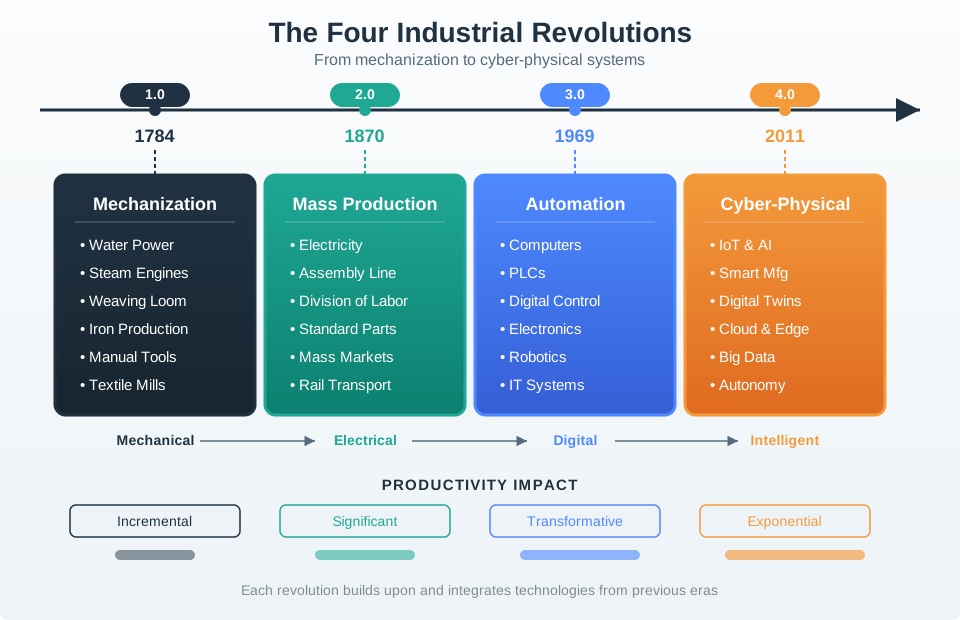
Read the bottom strip first: mechanical, electrical, digital, intelligent. The panels show steam and water, electricity and assembly lines, computers and controllers, then connected devices, twins, cloud, edge, and analytics. The productivity row presents increasing impact, but its labels are not measurements for this factory. The closing line matters most: each era builds on earlier technologies. A plant running twins still uses motors, controllers, and lines built decades ago.
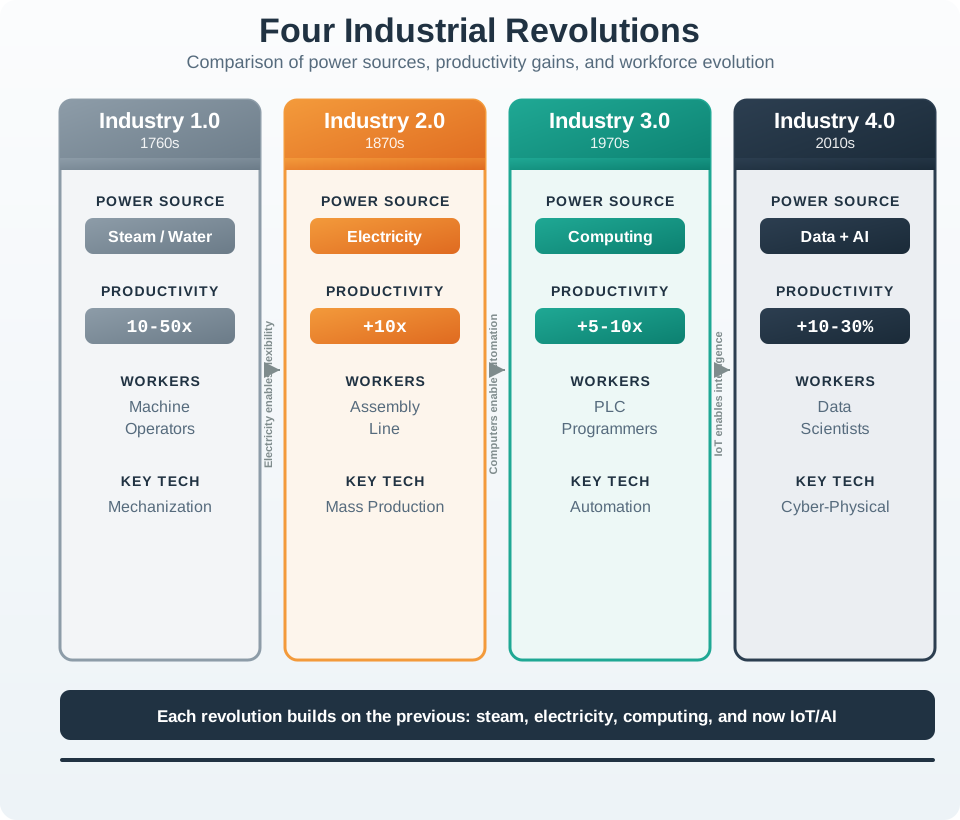
Read left to right, comparing each Enabler, Work Shift and Production Result. Industry 1.0 uses water and steam power as machines replace human and animal effort. Its cotton-spinning figure is the 9–18× estimate above. Industry 2.0 adds electric power and mass production, with specialized jobs and car assembly falling from 12+ hours to 90 minutes. Industry 3.0 uses computers for automation, replacing relay logic with software and showing 5–10× gains. Industry 4.0 connects systems and needs digital and analytical skills. It shows the 15–30% staff-productivity and 30–50% downtime figures cited above. These broad figures are not comparable guarantees; use the specific cited evidence above to assess projects. The bottom strip links electricity to factory flexibility and computing to automation. IoT adds intelligence when sensing, analysis and work act together.
22.4 Test the Factory’s Maintenance Business Case
Coordination must produce an operational result. For the small automotive parts factory with 5 CNC machines, the illustrative baseline is reactive maintenance: each machine has 3 unplanned failures per year, each lasting 6 hours, with lost production costing $8,000 per hour. Annual downtime cost is therefore:
5 machines × 3 failures × 6 hours × $8,000 = $720,000.
The proposed IIoT investment is $2,000 in vibration sensors per machine plus a $5,000 gateway: $15,000 total. Assume predictive maintenance catches 70% of failures early. Across 15 annual failures, that means 10.5 expected failures avoided, not a literal fractional failure in any one year. Avoided downtime is worth 10.5 × 6 hours × $8,000 = $504,000 annually. Subtracting the initial investment gives a Year 1 net benefit of $489,000, and simple payback is $15,000 ÷ $504,000 × 365 = 11 days, rounded.
Under those assumptions, even a small factory can see short payback. Lower downtime cost, weaker detection performance, or expensive integration changes the result quickly. The pilot’s useful warning becomes credible adoption evidence only when maintenance acts on it and the avoided production loss is supported by the operating record. Compare that record with the baseline before claiming savings.
22.5 Use a Digital Twin to Test Process Changes
Maintenance is one use of data; changing a production process is another. A digital twin is a virtual representation of a physical asset or process. In the chemical-plant example, it models a batch-mixing vessel with physics simulation so engineers can test settings before changing production.
Each batch takes 4 hours, with 1,000 gallons of nominal product worth $50,000, or $50 per gallon. Engineers currently adjust temperature, pressure, and mixing speed from experience, and yield varies 92–96%, averaging 94%. Software, sensors, and engineering for the twin cost $150,000.
The twin runs 10,000 virtual batches. It identifies settings of 165°C rather than 170°C, 2.3 bar rather than 2.0 bar, and 450 RPM rather than 500 RPM. Physical testing of the new parameters raises yield from 94% to 97.5%. That is 3.5 percentage points, adding 35 gallons per nominal 1,000-gallon batch: about 3.7% more than the original 940 gallons of saleable output.
Across 50 batches per month, the increase is 1,750 gallons. At $50 per gallon, additional revenue is $87,500 per month, giving illustrative payback of $150,000 ÷ $87,500 = 1.7 months. This is a revenue-based calculation under the stated assumptions. The mechanism is the important part: virtual experiments can identify changes that would be too expensive or risky to test repeatedly on the production line. Physical verification connects the model’s suggestion to an actual result.
22.6 Put Each Decision at the Right Level
A profitable proposal still needs an appropriate control path. The automotive supplier’s 12 stamping presses produce body panels, joining factory-floor OT to IT and enterprise systems through ISA-95 boundaries. The levels separate decisions by purpose and timescale; a planning system’s information must reach production without taking over fast machine control.
| ISA-95 level | Role in this plant | Timing and interface |
|---|---|---|
| 0–1: field and control | Twelve press controllers and synchronized motion | 10 ms cycle time; EtherCAT |
| 2: SCADA | A human-machine interface (HMI) displays real-time press status | 100 ms data refresh; Modbus TCP to PLCs |
| 3: manufacturing execution system (MES) | Production scheduling, overall equipment effectiveness (OEE) calculation, and quality tracking | 1-second data aggregation |
| 4: ERP | SAP order management, inventory, and shipping | Minute-to-hour response is acceptable |
A customer order change at Level 4 requires switching panel type mid-shift. SAP sends the change to MES for rescheduling in 2 minutes. MES queues the new panel program in SCADA in 10 seconds. SCADA sends new die parameters to the PLC in 1 second. The PLC executes the adjustment to stroke, pressure, and timing at Level 0 in 100 milliseconds.
The example reports a panel-type switch in 3 minutes, compared with 30 minutes for manual changeover, enabling small-batch production without efficiency loss. Those are scenario outcomes; the timing boundary explains the architecture. ERP working at minute-scale cannot directly control a press with a 10 ms cycle. Fast decisions stay in the local control path, while higher levels receive summaries and pass down approved plans.
22.7 Keep People, Hazards, and Interfaces in View
The same integration changes work beyond the machine. The NPTEL IIoT sequence puts manufacturing, healthcare, transport and logistics, mining, and firefighting in one application frame. Across these domains, a linear chain becomes a connected ecosystem: equipment, workers, supply-chain records, sensors, and operating platforms exchange state so organizations can respond to an outcome rather than only ship a product.
This shift connects to lower-cost automated tasks, human supervision of more capable machines, and increasing demand for digital and analytical skills. Precision agriculture, digital healthcare, and digital mining create composite industries and new roles, while highly automated work reduces demand for some unskilled tasks. Treat this as a constraint to examine in the proposed workflow. Name the task moving to a machine, the decision remaining with a person, the skill required, and how an operator can intervene. A robot that senses, reasons, and acts still needs a defined human-supervision boundary.
22.8 Hazards and Interoperability Stay in the System
Worker health and safety, regulatory compliance, environmental protection, and optimized operations remain safety challenges. The hazard record must consider hazardous substances, oxygen deficiency, particulates, radiation, and physiological stress. Standardization supports system and application interoperability, but semantic meaning, security and privacy, and radio access still present unresolved boundaries. Connecting more equipment removes neither the hazard record nor the interoperability record.
The product examples illustrate bridging roles. Rt Tech software addresses industrial efficiency and energy management. IRM 1500 and ACE 1000 radio modems provide simple machine-to-machine data links, including IP and non-IP serial devices. A Comtrol IO-Link Master gateway connects into EtherNet/IP, PROFINET, and Modbus TCP networks. A product name does not settle the integration: preserve the device protocol, translated interface, safety authority, security boundary, and failure behavior in the review.
22.9 Advance One Maturity Step at a Time
Return to the factory’s pilot. Before buying advanced analytics for the whole plant, ask what the existing data path can reliably support. The maturity model makes the dependencies visible.
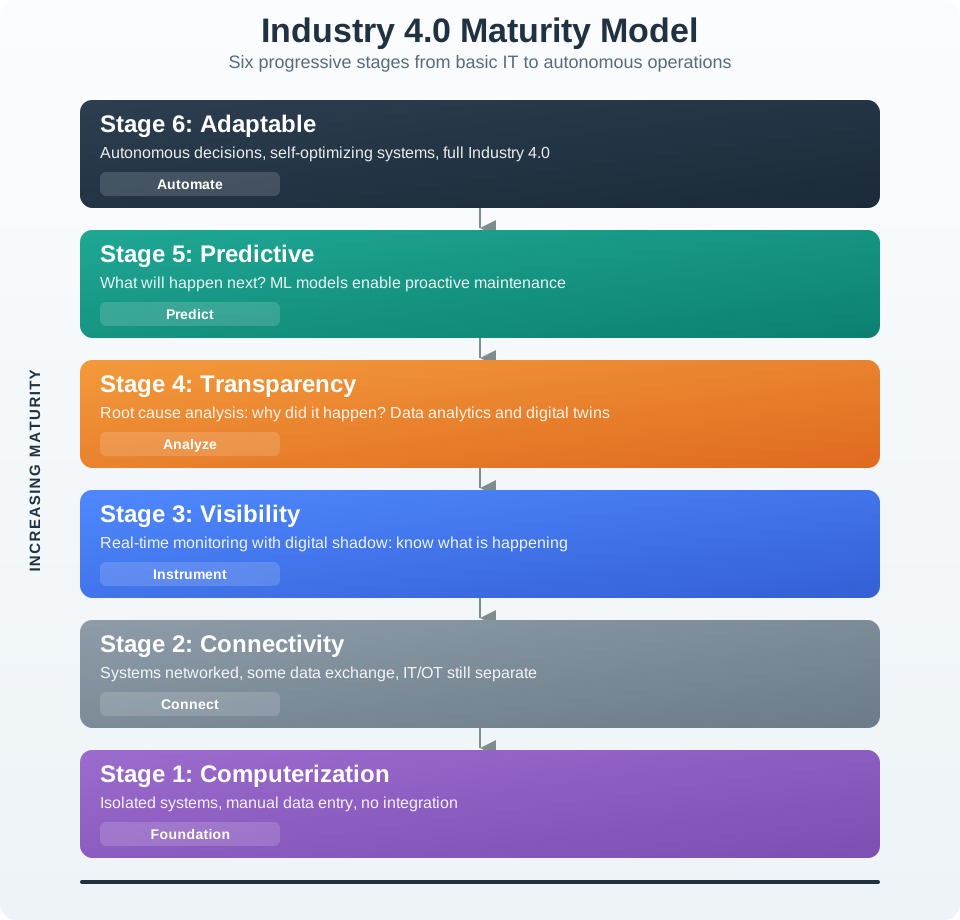
Read the six stages in order. Computerization comes first. Connectivity then adds reliable machine networking and data capture. Visibility adds dashboards, alerts, anomaly detection, and OEE tracking of equipment performance. Transparency uses past data to explain downtime, scrap, or energy spikes. The Predictive stage uses models to warn of likely failures before they happen. The Adaptable stage lets the system decide in real time within set limits. Finally, follow the Decision Rule: advance one step, then measure the result before adding more automation.
A plant at Connectivity needs dependable networking and capture before predictive models can help. A plant at Visibility can justify dashboards, anomaly detection, and OEE tracking, but should not promise autonomous optimization yet. At Transparency, historical context supports explanations. Each stage relies on the one below: weak links or missing context undermine later action.
Phase skipping happens when advanced analytics arrive before dependable connectivity, an asset inventory, and timestamped process data. A dashboard or model cannot supply those missing foundations. The result can be an expensive data platform operators do not trust.
Classify the current maturity level, pick the next operational bottleneck, verify the equipment-to-decision data path, then automate. Choose one improvement that advances the plant a single stage and measure its operational result. The roadmap should state what evidence permits each move from visibility to transparency, transparency to prediction, and prediction to adaptation. Keep risk, manual overrides, and system fit visible before granting more control.
Summary
Industry 1.0 mechanized work, Industry 2.0 electrified mass production, Industry 3.0 automated machines, and Industry 4.0 coordinates cyber-physical systems. The timeline anchors are 1784, 1870, 1969, and 2011+. The factory’s maintenance warning becomes useful at plant scale when sensing, analysis, and operating work connect.
The worked examples connect avoided downtime and improved yield to explicit financial assumptions. ISA-95 keeps fast control near the machine while planning remains at enterprise level. Adoption also needs human supervision, hazard and interoperability records, and evidence that connectivity and visibility can support prediction and adaptation.
Advance one maturity step, measure the operating result, and preserve the control boundary before granting the connected system more authority.
Carry that evidence into Industry 4.0: Technologies and Integration, beginning with Industry 4.0 Technologies.
