23 Industry 4.0: Technologies and Integration
23.1 Start With the Decision
Industry 4.0 links sensors, machines, models, and control. Place each tool where it can change a factory decision.
23.2 Route Overview
This is part 2 of 2. Review Industry 4.0: Industrial Revolutions and Adoption for the preceding evidence.
23.3 Learning Objectives
- Test industry 4.0 technologies with a concrete scenario and pass criteria.
- Validate dashboards need action loops with a concrete scenario and pass criteria.
23.4 Chapter Roadmap
- Industry 4.0 Technologies
- Digital Twins and Smart Factories
- MVU: ISA-95 Automation Levels
- Checkpoint: Technology Placement
- Knowledge Check: ISA-95 and Integration
- ISA-95 Latency Validator
- Brownfield vs Greenfield Tradeoff
- OT-First vs IT-First Integration
- OT Security Differs From IT
- IIoT Predictive Maintenance ROI
- Brownfield vs Greenfield IIoT
- OEE Improvement Impact
- OT vs IT Protocol Confusion
- In 60 Seconds
- Checkpoint: Business Case and Risk
- ISA-95 Timing Check
- Industry 4.0 Tech Relationships
- Quiz: Industry 4.0 Concepts
- Interactive Quiz: Sequence the Steps
- Common Pitfalls
- 1. Treating Monitoring as Control
- 2. Ignoring Maintenance Windows
- Dashboards Need Action Loops
- Label the Diagram
- Code Challenge
- Summary
- See Also
- What’s Next
23.5 Industry 4.0 Technologies
Industry 4.0 relies on the convergence of multiple technologies:
Before reading the technologies in Figure 23.1, look at what the figure says they are for.
The five numbered requirements on the left of Figure 23.1 are the familiar part, so move past them to the band they feed. Convergence is defined there as something narrow and testable: a measured plant condition changes a real work decision in time to matter. The spindle example below it shows what that costs. A vibration signal alone proves nothing. It has to be tied to machine state, a baseline, and a threshold or model before it can become a work order in the maintenance system. The timing note on the right is the boundary that keeps the picture honest. A control loop that must answer in a few milliseconds cannot wait for the cloud, so not every decision belongs in the same place.
This diagram introduces ISA-95 activity levels across industrial automation. A control loop’s deadline comes from the process and design requirements, not from a fixed timing limit assigned to an ISA-95 level.
Inspect Figure 23.2 to compare how response windows relax from field sensing and control to operations and business planning.
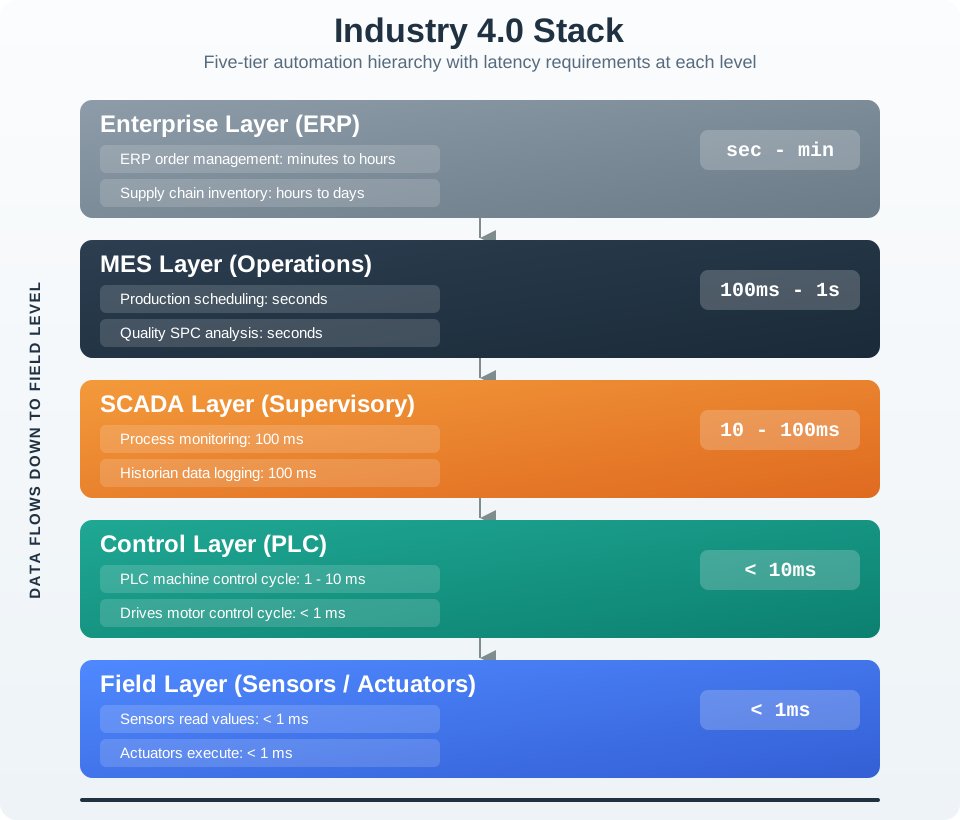
Read Figure 23.2 from Level 0 up. Level 0 is the physical process. At Level 1, sensors and actuators touch it. Level 2 covers monitoring and control, including PLCs. Level 3 handles manufacturing operations. Level 4 covers business plans. These are activity levels, not timing rules. The response deadline comes from the process and system design. A safety control loop may need a fast local response. Send checked machine state upward for operations and planning, but do not wait for a cloud round trip when a local control decision is due.
23.5.1 Cyber-Physical Systems (CPS)
Cyber-Physical Systems integrate computation, networking, and physical processes:
- Tight coupling: Physical processes affect computations, computations control physical processes
- Real-time constraints: Must respond within strict time limits (often <1 ms)
- Networked: Distributed components communicate over industrial networks
- Autonomous: Make local decisions without human intervention
- Examples: Adaptive cruise control, smart grids, robotic assembly cells
Figure 23.3 turns the idea of a cyber-physical system into one machine and the loop that closes around it.
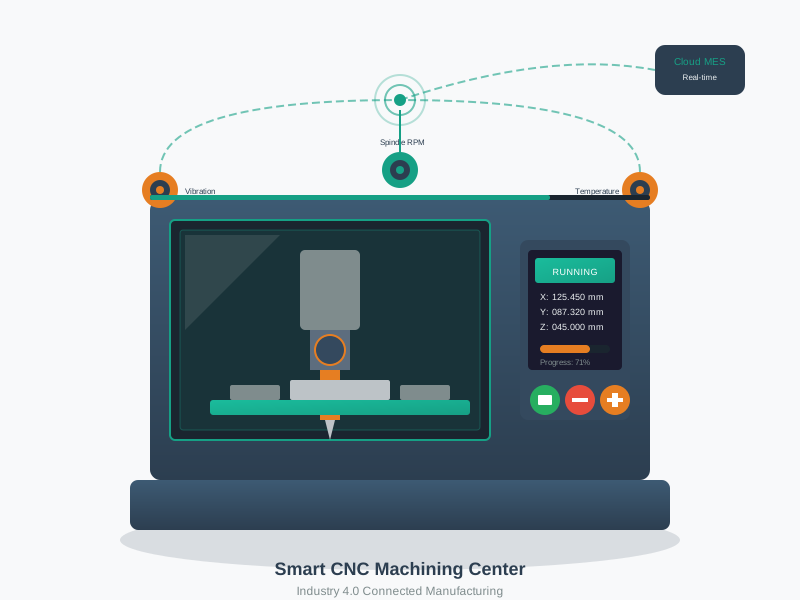
Read Figure 23.3 in three stages. The machine on the left is doing ordinary work, and its panel shows position and a running state; the additions that matter are the four signals beside it, including vibration and tool wear, which the controller does not need but a maintenance team does. The middle stage refuses to treat those numbers alone as evidence. It ties them to machine state and service history, and expects the threshold or model to be explainable. The third stage is where value appears: a work order with a named owner, an approved change, and a check that the change worked. The line at the foot is the caution for this section.
CNC machines represent a core Industry 3.0 technology now enhanced with IoT capabilities. Modern connected CNC systems continuously stream operational data to analytics platforms, enabling predictive maintenance when the signals are tied to machine state, maintenance history, and a work-order process.
CPS differs from traditional embedded systems through continuous feedback loops, network connectivity, and autonomous decision-making capabilities.
23.5.2 Digital Twins
A digital twin is a real-time virtual replica of a physical asset, process, or system:
Key characteristics:
- Bi-directional data flow: Physical sensors feed the digital model; digital simulations inform physical operations
- Real-time synchronization: Updates reflect physical state within milliseconds
- Predictive capabilities: Run simulations to test scenarios without disrupting production
- Lifecycle coverage: Design, manufacturing, operation, maintenance, retirement
Use cases:
- Product design: Test virtual prototypes before building physical ones
- Process optimization: Simulate production changes without stopping the line
- Predictive maintenance: Model asset degradation to schedule maintenance
- Operator training: Train on virtual replicas without risk
Deployment patterns:
- Commissioning simulation: Test control logic, robot paths, and operator workflows before equipment arrives or before a shutdown window begins.
- Fleet monitoring: Compare many similar assets so abnormal vibration, temperature, fuel use, or quality drift stands out early.
- Process optimization: Run what-if experiments in a model before changing recipes, pressure, speed, or temperature on the live line.
- Training and safety: Let operators practice rare faults, alarm floods, and recovery procedures without putting production at risk.
The economics of digital twins follow a clear pattern: the model is valuable when it changes a costly decision. The break-even calculation favors assets with high downtime cost, expensive physical tests, repeated operating cycles, and enough sensor data to keep the model trustworthy.
Figure 23.4 answers what makes a twin different from a dashboard, and the answer is that the arrows run both ways.
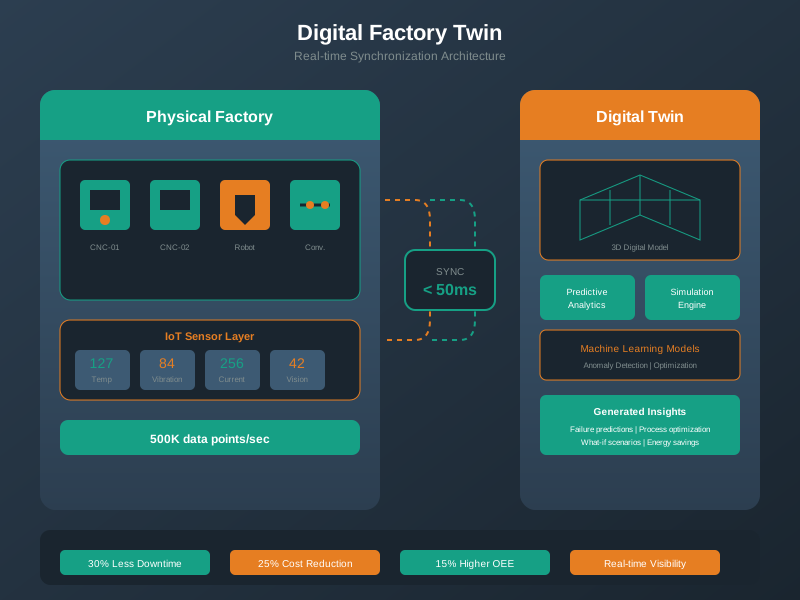
The left half of Figure 23.4 is a real machine with four measurements coming off it: spindle speed, vibration, temperature and tool wear. The right half is the model those readings keep current. Between them sit two arrows, not one. Readings flow right to keep the model honest, and simulation results flow left to change how the machine is run. That return arrow is the whole argument, because without it the twin is only a display. The band beneath names what the return path is for: trying a recipe change without stopping the line, predicting wear early enough to schedule the work, and training an operator on faults nobody wants to stage in production. Each is a costly decision the model can move.
Digital factory twins enable manufacturers to test process changes, train operators, and optimize production schedules in simulation before committing to physical changes. This virtual environment reduces commissioning time and minimizes the risk of costly production disruptions.
23.5.3 Smart Manufacturing
Smart manufacturing applies IoT, AI, and automation to create adaptive, self-optimizing production systems:
Characteristics:
- Connectivity: All assets networked and communicating
- Visibility: Real-time monitoring of all processes
- Transparency: Understanding cause-and-effect relationships through data
- Predictability: Forecasting future states using AI models
- Adaptability: Automatic response to changing conditions
Key technologies:
- Industrial IoT sensors: Temperature, vibration, pressure, vision systems
- Machine learning: Quality prediction, anomaly detection, optimization
- Advanced robotics: Collaborative robots (cobots) working alongside humans
- Additive manufacturing: 3D printing for customized production
- Augmented reality: AR glasses for maintenance guidance
Figure 23.5 shows what has to be true before a wall of screens becomes useful rather than merely impressive.
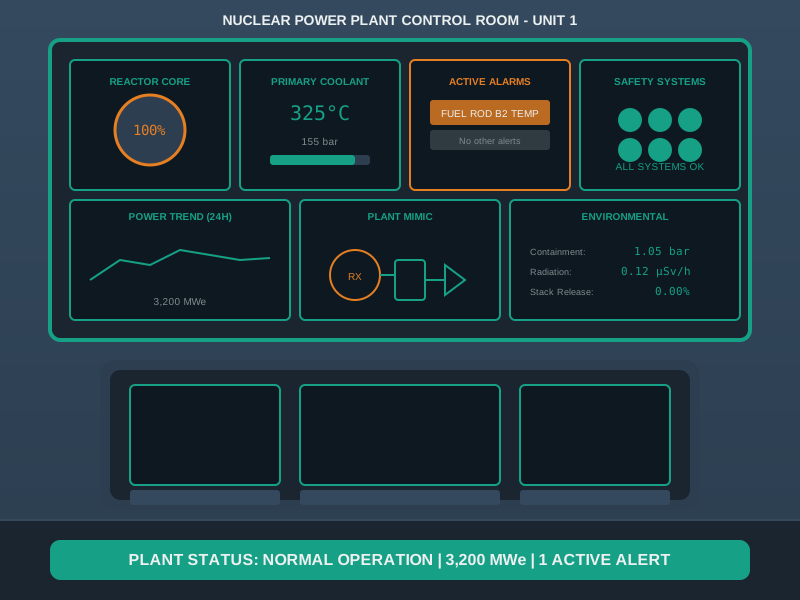
Thousands of sensors feed the left side of Figure 23.5, and the middle panel squeezes them into one view an operator can hold in mind. The sample reading, a reactor core and primary coolant at 325 degrees, is there to show the form: a named asset, a named quantity, a number. The third panel is the demanding part. Every signal on that screen needs an owner, an account of the threshold or model behind its alarm, a route to a work order, and a rule for what to do when the data itself looks wrong. Without those, an anomaly highlight is only a colour on a screen.
Centralized control rooms provide operators with comprehensive visibility across distributed production facilities. Modern SCADA systems aggregate data from thousands of sensors into intuitive dashboards that highlight anomalies and guide rapid response to equipment issues.
23.5.4 Horizontal and Vertical Integration
Industry 4.0 requires integration across two dimensions:
Core Concept: ISA-95 has five levels: Level 0 physical processes, Level 1 sensors and actuators, Level 2 monitoring and control including PLCs, Level 3 manufacturing operations including MES, and Level 4 business planning including ERP. The level labels do not impose fixed response-time limits. Why It Matters: Place each function at the level responsible for that activity, and set its deadline from the process and safety requirements. A cloud or ERP service should not own a fast motor-control loop when its network and business-planning role cannot meet the design deadline. Key Takeaway: Use ISA-95 to describe industrial activities and interfaces; determine timing constraints from the actual application before selecting protocols and computing infrastructure.
Vertical Integration (within a factory):
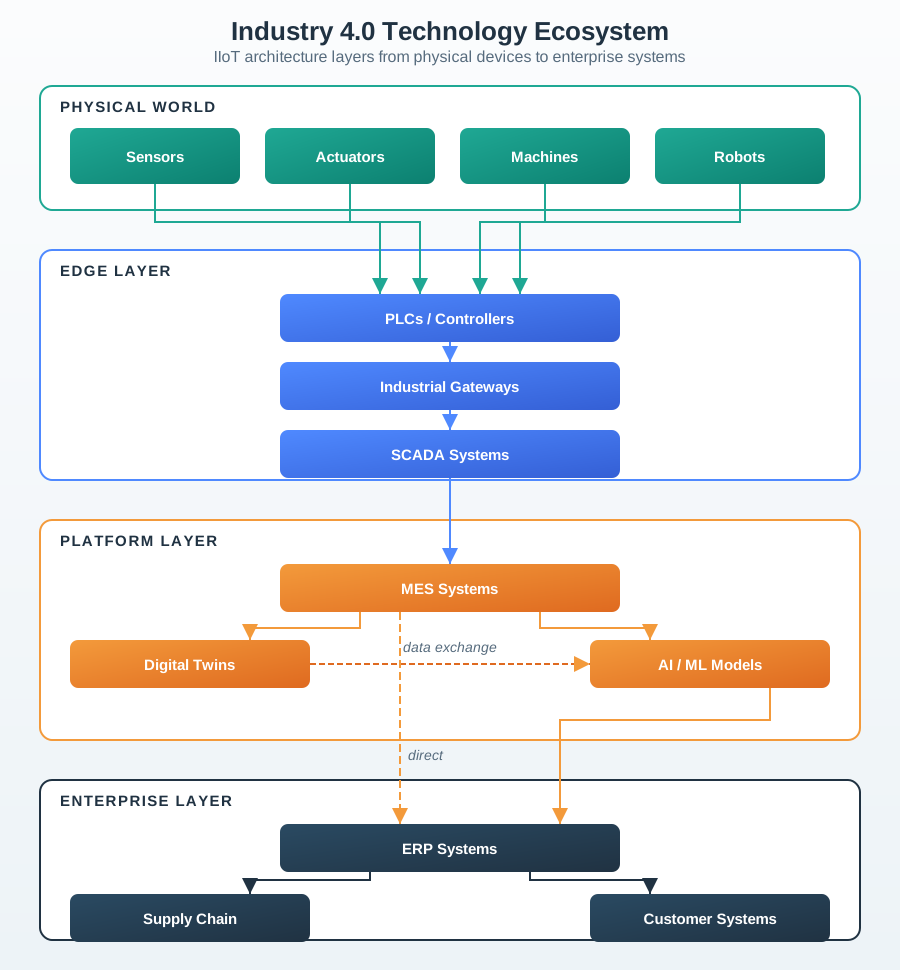
Read the response-time column on the right of Figure 23.6 before the level names on the left.
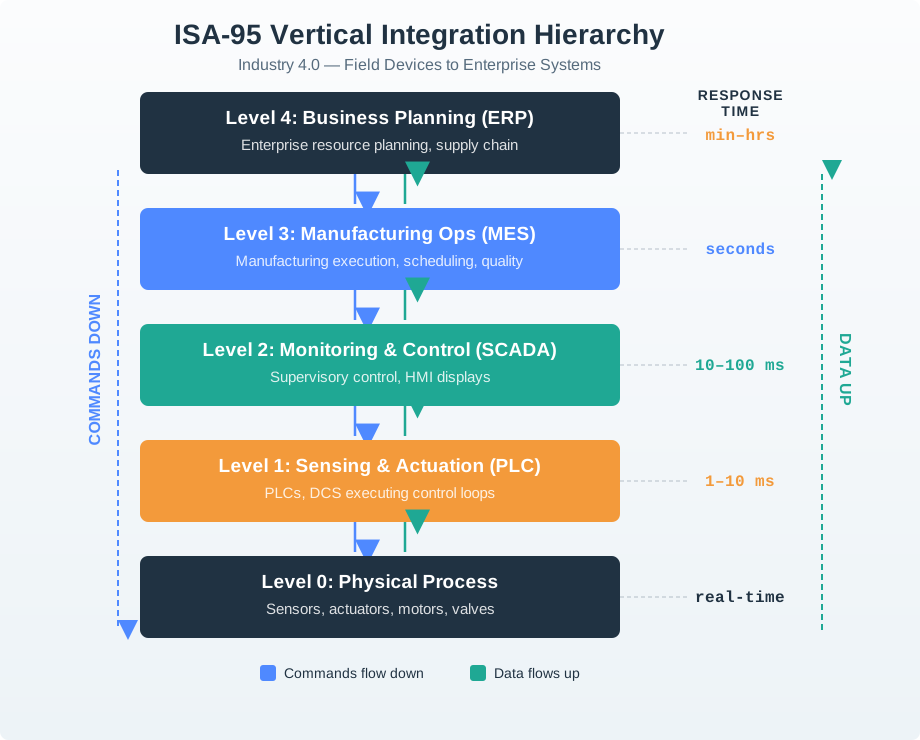
The five levels in Figure 23.6 describe different activities, from physical processes and sensing through control, manufacturing operations, and business planning. The two arrows explain the traffic: commands travel down and data travels up. A function’s response deadline comes from its process and safety requirements, not from a fixed ISA-95 timing window. A planning system should not own a control action whose deadline it cannot meet.
Instead of abstract level names, this diagram shows concrete examples of what happens at each level. This practical view helps students understand what information flows between levels and why each layer exists.
Inspect Figure 23.7 to place each example decision at the ISA-95 level whose timing and authority fit it.
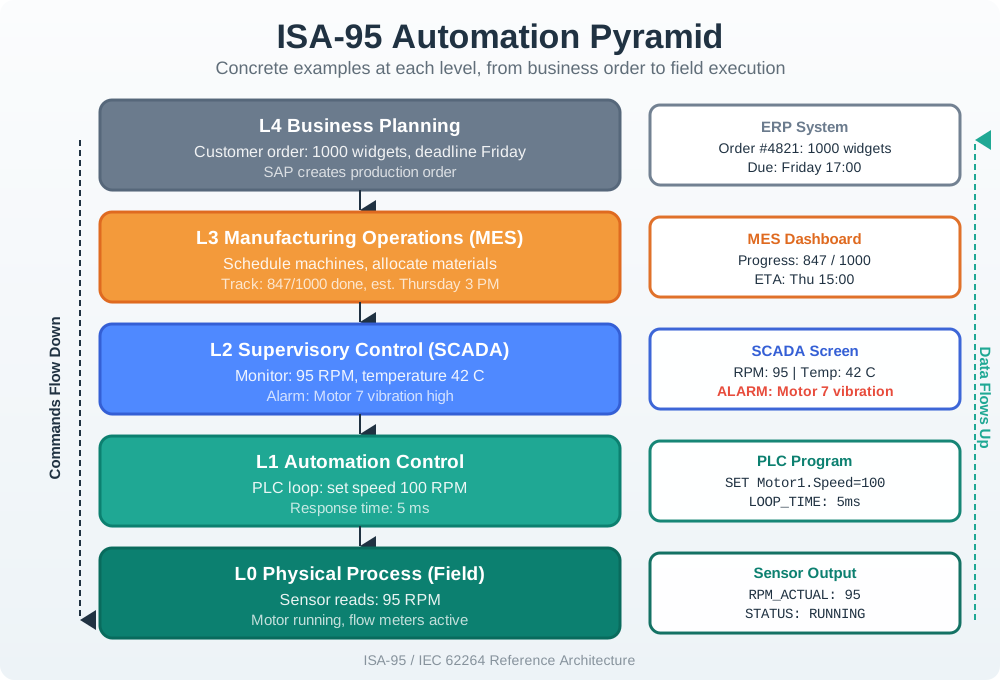
Read Figure 23.7 down from the order for 1,000 widgets due Friday. ERP owns the business commitment; MES turns it into manufacturing operations. SCADA supervises live values and alarms, Level 2 PLC logic executes the example five-millisecond loop, and Level 1 devices sense and actuate the physical process. Data crosses every boundary, but authority, deadline, and safety context must travel with it. A cloud view may inform planning without becoming the owner of a fast control action.
Horizontal Integration (across supply chain):
- Suppliers provide real-time inventory data
- Manufacturers share production schedules
- Logistics partners track shipments
- Customers trigger production through orders
- End-to-end visibility from raw materials to customer
Inspect Figure 23.8 to follow how shared operational data coordinates suppliers, production, logistics, and customers.
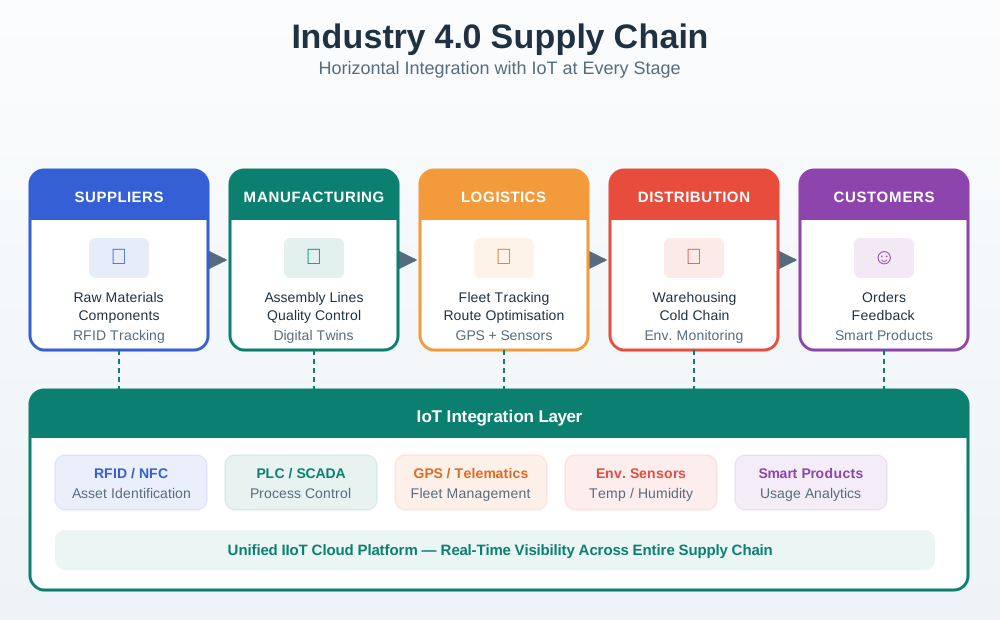
Follow one item across the chain. Check shared data at handoffs. Read Figure 23.8 from suppliers providing inventory status to manufacturers sharing production schedules. Partners then track shipments, and customer orders can trigger production rather than waiting for a separate planning cycle. The return arrows create feedback for continuous optimization across the value chain. End-to-end visibility is the intended gain, but it depends on shared identifiers, time, quality, and access rules. Horizontal integration breaks down IT and OT silos only when each party understands the same event and owns its response.
This horizontal integration diagram shows how Industry 4.0 connects the entire value chain, enabling real-time data flow from suppliers through manufacturing and logistics to customers, with feedback loops driving continuous optimization.
This integration breaks down traditional IT/OT (Information Technology/Operational Technology) silos, enabling data-driven decision making across the entire value chain.
 Checkpoint: Technology Placement
You now know:
- Cyber-physical systems keep computation and physical processes tightly coupled, often under 1 ms.
- Digital twins earn their cost when simulation changes a real design, commissioning, training, maintenance, or process-optimization decision.
- Vertical integration connects ISA-95 Levels 0-4 inside the factory, while horizontal integration connects suppliers, manufacturers, logistics partners, and customers.
The remaining sections are risk filters. Use them to test whether the architecture respects brownfield constraints, OT security, protocol reality, and the action loop that turns prediction into work.
Validate whether your system’s latency meets ISA-95 requirements.
23.6 Brownfield vs Greenfield Tradeoff
Option A (Brownfield Retrofit): Integrate IIoT sensors and connectivity into existing factory equipment. This preserves existing assets and allows phased rollout, but legacy PLCs, undocumented register maps, closed vendor systems, cabinet space, and shutdown windows often dominate the real schedule. Option B (Greenfield Deployment): Build a purpose-designed smart line or facility with native IIoT capabilities. This can simplify integration and improve timing control, but it requires larger capital approval, commissioning risk, migration planning, and a clear reason to replace still-useful equipment. Decision Factors: Choose brownfield when equipment is less than 10 years old with documented protocols, capital budget is constrained, or production cannot tolerate extended downtime. Choose greenfield when equipment replacement is already planned within 5 years, competitive pressure demands step-change improvements, or existing facility cannot meet quality/throughput requirements regardless of digitization.
Option A (OT-First): Start integration from the plant floor up, beginning with PLC/SCADA connectivity before enterprise integration. This protects operational stability and lets OT engineers define safe read-only paths, but business-facing dashboards and analytics arrive later. Option B (IT-First): Start from enterprise systems such as ERP, MES, and analytics platforms, then extend downward to plant-floor data. This can show business value quickly, but it risks production disruption if the design ignores OT timing, segmentation, and change-control constraints. Decision Factors: Choose OT-first when production uptime is the primary KPI (24/7 continuous process industries), OT systems use legacy protocols requiring specialized translation, or cybersecurity requirements mandate strict network separation. Choose IT-first when business intelligence and analytics are the immediate priority, factory already has modern PLCs with Ethernet connectivity, or organization has stronger IT than OT capabilities.
Misconception: Organizations assume their IT security team and existing cybersecurity tools (firewalls, antivirus, patch management) can directly protect OT/IIoT systems.
Reality: OT and IT have fundamentally different priorities and constraints:
- Priority: IT security puts confidentiality first; OT security puts availability first because production uptime is the primary concern.
- Patching: IT systems are patched immediately; OT systems are patched only during planned shutdowns, often quarterly or annually.
- Scanning: Active vulnerability scanning is normal in IT; the same scans can crash PLCs and halt production in OT environments.
- Protocols: IT relies on TCP/IP, HTTP, and TLS; OT commonly depends on Modbus, PROFINET, and EtherNet/IP, including legacy protocols with weak built-in security.
- Lifecycle: IT refresh cycles are typically 3-5 years; OT equipment often remains in service for 15-30 years.
- Failure impact: IT failures usually mean data breach or financial loss; OT failures can create physical safety risks and environmental damage.
Why it matters: In 2017, the TRITON/TRISIS malware targeted Safety Instrumented Systems (SIS) in a petrochemical plant — systems designed to prevent explosions. Applying IT-centric security assumptions to OT environments can leave the most critical safety systems unprotected while simultaneously disrupting production through aggressive scanning or patching.
The fix: Build a dedicated OT security program with IEC 62443 as the framework, not ISO 27001 alone. Staff with engineers who understand both cybersecurity and industrial control systems. Implement network segmentation using the Purdue Model (ISA-95 levels) with demilitarized zones between IT and OT networks. Never scan or patch OT systems without OT engineering approval.
Illustrative scenario: An automotive parts manufacturer operates 12 CNC machines that cost $50,000/hour in lost production when down unexpectedly. Historical data shows each machine fails once per year on average, with repairs taking 8 hours. They are evaluating a predictive maintenance system.
Current State (Reactive Maintenance):
- 12 machines × 1 failure/year × 8 hours downtime = 96 hours/year total
- Cost: 96 hours × $50,000/hour = $4,800,000/year in unplanned downtime
- Plus: Emergency parts expediting (
$25,000/year), overtime technician labor ($40,000/year) - Total annual cost: $4,865,000
Proposed IIoT Solution Investment:
- Vibration sensors (3 per machine): 36 × $200 = $7,200
- Temperature sensors (2 per machine): 24 × $50 = $1,200
- Edge gateway with ML inference: $15,000
- Cloud platform subscription: $2,000/month = $24,000/year
- Integration and setup: $80,000 (Year 1 only)
- Year 1 total: $127,400
- Ongoing annual: $47,400
Illustrative Expected Outcomes (Assumptions):
- Predictive maintenance catches 70% of failures before unplanned downtime occurs
- Prevented failures: 12 × 0.70 = 8.4 failures/year
- Remaining unplanned downtime: 12 - 8.4 = 3.6 failures × 8 hours = 28.8 hours/year
- Planned maintenance windows: 8.4 repairs × 4 hours (scheduled, not emergency) = 33.6 hours (during off-shift)
- Reduced unplanned downtime cost: 28.8 hours × $50,000 = $1,440,000/year
- Savings: $4,800,000 - $1,440,000 = $3,360,000/year
ROI Calculation:
- Net Year 1 benefit: $3,360,000 - $127,400 = $3,232,600
- Payback period: 127,400 / 3,360,000 × 12 months = 0.45 months (~14 days)
- 5-year NPV (10% discount rate): $3.36M/year savings - $47.4K/year ongoing = $12.6M net benefit
Key insight: In the scenario, a single prevented failure pays for the sensor investment. The lesson is not that every IIoT project pays back in weeks; it is that the strongest business cases start with expensive, frequent, observable failure modes.
When implementing Industry 4.0, choosing between retrofitting existing equipment (brownfield) versus building new smart facilities (greenfield) is a strategic decision with multi-year implications.
- Initial capital: Brownfield pilots tend to start smaller because they reuse existing machines; greenfield lines require a larger capital case because the project includes new equipment, commissioning, and migration.
- Integration timeline: Brownfield projects often spend schedule on legacy protocols, documentation gaps, and shutdown windows; greenfield deployments spend schedule on construction, vendor coordination, and commissioning.
- Maximum OEE improvement: Brownfield upgrades are usually bounded by existing mechanical constraints; greenfield lines can redesign flow, instrumentation, and control from the start.
- Protocol compatibility: Brownfield projects usually need gateways for Modbus RTU, PROFIBUS, and proprietary serial links; greenfield deployments can standardize on OPC-UA, MQTT, and vendor-supported integration from day one.
- Timing capability: Brownfield retrofits inherit existing PLC cycle times, networks, and safety approvals; greenfield cells can specify timing and synchronization requirements upfront.
- Equipment remaining life: Brownfield makes more sense when current equipment has meaningful useful life left; greenfield planning assumes a fresh asset lifecycle.
- Business disruption: Brownfield rollouts can be phased during scheduled downtime; greenfield transitions are much more disruptive because production moves to a new line or facility.
- Sunk cost recovery: Brownfield preserves the value of existing equipment; greenfield may require writing off old assets and funding a new asset base.
Decision Rules:
-
Choose Brownfield when:
- Equipment is <10 years old with documented communication protocols
- Capital budget is constrained (<$1M available)
- Production cannot tolerate extended downtime (>2 weeks)
- Existing equipment meets quality/throughput targets with minor improvements
- Goal is incremental improvement (10-20% OEE gains acceptable)
-
Choose Greenfield when:
- Equipment replacement is already planned within 5 years (accelerate timeline)
- Competitive pressure demands step-change improvements (not incremental)
- Existing facility cannot meet demand regardless of digitization
- Industry 4.0 capabilities are a core competitive differentiator
- Access to low-cost capital or government incentives available
Hybrid Strategy: Many manufacturers adopt a “brownfield first, greenfield later” approach. Prove ROI with pilot brownfield retrofits (6-12 months), then use demonstrated savings to justify greenfield expansion. This reduces risk while building internal expertise.
Pattern example: A supplier might begin with a brownfield retrofit on a small group of presses, prove that the data improves maintenance and quality decisions, then use that evidence to justify a later greenfield line. The sequencing reduces risk because the team learns the process, data, and organizational constraints before funding the larger asset.
Calculate the revenue impact of improving Overall Equipment Effectiveness through IIoT.
The Mistake: IoT engineers from IT backgrounds often assume industrial systems use standard TCP/IP networking and can be integrated like web services. They design IIoT architectures using RESTful APIs, HTTPS, and cloud-first approaches without understanding OT (Operational Technology) requirements.
Why This Fails:
Industrial equipment uses entirely different protocols than IT systems:
- HTTP/REST over Ethernet vs. Modbus RTU over RS-485: OT systems may not expose IP addresses at all, so the usual TCP handshake and REST model simply does not exist.
- JSON payloads vs. raw register reads: IT systems exchange self-describing payloads; OT systems often return fixed 16-bit registers that require protocol-specific mapping.
- TLS as a default vs. little or no built-in encryption: OT security is frequently enforced through segmentation and controlled gateways rather than end-to-end encryption on every device.
- 50-500 ms acceptable latency vs. <10 ms control loops: Cloud roundtrips that feel fine in IT can break deterministic machine control.
- Request/response vs. cyclic polling: PLCs expect data at fixed intervals such as every 10 ms, not only when an application chooses to request it.
Failure pattern: A team designs an IIoT gateway around HTTP polling and JSON payloads, then discovers that the real equipment exposes Modbus registers, PROFIBUS segments, vendor-specific fieldbus behavior, or undocumented serial links. The gateway work stalls while the team adds protocol converters, maps registers, validates units, and negotiates safe read-only access with OT engineering.
Typical consequences:
- Schedule slip: Integration moves from application work into protocol discovery, cabinet access, and test-window coordination.
- Budget pressure: Protocol gateways, OT consultants, spare parts, and plant access become unplanned cost items.
- Technical debt: Each converter and custom register map becomes another device to monitor, patch, document, and recover after a failure.
How to Avoid This:
-
Conduct OT inventory BEFORE design: Document every PLC model, firmware version, and communication protocol in the facility. Tools: Nmap scan for networked devices, physical inspection for serial protocols.
-
Bring OT expertise in early: Have industrial automation engineers review existing systems and specify integration requirements before software architecture is locked.
-
Use OT-native gateways: Platforms such as Kepware, Ignition, and AWS IoT Greengrass include industrial protocol drivers and operational deployment patterns. Do not build your own protocol stack unless you have a strong reason and the plant can support it.
-
Accept hybrid architecture: OT and IT networks must remain segregated. Use DMZ gateways with one-way data flow (OT→IT). Never expose PLCs directly to the internet or cloud.
-
Prototype with real equipment: A bench PLC, drive, or gateway with representative firmware and protocol settings reveals integration challenges faster than any architecture diagram.
Key Lesson: IIoT is fundamentally different from consumer IoT. Industrial systems prioritize determinism (data arrives exactly when expected) over throughput, uptime over features, and proven reliability over cutting-edge technology. Respect the 30-year lifespan and safety-critical nature of OT equipment.
Checkpoint: Business Case and Risk
You now know:
- Predictive maintenance ROI depends on observable failure modes, not a generic dashboard: the example uses 12 CNC machines, 8 hours per failure, and a 70% capture assumption.
- Brownfield and greenfield choices trade initial capital, integration timeline, timing capability, remaining equipment life, and business disruption.
- OT security differs from IT because availability, planned patch windows, protocol age, 15-30 year lifecycles, and physical safety change the risk model.
At this point the main argument is complete. The last checks ask you to apply timing placement, concept matching, implementation order, diagram labels, and a small signal-gate code pattern.
- Cyber-Physical Systems: Tight coupling of computation and physical processes. Cross-module link: Real-Time Systems.
- Digital Twins: Virtual replicas enable simulation before physical testing. Cross-module link: Simulation and Modeling.
- ISA-95 Hierarchy: Timing constraints dictate protocol choice. Cross-module link: Industrial Protocols.
- Edge Analytics: Sub-millisecond decisions require local processing. Cross-module link: Edge Computing.
- OT/IT Convergence: Factory data flows to business systems securely. Cross-module link: Security Architecture.
Industry 4.0 success depends on respecting timing boundaries - a machine control loop (1 ms) cannot wait for cloud analytics (200 ms+). Match processing location to latency requirement.
Common Pitfalls
Reading a PLC tag for visibility is not the same as writing a command back to the machine. Monitoring can often be added through read-only paths, but control changes need safety review, rollback plans, operator training, and acceptance testing.
IIoT work happens around production. A design that assumes frequent reboots, firmware changes, cabinet access, or active scanning will fail in plants where maintenance windows are short and tightly controlled.
A dashboard is not an outcome. Every IIoT signal needs an owner, a threshold or model explanation, a work-order or escalation path, and a rule for false positives, missing data, duplicated alerts, and stale readings.
23.7 Summary
Industry 4.0 represents the digital transformation of manufacturing through cyber-physical systems, IoT connectivity, and artificial intelligence:
Historical context: Four industrial revolutions have each increased productivity by 10-50x through mechanization, electrification, automation, and now digitalization.
Core technologies: Digital twins, smart manufacturing, cyber-physical systems, and horizontal/vertical integration converge to create adaptive, self-optimizing factories.
ISA-95 levels: Industrial systems span physical processes (Level 0), sensors and actuators (Level 1), monitoring and control including PLCs (Level 2), manufacturing operations (Level 3), and business planning (Level 4). ISA-95 levels classify activities rather than fixed response times.
Integration strategies: Both vertical (field-to-enterprise) and horizontal (supply chain) integration are required, with careful consideration of brownfield vs greenfield deployment approaches.
23.8 See Also
Explore related IIoT topics across modules:
- Industrial Communication Protocols - EtherCAT, PROFINET, Modbus, OPC-UA
- Real-Time Requirements - Hard vs soft real-time in manufacturing
- Predictive Maintenance - Vibration analysis and ML for failure prediction
- Edge and Fog Computing - Processing architectures for millisecond latency
- Security for Industrial IoT - OT network protection and Purdue model
23.9 What’s Next
| Next Chapter | Description |
|---|---|
| Industrial Protocols | Modbus, PROFINET, EtherCAT, and protocol selection for manufacturing |
| OPC-UA Standard | The unifying standard for industrial interoperability |
| Real-Time Requirements and ISA-95 | Timing constraints and automation hierarchy in detail |
| Predictive Maintenance | Using IoT sensors and ML for condition monitoring |
| Edge and Fog Computing | Edge computing architectures for industrial systems |
23.10 Continue Your Route
This final part closes the route from Industry 4.0 Technologies through What’s Next. Return to Industry 4.0: Industrial Revolutions and Adoption or continue from the applications module index.