11 IoT Go-to-Market: Launch Gates and Channels
11.1 Start With the Story
The product team has a price and a plausible LTV:CAC ratio, but that does not say who should sell, install, support, and expand the system. The next decision is how to phase the launch and choose channels without hiding deployment risk inside the sales forecast.
11.2 Overview
This route applies GTM frameworks, proof-of-concept gates, channel strategy, blended CAC, and visual decision checks to a launch plan.
This is part 2 of 2. Review IoT Go-to-Market: Pricing and Unit Economics when you need the first route.
11.3 Learning Objectives
By the end of this chapter, you will be able to:
- choose a go-to-market framework for an IoT offer
- design proof-of-concept and phased-launch gates
- compare channels and calculate blended acquisition cost
11.4 Chapter Roadmap
Follow the original sections below in order. They begin at the reviewed split boundary and keep every worked example, figure, check, and supporting banner with the section that owns it.
11.5 GTM Strategy Frameworks
11.5.1 Pricing Model Decision Tree
Selecting the right pricing model for a B2B IoT product depends on the customer’s risk tolerance, the vendor’s cash position, and the ability to measure outcomes. The following decision tree guides that selection.
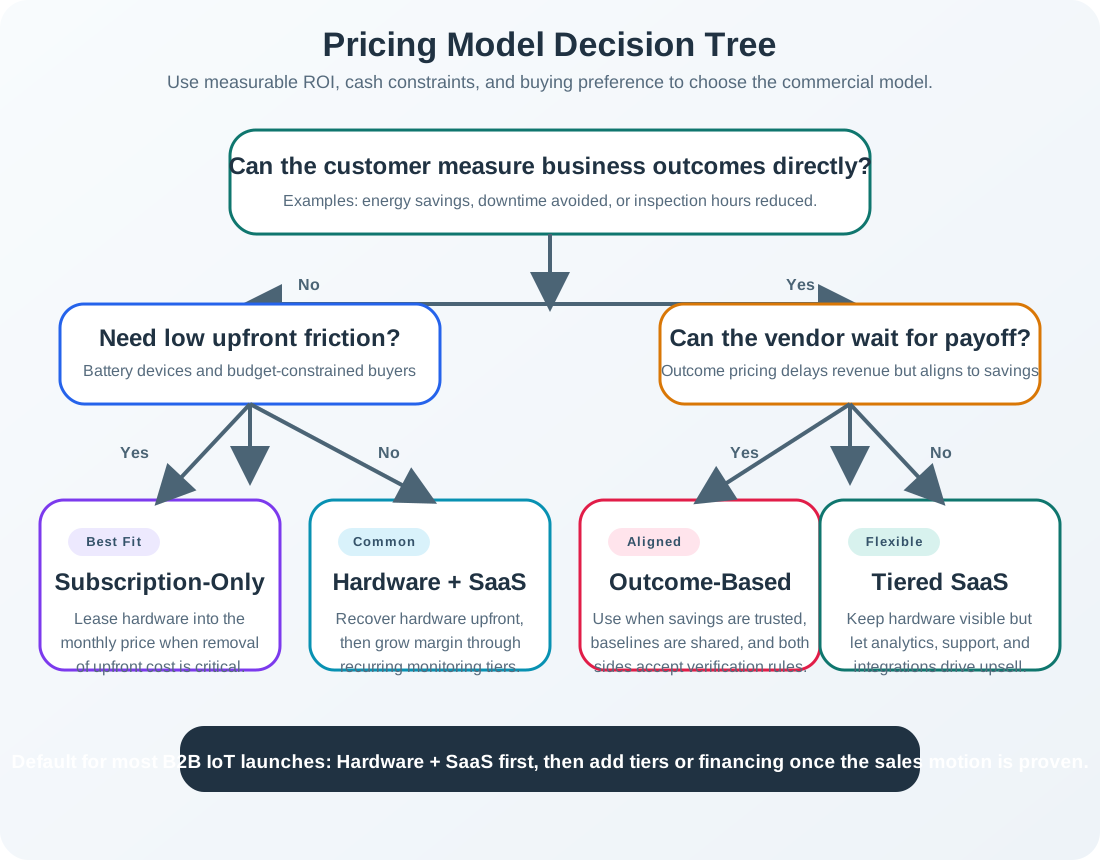
Most B2B IoT companies land on the “Hardware + SaaS” model (center-right path) because it balances adoption friction against recurring revenue while avoiding the measurement complexity of outcome-based pricing. The decision tree above helps product leaders evaluate alternatives based on their specific market conditions.
11.5.2 Channel Evolution Model
As IoT companies mature, their channel mix shifts from high-touch direct sales toward scalable partner-led and self-serve models. The following diagram illustrates this evolution.
Figure 11.2 shows what a team gives up, and what it gains, each time it hands selling to someone else.
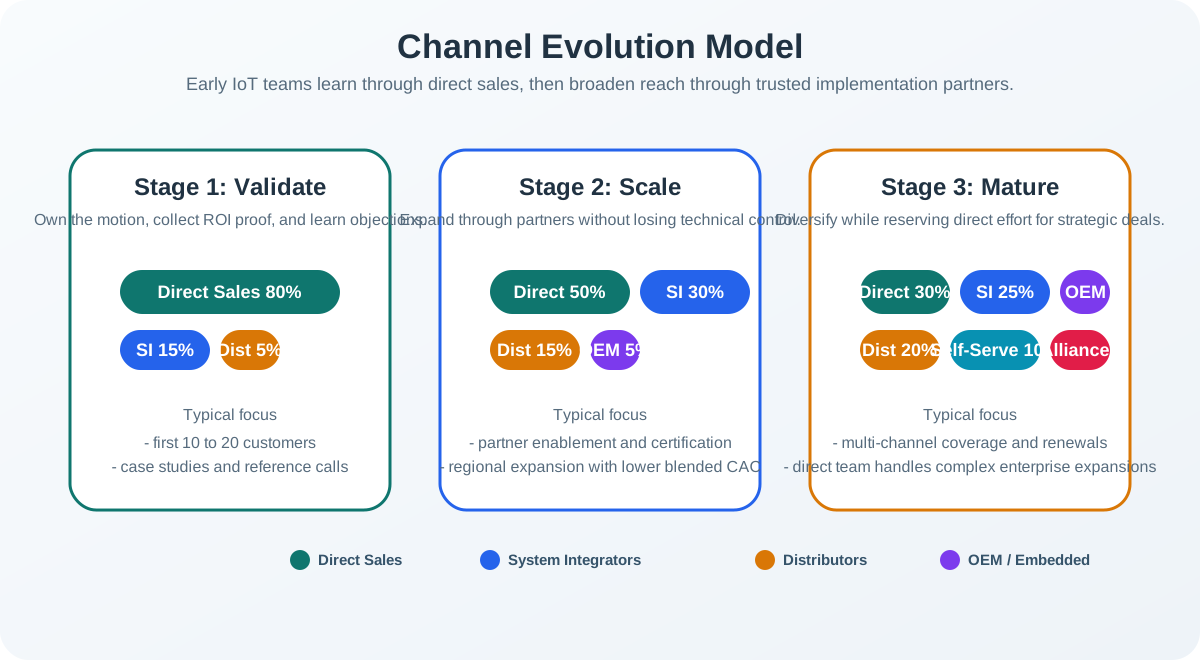
The three columns of Figure 11.2 are stages, not fixed years, and the direct-sales share falls across them from 80 percent to 30 percent. Read the focus note under each column to see why. In validation the team keeps the selling motion because it is still learning the objections and gathering proof. In the scaling stage integrators take about a third of the mix, and the stated prize is a lower blended cost of acquisition. By maturity, five routes share the load and direct effort is reserved for strategic deals. The share that never vanishes is the point: direct selling becomes the part only the vendor can do.
In Year 1 (navy), direct sales dominates because you need to learn the sales motion firsthand. By Year 2-3 (teal), partner channels scale reach while direct sales handles complex enterprise deals. At maturity (orange), revenue is diversified across five channels with self-serve emerging for smaller accounts.
11.5.3 Phased Launch Decision Framework
The decision to advance from one launch phase to the next should be governed by objective metrics, not calendar time. The following diagram shows the gate criteria between phases.
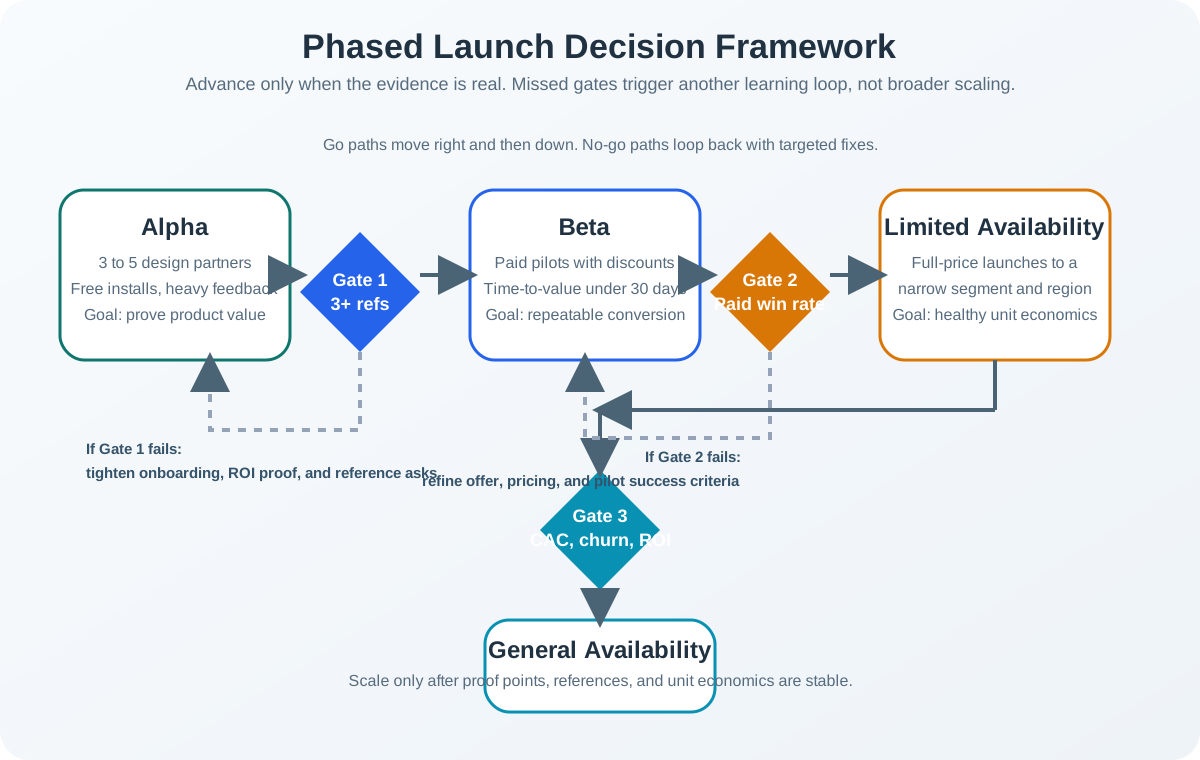
Each gate (diamond) represents a go/no-go decision. Failing a gate is not failure — it is a signal to iterate. The gray boxes show the corrective actions to take before re-attempting the gate. Companies that skip gates (launching broadly without validated proof points) frequently burn cash on scaling an unproven sales motion.
11.5.4 B2B IoT Sales Cycle Anatomy
Understanding the typical B2B IoT sales cycle helps teams plan resource allocation and forecast accurately.
Figure 11.4 names who owns each stretch of a six-month sale, which is what makes the timeline plannable.
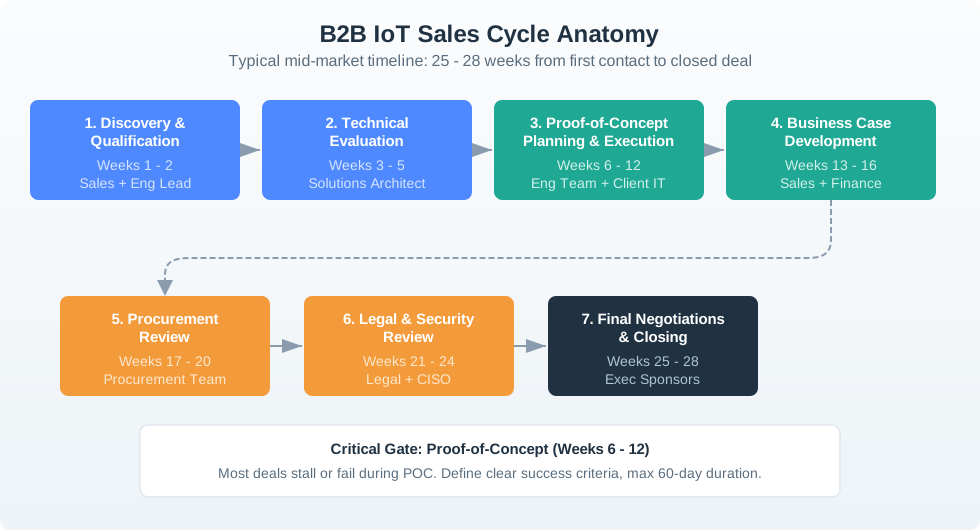
Track the owner row along Figure 11.4 rather than the stage names. The first five weeks belong to sales and engineering, so early demand looks like engineering time. Weeks 6 to 12 are the proof of concept, the longest single block and the one shared with the customer’s own IT team. From week 13 the deal leaves the product people and passes to finance, then procurement, then legal and security, before executives close it. Two things follow. Engineering load peaks long before revenue arrives, and half the calendar sits in reviews the vendor cannot speed up. The highlighted gate marks the proof of concept as the place deals stall.
A typical mid-market B2B IoT sale takes 13-28 weeks from first contact to closed deal. The proof-of-concept (POC) phase is where most deals stall or fail — ensuring a streamlined POC process with clear success criteria is critical to sales velocity.
11.6 Common Pitfall: Skipping the POC Gate
Many IoT startups offer unlimited free POCs without defined success criteria or timelines. This creates “POC purgatory” — prospects evaluate indefinitely without committing. Always define:
- Duration: Maximum 60 days
- Success criteria: 3 specific, measurable outcomes (e.g., “detect 2+ anomalies,” “reduce inspection time by 30%”)
- Decision timeline: Commitment to purchase decision within 2 weeks of POC completion
- Skin in the game: Charge a nominal POC fee ($500-2,000) refundable upon purchase
11.7 IoT GTM Pitfalls
1. Scaling sales before product-market fit is proven. Hiring a VP Sales and 5 account executives before securing 3+ paying reference customers burns $1M+ with no validated sales playbook. The phased launch model exists specifically to prevent this: prove unit economics with small numbers before amplifying spend.
2. Pricing based on costs instead of customer value. If your sensor costs $118 to build and you price it at $200 (70% markup), you leave enormous value on the table when the sensor saves customers $50,000 per prevented downtime event. Value-based pricing captures 10-30% of the customer’s measurable benefit, not a markup on your BOM.
3. Offering free POCs without exit criteria. Unlimited free pilots create “POC purgatory” where prospects evaluate indefinitely. Always set a maximum duration (60 days), define 3 measurable success criteria, and charge a nominal fee ($500-2,000) that is refundable upon purchase to ensure the customer has skin in the game.
4. Choosing channels based on lowest CAC without considering deal complexity. Self-serve channels at $2,000 CAC look attractive on a spreadsheet, but B2B IoT products requiring physical installation, integration, and ongoing support cannot be sold through a shopping cart. Match channel complexity to product complexity.
5. Ignoring Net Revenue Retention. Growing new logos while existing customers churn or contract is an expensive treadmill. NRR above 110% means existing customers expand faster than they leave, compounding growth. Below 100% means you must acquire new customers just to maintain revenue.
These pitfalls are the negative version of the launch gates: each one describes what happens when a team scales before references, economics, POC rules, channel fit, or retention are proven.
11.8 Knowledge Check: Go-to-Market Strategy
11.9 Blended CAC Across Channels
11.10 Channel Mix and Blended CAC
Model your go-to-market channel strategy by adjusting the percentage of customers acquired through each channel and their respective acquisition costs.
Scenario: An IoT fleet tracking company currently uses 100% direct sales with a $25,000 CAC. They’re considering adding system integrators (SIs) who can acquire customers at $10,000 CAC but take 25% of first-year revenue as margin. Should they add the SI channel?
Given:
- Direct sales CAC: $25,000
- System integrator CAC: $10,000 (SI handles sales, gets 25% commission)
- Average customer: $50,000 first-year revenue, $36,000 recurring each year after
- Current: 50 customers/year via direct sales
- Proposed: 30 direct + 30 via SIs (total 60 customers)
Step 1: Calculate true SI channel cost
- SI acquires customer at nominal $10,000 CAC
- But SI takes 25% of first-year revenue: 0.25 × $50,000 = $12,500 margin share
- Effective SI CAC = $10,000 + $12,500 = $22,500 (you still “pay” via margin share)
Step 2: Calculate blended CAC
- 30 customers via direct: 30 × $25,000 = $750,000
- 30 customers via SI: 30 × $22,500 = $675,000
- Total 60 customers acquired for $1,425,000
- Blended CAC = $1,425,000 / 60 = $23,750
Step 3: Compare scenarios
| Metric | Direct Only (50) | Direct + SI (30+30) | Delta |
|---|---|---|---|
| Total customers | 50 | 60 | +20% |
| Total CAC spend | $1,250,000 | $1,425,000 | +14% |
| Blended CAC | $25,000 | $23,750 | -5% |
| Year 1 revenue | $2,500,000 | $3,000,000 | +20% |
| Net revenue (after SI margin) | $2,500,000 | $2,625,000 | +5% |
Step 4: Long-term value analysis
- SI takes 25% margin in Year 1 ONLY, not recurring years
- Direct customer 3-year LTV: $50K + $36K + $36K = $122K
- SI customer 3-year LTV: $37.5K (net Year 1) + $36K + $36K = $109.5K
- SI customers have 10% lower LTV due to first-year margin share
Step 5: Decision framework
| Factor | Value | Interpretation |
|---|---|---|
| SI effective CAC | $22,500 | 10% cheaper than direct ($25K) |
| Blended CAC improvement | 5% | Modest improvement |
| SI customer LTV reduction | 10% | Partially offsets CAC savings |
| LTV:CAC ratio (direct) | $122K / $25K = 4.88:1 | Healthy |
| LTV:CAC ratio (SI) | $109.5K / $22.5K = 4.87:1 | Nearly identical |
| Volume increase | +20% | Main benefit |
Result: Add the SI channel. While effective CAC is higher than it first appears ($22,500 vs nominal $10,000) and LTV decreases slightly, the volume increase (+20% customers) is the key benefit. Blended CAC improves modestly (5%), but the real win is scaling beyond what the direct team can reach.
Key Insight: When evaluating partner channels, account for margin share as part of CAC. A “$10K CAC” channel that takes 25% margin is really a “$22.5K CAC” channel. The value is in incremental volume, not cost reduction.
 Checkpoint: Channel Math
You now know:
- Lower nominal CAC is not enough; partner margin share belongs in the true channel cost.
- In the SI scenario, the effective SI CAC is $22,500, blended CAC improves only 5%, and SI customer LTV is 10% lower.
- The reason to add the SI channel is the +20% customer volume, not a dramatic CAC reduction.
11.11 Visual Reference Gallery
11.12 Visual: IoT Business Model Canvas
Figure 11.5 shows how the familiar nine blocks change when the product keeps running after the sale.
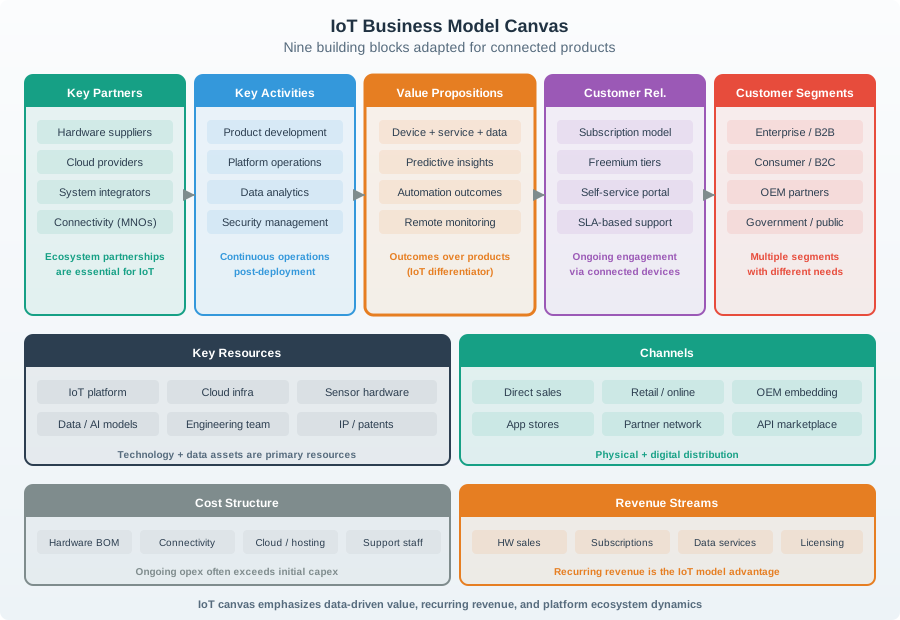
Figure 11.5 groups its nine blocks into three bands and then tests them. The left band asks who benefits and how you reach them. The centre band holds the value proposition, and its inner panel carries the connected-product change: hardware alone is not the offer, because device, remote service, and data insight are sold together. The right band names what it takes to deliver that, from suppliers and integrators to the platform and the analytics skills. The strip along the bottom is the reality check. It puts cost structure directly opposite revenue streams, with this chapter’s numbers on both sides, so the canvas ends on whether recurring income covers the running costs.
The IoT business model canvas adapts traditional business modeling to address unique aspects of connected products including recurring revenue streams, data monetization opportunities, and platform ecosystem dynamics.
11.13 Visual: Revenue Streams and LTV Analysis
Inspect Figure 11.6 to identify which part of the offer each revenue path actually funds.
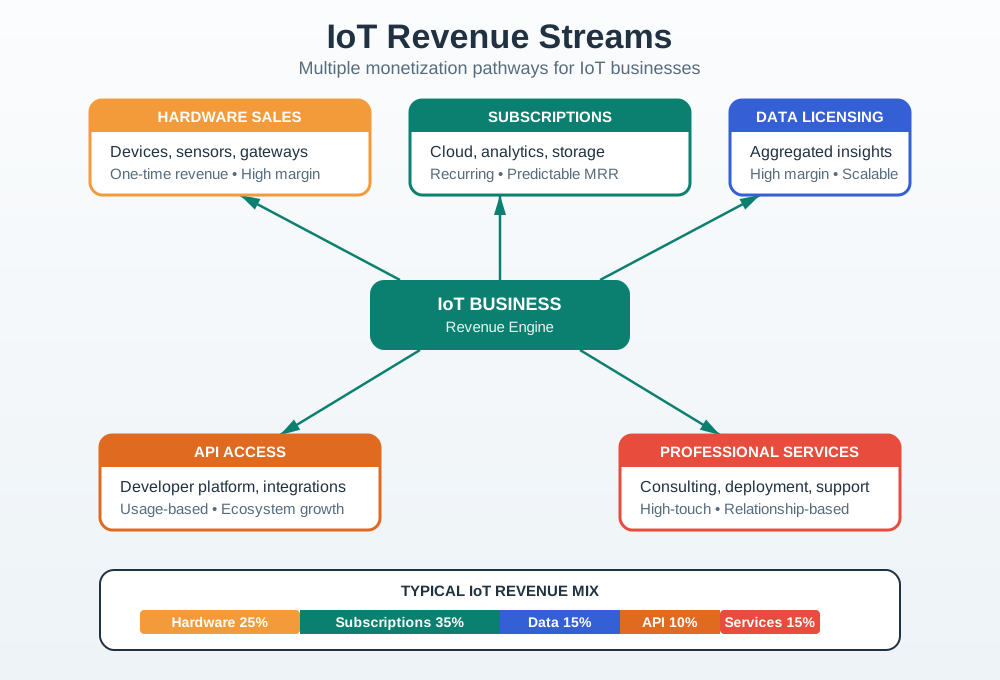
Trace each income path to its source. Test its cost. Read Figure 11.6 from the central business to each funded offer. Hardware sales pay for deployed products and are transaction-led. Subscriptions fund continuing cloud capability, making service quality and retention part of the promise. Data licensing sells information only when the business has a defensible right and useful product; API access funds integration, while professional services pay for high-touch delivery. A company may combine paths, but diversification is not automatic risk reduction: each path adds a different customer, cost base, obligation, and sales motion that the launch plan must support.
Diversified revenue streams transform IoT economics from one-time sales to recurring relationships, dramatically increasing customer lifetime value and creating predictable revenue streams.
11.14 Visual: Hardware Revenue Strategies
Figure 11.7 lines up three hardware prices against the argument each one has to win.
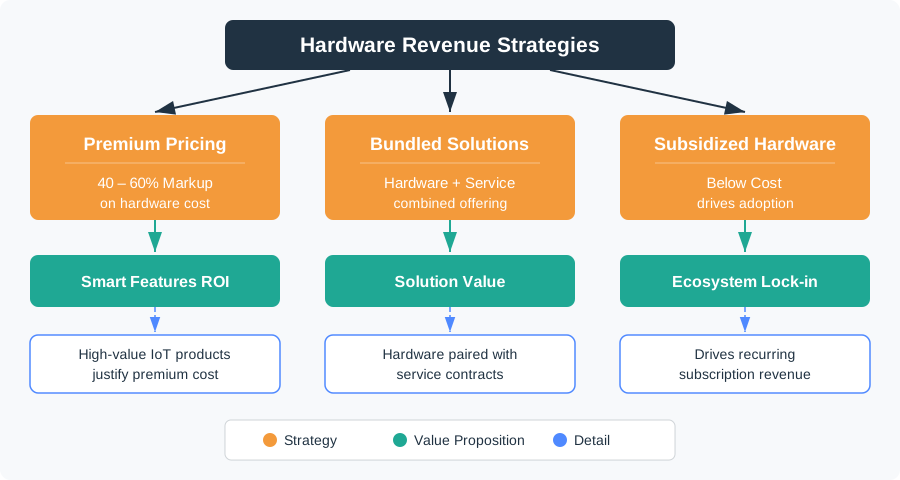
Read Figure 11.7 as three rows sharing one question: what has to be true for this price to hold. The premium row carries a markup of 40 to 60 percent, and it holds only while buyers accept that the smart features return more than the extra cost. The bundled row sells hardware with a service contract, so the value claim moves from the device to the outcome the contract promises. The subsidised row prices below cost and recovers the gap through recurring subscriptions, which makes retention the whole business. Moving down the rows moves risk from the buyer to the vendor, and each step needs different proof.
Hardware revenue strategies range from premium pricing for differentiated products to subsidized models that drive platform adoption. Successful IoT businesses often combine multiple strategies across product lines.
11.15 GTM Concept Relationships
| Concept | Relates To | Relationship |
|---|---|---|
| Phased Launch | Risk Management | Alpha (free design partners) → Beta (paid pilots) → Limited (full price) → General Availability with gate criteria prevents scaling before validation |
| LTV:CAC Ratio | Sales Efficiency | Must exceed 3:1 before scaling sales investment; mid-market customers balance shorter cycles with sufficient contract value |
| Channel Mix | Market Reach | Direct sales (80% Year 1) for learning → System integrators (50/30 Year 2-3) for scalable distribution |
| Hybrid Pricing | Adoption Friction | Combines upfront hardware costs with recurring subscriptions; lease options reduce barriers while maintaining revenue targets |
Cross-module connection: Pricing Strategies explains how to structure tiered subscription pricing and calculate lease-vs-buy economics to optimize customer acquisition while maintaining healthy LTV:CAC ratios.
11.16 Quiz: GTM Concepts
11.17 Quiz: B2B IoT GTM Launch
11.18 Label the Diagram
11.19 Code Challenge
11.20 Summary
This chapter provided a comprehensive go-to-market framework for B2B IoT products:
- Customer Segmentation: Prioritize segments based on pain points, sales complexity, and market size — mid-size customers often represent the best initial target due to shorter sales cycles and fewer incumbent relationships
- Pricing Models: Balance upfront hardware costs with recurring subscription revenue through hybrid approaches; lease options reduce adoption friction while maintaining revenue targets
- Channel Strategy: Start with direct sales for learning and control (80% in Year 1), then diversify to system integrators and distributors (50/30/15 by Year 2-3) for scalable reach
- Support Structure: Match support levels to customer value and contract tiers; professional services generate high-margin revenue while accelerating customer onboarding
- Competitive Positioning: Articulate clear, measurable differentiation (deployment speed, connectivity advantages, all-in pricing) supported by customer proof points
- Phased Launch: Manage risk through alpha (free design partners), beta (paid pilots), limited availability (full price), and general availability — with objective gate criteria at each transition
11.21 Key Takeaway
In one sentence: A successful B2B IoT go-to-market strategy validates product-market fit through phased launches with gate criteria before scaling sales investment.
Remember this rule: Never scale sales spend until you have 3+ paying customers with documented ROI and willingness to serve as public references. The LTV:CAC ratio must exceed 3:1 for sustainable unit economics, and phased launches (alpha, beta, limited, general availability) with objective gate criteria at each transition protect against the most common startup failure mode: scaling before proving.
11.22 See Also
- IoT Business Model Fundamentals — LTV:CAC ratio calculations, customer acquisition cost modeling, and recurring revenue metrics
- Pricing Strategies — Tiered subscription structures, freemium optimization, and lease-vs-buy economics
- Case Studies — Philips LaaS phased launch ($50M→$1.1B ARR), Amazon Echo channel strategy
- Sales Operations — CRM setup, sales enablement, and quota planning for B2B technology products
11.23 In 60 Seconds
This chapter covers go-to-market strategy, explaining the core concepts, practical design decisions, and common pitfalls that IoT practitioners need to build effective, reliable connected systems.
11.24 What’s Next
| Direction | Chapter | Description |
|---|---|---|
| Next | Monetizing Data | Practical pricing strategies and implementation |
| Next | IoT Use Case Case Studies: Barcelona / Volkswagen | Real revenue examples across industries — public-sector Barcelona and industrial Volkswagen |
| Related | Application Domains Overview | Deep dives into specific verticals |
| Index | IoT Business Model Fundamentals | Overview of all business model topics |