10 IoT Go-to-Market: Pricing and Unit Economics
More
Depth: Practitioner
Progress saves as you read. Mark sections complete as you go; your progress appears in the sidebar.
- Podcast audio coming soon
- Character narration audio coming soon
10.1 Make Customer Value Pay for the Service
A vibration sensor on a pump can keep sending useful readings while its subscription loses money. A maintenance team that needs frequent help creates a different cost from a customer who uses the same dashboard alone. Pricing must cover the value delivered and the full service burden.
A go-to-market (GTM) strategy connects product capabilities to customer value through segmentation, pricing, channels, and launch sequencing. B2B IoT sales coordinate hardware installation, software integration, and continuing service across several customer roles. This is part 2 of 2; IoT Go-to-Market: Deployment Strategy supplies the preceding evidence. The applications module index places this case study among other application choices.
Your startup has developed an industrial vibration sensor for predictive maintenance of rotating machinery: motors, pumps, and compressors. It uses microelectromechanical systems (MEMS) accelerometers, edge machine learning (ML) for anomaly detection, and LoRaWAN connectivity. The goal is a B2B pricing model, channel strategy, and support structure that grow recurring revenue while keeping customer acquisition costs sustainable.
The problem is that an attractive device price does not establish a viable service. We will compare device, subscription, usage, and outcome pricing, then calculate LTV, CAC, and payback. The six-step approach starts with the customer and follows the consequences through pricing, channels, support, positioning, and launch.
KEY CONCEPTS
- Business model
An IoT business model defines how the offer creates, delivers, and captures economic value.
- Recurring revenue
Subscription, data-service, or maintenance income continues after the initial device sale.
- Total cost of ownership
TCO includes acquiring, deploying, and operating the system over its full lifecycle.
- Value proposition
A specific customer benefit distinguishes the offer from alternatives.
- Platform business model
Third parties build applications on device data or connectivity infrastructure.
- Hardware as a service
HaaS replaces outright hardware purchase with a recurring fee to reduce upfront barriers.
- Churn rate
Churn is the percentage of subscribers who cancel within a stated period.
10.2 Learning Objectives
- Compare device, subscription, usage, and outcome pricing.
- Calculate LTV, CAC, and payback for an IoT offer.
10.3 Choose the Customer and the Difference
The unique value proposition (UVP), also called the unique selling proposition, states why this IoT product is worth choosing over alternatives. Portability, light weight, and convenience are example benefits, but differentiating the idea from competing products deserves time early in commercialization, not after the product is built.
Treat those words as claims that need a comparison. “Portable” needs a reference product or installation model; “lightweight” needs a competing form factor; “convenient” needs a user task that becomes easier. The six-step framework can then test whether the claimed difference matters to the chosen segment, survives pricing and support costs, and can be demonstrated during launch.
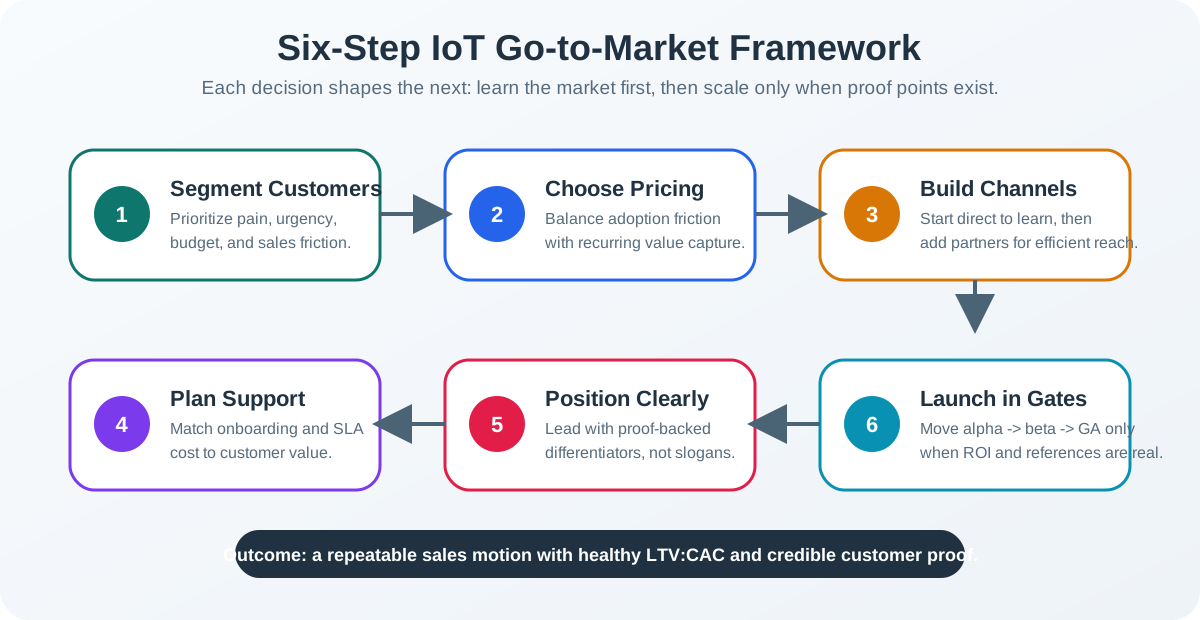
The six-step GTM framework follows customer segmentation, pricing strategy, channel selection, support planning, competitive positioning, and launch sequencing. Each step builds on the previous: customer segments inform pricing, pricing constrains channels, channels dictate support requirements, and competitive positioning shapes launch sequencing.
For the vibration sensor, identify and prioritize segments by pain points, willingness to pay, and sales complexity. B2B markets differ enough that each segment needs its own value proposition and sales approach. The comparison below makes those differences explicit.
Illustrative US segment sizes, costs and sales cycles for this exercise; validate against a dated market register and interviews before using them in a plan.
| Segment | Size (US) | Pain Point | Decision Maker | Sales Cycle | Priority |
|---|---|---|---|---|---|
| Large Manufacturing | ~5,000 plants | Unplanned downtime costs $260K/hour | VP Operations, Reliability Engineer | 6-12 months | Medium (long sales cycle) |
| Mid-size Manufacturing | ~25,000 plants | Can’t afford dedicated reliability team | Plant Manager, Maintenance Lead | 3-6 months | High (sweet spot) |
| Water/Wastewater Utilities | ~16,000 systems | Aging infrastructure, limited budgets | Operations Director, City Engineer | 4-8 months | High (regulatory pressure) |
| HVAC Service Providers | ~100,000 firms | Differentiate from competitors | Owner, Service Manager | 1-3 months | Medium (fragmented) |
| Oil & Gas | ~2,000 facilities | Safety-critical, existing solutions | Reliability Manager, HSE Director | 12-24 months | Low (entrenched vendors) |
Primary target selection: Mid-size manufacturing (500-2,500 employees)
Rationale:
- Large enough to have significant downtime costs ($50K-200K per incident)
- Small enough to lack dedicated predictive maintenance programs
- Decision authority often in single plant manager (faster sales)
- Less likely to have existing vendor relationships to displace
10.4 Price the Device and the Continuing Service
With mid-size manufacturing selected, structure pricing to balance upfront investment barriers against long-term revenue goals. A low purchase price may ease adoption, but the continuing fee must cover cloud infrastructure, connectivity, support, and model updates. Start with our costs before comparing the offers.
Cost structure analysis (our costs): the bill of materials (BOM), manufacturing and testing, and allocated gateway cost form hardware cost of goods sold (COGS).
| Cost Component | Per Sensor | Ongoing Monthly |
|---|---|---|
| Hardware BOM | $85 | - |
| Manufacturing & test | $25 | - |
| LoRaWAN gateway (1 per 50 sensors) | $8 (amortized) | - |
| Cloud infrastructure | - | $0.50/sensor |
| Cellular backhaul (gateway) | - | $0.30/sensor |
| Customer support (allocated) | - | $1.20/sensor |
| ML model updates | - | $0.40/sensor |
| Total | $118 | $2.40/sensor |
Pricing model options evaluated: software as a service (SaaS) is the continuing hosted service alongside the device. Usage pricing charges for consumption; the outcome-based option instead charges a share of measured savings. The subscription-only row assumes 6+ months of negative cash flow, but the listed costs alone do not establish that duration; financing and acquisition assumptions need to be specified.
| Model | Hardware | Monthly Fee | 3-Year Revenue | Pros | Cons |
|---|---|---|---|---|---|
| A: Hardware + Subscription | $299 | $29/sensor | $1,343 | Clear value separation | High upfront barrier |
| B: Subscription-only | $0 | $59/sensor | $2,124 | Low barrier, high LTV | Cash flow negative 6+ months |
| C: Hardware + Tiered SaaS | $199 | $19-49/sensor | $883-1,963 | Flexibility | Complexity, upsell friction |
| D: Outcome-based | $0 | 10% of savings | Variable | Aligned incentives | Requires baseline, disputes |
Selected model: Hybrid (Model A with financing)
| Component | Price | Notes |
|---|---|---|
| Sensor hardware | $299 (or $15/month lease) | Lease option reduces friction |
| Basic monitoring SaaS | $19/month/sensor | Dashboard, alerts, API |
| Advanced analytics tier | $39/month/sensor | ML predictions, work orders |
| Enterprise tier | $59/month/sensor | Multi-site, integrations, SLA |
| LoRaWAN gateway | Included with 10+ sensors | Removed as purchase barrier |
These models change three-year revenue, lifetime value, and cash flow in different ways. Hardware revenue brings cash forward; subscription-only pricing requires the supplier to finance devices; tiers support segmentation and upselling; outcome pricing needs an agreed baseline and outcome tracking. The selected offer combines hardware revenue with recurring SaaS tiers and a financing option.
For 100 sensors on the Advanced tier, the following model uses the $118 hardware cost and $2.40 monthly operating allowance above. Monthly recurring revenue (MRR) counts subscription revenue; annual recurring revenue (ARR) annualizes it. Neither includes the one-time hardware sale.
| Metric | Value | Calculation |
|---|---|---|
| Hardware revenue | $29,900 | 100 x $299 |
| Monthly recurring revenue (MRR) | $3,900 | 100 x $39 |
| Annual recurring revenue (ARR) | $46,800 | $3,900 x 12 |
| 3-year total revenue | $170,300 | $29,900 + ($46,800 x 3) |
| 3-year gross margin | 88.0% | ($170,300 revenue - $11,800 hardware COGS - $8,640 recurring costs) / $170,300 |
| Customer LTV | $149,860 | 3-year gross contribution before acquisition and other unlisted costs |
10.5 Test Acquisition Cost Against Customer Value
The recurring margin now gives us a reason to ask what it costs to win the customer. Customer acquisition cost (CAC) is acquisition spending divided by new customers. Sales and distribution channels affect that cost, sales velocity, and scalability. Compare their reach and costs for mid-size manufacturing before staffing the direct team.
Channel analysis for mid-size manufacturing:
| Channel | Reach | CAC | Pros | Cons |
|---|---|---|---|---|
| Direct sales team | High | $15K-25K | Control, relationships | Expensive, slow to scale |
| Industrial distributors | High | $8K-12K (margin share) | Existing relationships | Margin erosion, brand distance |
| System integrators | Medium | $5K-10K | Technical credibility | Requires training, certification |
| Online self-serve | Low | $1K-3K | Scalable, low cost | Complex B2B sales don’t fit |
| OEM partnerships | Very High | $2K-5K (per install) | Volume, sticky | Long development, margin pressure |
Selected channel mix:
| Channel | Year 1 Focus | Year 2-3 Evolution | Target % Revenue |
|---|---|---|---|
| Direct sales | 80% | 50% | Land enterprise deals, learn |
| System integrators | 15% | 30% | Scale through partners |
| Industrial distributors | 5% | 15% | Geographic expansion |
| OEM partnerships | 0% | 5% | Long-term embedded play |
Direct sales team structure (Year 1): on-target earnings (OTE) describe the listed compensation; account executives (AEs) win accounts and sales engineers support proof-of-concept (POC) work.
| Role | Count | Quota | OTE | Focus |
|---|---|---|---|---|
| VP Sales | 1 | Team | $250K | Strategy, enterprise deals |
| Account Executive | 3 | $500K ARR | $150K | New logo acquisition |
| Sales Engineer | 2 | Support AEs | $120K | Technical validation, POC |
| Customer Success | 2 | Retention, expansion | $100K | Onboarding, renewals, upsell |
CAC calculation for direct sales:
| Cost Component | Annual | Notes |
|---|---|---|
| Sales team OTE subtotal | $1,140,000 | Sum of listed OTE; benefits and other loading are additional |
| Marketing (lead gen) | $300,000 | Events, content, digital |
| Sales tools (CRM, etc.) | $50,000 | Salesforce, outreach tools |
| Travel & entertainment | $100,000 | Customer visits, demos |
| Total sales & marketing | at least $1,590,000 | |
| Target new customers (Year 1) | 50 | ~$100K average deal |
| CAC | at least $31,800 | High initially, improves with scale |
10.5.1 Put the Acquisition Spending to Work
The minimum CAC of $31,800 must be justified by customer lifetime value (LTV), modeled here as gross contribution over the paid relationship. This next example is a separate five-year industrial contract, rather than the 100-sensor, three-year offer above. With hybrid pricing ($50K hardware plus $12K/year SaaS), the five-year industrial customer LTV model is: LTV = \$50,000 + (\$12,000 x 5) - COGS.
Assuming 40% hardware margin and 80% SaaS margin:
- Hardware gross profit:
\$50,000 x 0.40 = \$20,000. - SaaS gross profit:
\$12,000 x 5 x 0.80 = \$48,000. - Total LTV:
\$20,000 + \$48,000 = \$68,000.
With CAC of at least $31,800, the LTV:CAC ratio is at most $68,000 / $31,800 ≈ 2.14:1 (about 2.1:1); actual payroll loading would reduce it further. This is below the 3:1 minimum threshold, indicating the business needs to either (a) reduce CAC through channel partners, (b) increase pricing, or (c) extend customer lifetime beyond 5 years to achieve sustainable unit economics.
Simple CAC payback divides acquisition cost by monthly contribution, the revenue left after the monthly cost to serve. For £100 revenue, £40 service cost, £300 CAC, and 20 paid months, contribution is £60/month: payback is £300 / £60 = 5 months, and contribution LTV:CAC is (£60 × 20) / £300 = 4:1. Use contribution rather than gross receipts in both calculations.
The 3:1 ratio is this exercise’s screening threshold; it does not by itself prove a business sustainable. Use the separate tool to vary hardware revenue, annual SaaS revenue, customer lifetime, margins, and acquisition cost. Its original CAC preset is $30,800; enter at least $31,800 to match the direct-sales calculation here.
10.6 Fund the Support You Promise
Acquisition is only the first cost of the relationship. Create support tiers that scale with customer value and complexity: B2B customers expect support proportional to their investment, and unmanaged service costs erode margins. A service-level agreement (SLA) states the promised response. The tiers below make that promise explicit; a customer success manager (CSM) owns the ongoing relationship.
Support tier structure:
| Tier | Included With | Response SLA | Channels | Scope |
|---|---|---|---|---|
| Standard | Basic SaaS | 24 hours | Email, knowledge base | Product issues, how-to |
| Priority | Advanced SaaS | 4 hours | Email, phone, chat | Technical troubleshooting |
| Enterprise | Enterprise SaaS | 1 hour | Dedicated CSM, phone | Full support, integrations |
| Professional Services | Add-on | Scheduled | On-site, remote | Installation, training, custom |
Support cost model (per 100 sensors): full-time equivalent (FTE) staffing is allocated across the fleet.
| Support Level | Monthly Cost | Staffing | Margin Impact |
|---|---|---|---|
| Standard | $120 ($1.20/sensor) | 0.1 FTE shared | Included in $19 SaaS |
| Priority | $350 ($3.50/sensor) | 0.25 FTE shared | Included in $39 SaaS |
| Enterprise | $800 ($8.00/sensor) | 0.5 FTE dedicated | Included in $59 SaaS |
Professional services offerings:
| Service | Price | Duration | Margin |
|---|---|---|---|
| Site survey & design | $2,500 | 1 day | 60% |
| Installation (per sensor) | $75 | 30 min | 40% |
| Integration (per system) | $5,000-15,000 | 1-3 weeks | 50% |
| Training (per session) | $1,500 | Half day | 70% |
| Annual maintenance review | $3,000 | Quarterly calls | 65% |
Customer success metrics: track net revenue retention (NRR), lost recurring revenue, time to value, net promoter score (NPS), and ticket volume alongside margin.
| Metric | Target | Measurement |
|---|---|---|
| Net Revenue Retention (NRR) | >110% | (Starting ARR + Expansion - Churn) / Starting ARR |
| Gross churn | <10% annual | Lost ARR / Starting ARR |
| Time to value | <30 days | First actionable alert after install |
| NPS | >50 | Quarterly survey |
| Support tickets per sensor | <0.5/month | Indicates product quality |
10.6.1 When Support Changes the Advanced Tier Margin
Use the chapter’s Advanced tier at £39 per sensor per month as an illustrative currency-denominated version of the model. Keep the stated cost magnitudes: cloud £0.50, backhaul £0.30, model updates £0.40 and basic support £1.20. Together they cost £2.40 per month, leaving £36.60 before hardware and other business expenses. For 100 sensors, recurring revenue is £3,900 and this contribution is £3,660 per month.
The support table introduces a second assumption: Priority support costs £3.50 per sensor. Replace the basic allowance; do not add both allowances for the same service. The revised monthly cost is 0.50 + 0.30 + 0.40 + 3.50 = 4.70 pounds per sensor. Contribution becomes £34.30 per sensor, or £3,430 across the fleet. The difference is £230 each month. A sales proposal that promises Priority service while using basic support costs overstates the margin.
Follow the existing six-step framework from customer segment to pricing, channel, support, positioning and launch. Here the support step sends a constraint back to pricing: the promised response needs staff. The channel also matters. An installer who handles first-line questions may lower supplier workload but charge a fee. That fee belongs in the acquisition or running-cost model according to when it is paid.
10.7 Prove the Positioning Before Selling It
With service costs visible, return to the promised difference. Industrial IoT competition makes clear positioning necessary to avoid commoditization. Treat the landscape below as hypotheses to verify in matched pilots, including the Fluke and Banner capability comparisons; the entries are not established product verdicts.
Competitive landscape:
| Competitor | Positioning | Strengths | Weaknesses | Our Advantage |
|---|---|---|---|---|
| SKF Enlight | Premium, full-service | Brand, expertise, services | To verify in matched pilots | To verify in matched pilots |
| Fluke 3563 | Portable + connected | Known brand, flexible | Not continuous, manual | 24/7 monitoring, automated alerts |
| Augury | AI-first, SaaS | To verify in matched pilots | To verify in matched pilots | To verify in matched pilots |
| Banner Wireless | Low-cost sensors | Price, industrial heritage | Basic analytics, no ML | Edge ML, predictive not reactive |
| AWS IoT + DIY | Platform, flexibility | Customizable, scalable | Requires expertise, no domain | Turnkey solution, 2-week deploy |
Positioning statement to test, including the exclusivity claim:
“For mid-size manufacturers who can’t afford dedicated reliability engineers, [ProductName] is the only vibration monitoring system that deploys in 2 weeks and predicts failures 30 days in advance without requiring Wi-Fi infrastructure or data science expertise.”
Key differentiators to emphasize:
| Differentiator | Proof Point | Sales Enablement |
|---|---|---|
| 2-week deployment | Target: install within 14 days | Record pilot install times; obtain matched competitor data before claiming a 90-day comparison |
| No Wi-Fi required | Test LoRaWAN coverage through metal and concrete | Live demo in metal shop |
| Edge ML | Target: process 95% of alerts on device | Validate with instrumented pilots before using as a privacy or security proof point |
| 30-day predictions | 3 customer case studies with verified savings | ROI calculator with customer data |
| All-in pricing | No hidden fees; reconcile gateway inclusion and paid integration/training | TCO comparison worksheet |
10.8 Launch in Phases and Reconcile the Forecast
Positioning needs evidence before a broad launch. Phase market entry to manage risk and learn quickly: early customers validate the value proposition and refine the sales process. Each phase needs exit criteria before the next begins.
Phased launch plan:
| Phase | Duration | Focus | Success Metrics |
|---|---|---|---|
| Alpha (Design Partners) | Months 1-3 | 5 friendly customers, free | Product feedback, case studies |
| Beta (Paid Pilots) | Months 4-6 | 15 customers, 50% discount | Conversion rate, NPS, time to value |
| Limited Availability | Months 7-9 | 30 customers, full price | Sales cycle, CAC, churn |
| General Availability | Month 10+ | Scalable sales motion | MRR growth, NRR, quota attainment |
Alpha customer selection criteria:
The pilot screen uses 200–1,000 employees, while the primary target above uses 500–2,500. These are different recruitment assumptions; state which cohort a sales or retention result represents.
| Criterion | Requirement | Why |
|---|---|---|
| Industry | Manufacturing, water/wastewater | Primary target segments |
| Size | 200-1,000 employees | Mid-size sweet spot |
| Technical champion | Identified, engaged | Ensures adoption |
| Reference willingness | Agreed upfront | Case study material |
| Equipment variety | 3+ machine types | Tests ML model breadth |
Go-to-market budget (Year 1):
| Category | Q1 | Q2 | Q3 | Q4 | Total |
|---|---|---|---|---|---|
| Product development | $200K | $150K | $100K | $75K | $525K |
| Sales team ramp | $100K | $250K | $350K | $400K | $1,100K |
| Marketing | $50K | $75K | $100K | $125K | $350K |
| Customer success | $25K | $50K | $75K | $100K | $250K |
| Infrastructure (cloud, tools) | $30K | $30K | $35K | $40K | $135K |
| Total | $405K | $555K | $660K | $740K | $2,360K |
Revenue projections:
| Quarter | New Customers | Cumulative Sensors | MRR | ARR Run Rate |
|---|---|---|---|---|
| Q1 | 5 (alpha, free) | 100 | $0 | $0 |
| Q2 | 10 (beta, discounted) | 300 | $5,850 | $70K |
| Q3 | 15 | 600 | $19,500 | $234K |
| Q4 | 20 | 1,000 | $39,000 | $468K |
10.8.1 Review the Proposed Strategy
The proposed strategy targets mid-size manufacturers with hybrid hardware + SaaS pricing and a direct sales-led channel approach. Review its decisions and risk mitigations together before treating the projections as a launch commitment.
Key decisions made and why:
| Decision | Rationale | Risk Mitigation |
|---|---|---|
| Target mid-size manufacturing | Balance sales cycles, need, and competition within manufacturing | Expand to utilities and HVAC in Year 2 |
| Hybrid pricing ($299 + $39/month) | Balances upfront barrier with recurring revenue | Offer lease option for budget-constrained |
| Direct sales first | Control narrative, learn sales process, build case studies | Partner channel in Year 2 for scale |
| 3-tier support | Matches support cost to customer value | Self-serve knowledge base reduces tickets |
| Phased launch | Reduces risk, builds proof points | Exit criteria for each phase |
Financial summary (Year 1 to Year 3; a separate projection):
This projection assumes 1,500 Year 1 sensors and $702K ending ARR, whereas the quarterly rollout above ends at 1,000 sensors and $468K ARR. It also lists $30,800 CAC and 4.0:1 LTV:CAC in Year 1, unlike the costed example’s at least $31,800 and at most 2.14:1. These planning assumptions need reconciliation before the earlier offer can pass its gate. The projected ratios rise to 6.8:1 and 10.2:1 as CAC falls, but require their own lifetime and margin assumptions.
| Metric | Year 1 | Year 2 | Year 3 |
|---|---|---|---|
| Customers | 50 | 150 | 350 |
| Sensors deployed | 1,500 | 6,000 | 18,000 |
| Hardware revenue | $449K | $1,346K | $3,588K |
| ARR (ending) | $702K | $2,808K | $8,424K |
| Gross margin | 65% | 70% | 75% |
| CAC | $30,800 | $18,000 | $12,000 |
| LTV:CAC ratio | 4.0:1 | 6.8:1 | 10.2:1 |
Critical success factors: return on investment (ROI), maintenance-system (CMMS) integration, and enterprise resource planning (ERP) integration all need evidence from the intended customer cohort.
- Prove ROI with alpha customers: 3 documented case studies showing $50K+ annual savings
- Nail the 2-week deployment promise: Differentiation evaporates if installation is painful
- Build integration partnerships: CMMS (Fiix, UpKeep), ERP (SAP, Oracle) integrations required for enterprise
- Control churn: Year 1 churn above 15% signals product-market fit issues
- Manage CAC burn: Direct sales expensive; must improve efficiency quarter-over-quarter
Summary
The proposed sensor offer targets mid-size manufacturing with $299 hardware, a $15/month lease option, and $19, $39, or $59 monthly SaaS tiers. Direct sales provides early customer learning; integrators, distributors, and OEM partners offer later routes to scale. The customer segment, price, channel, and support promise must work together.
The 100-sensor Advanced model produces $29,900 hardware revenue and $3,900 MRR before acquisition costs. In the separate five-year contract, $68,000 contribution LTV divided by at least $31,800 CAC gives at most 2.14:1, below the exercise’s 3:1 gate. Priority support further changes the operating allowance. Paid pilots must test value, willingness to pay, service burden, and deployment claims before forecasts justify a broader launch.
Price the service you actually promise, and compare contribution with acquisition cost using the same customer cohort, time horizon, and support assumptions.
Carry that costed offer into IoT Go-to-Market: Launch Gates and Channels to review the evidence for scaling.
