14 Business Model Cases: Unit Economics
More
Depth: Practitioner
Progress saves as you read. Mark sections complete as you go; your progress appears in the sidebar.
- Podcast audio coming soon
- Character narration audio coming soon
14.1 Make Recurring Value Cover the Full Cost
An asset tag saves search time but adds hardware, installation, network, and support costs. This chapter tests whether those costs are recovered, using the lighting-service comparison from Business Model Cases: Transfer and Lighting Services before following one subsidised tracker through its paid life. You will calculate cost, benefit, payback, and sensitivity, then decide what evidence supports adoption or rejection.
Imagine a firm gives a customer a small LTE-M GPS tracker for a shipping container and charges $10/device/month. The tag must stay useful and billable long enough to recover its subsidy. Location data must justify tags, gateways, connectivity, platforms, and human response through reduced shrinkage, better utilization, less delay, saved labor, or exception handling. A growing device count alone cannot answer whether this service works.
The problem is timing: hardware costs arrive before recurring fees, and loss or cancellation may end those fees early. We will first compare purchase and service costs, then calculate one tag’s margin, test reporting frequency and retention, and join the records needed to prove payback. These are the financial contracts underneath the revenue shifts in IoT Business Model Case Studies, including Lighting-as-a-Service, razor-and-blade economics, and data monetization.
KEY CONCEPTS
- Monthly margin
Collected fees must cover the recurring service cost.
- Hardware payback
Accumulated margin must recover the initial subsidy.
- Paid retention
Cancellation can end recovery before the device breaks even.
- Cost evidence
Join device activity, billing, support, and network records.
14.2 Learning Objectives
- Calculate asset-tracking cost, benefit, payback, and sensitivity.
- Set evidence thresholds for adopting or rejecting the case.
14.3 Compare the Customer’s Purchase and Service Costs
The lighting case first asks whether shifting ownership reduces the customer’s cost. Net present value (NPV) discounts future cash flows to today’s value. Using a 5% discount rate over 15 years, compare the traditional purchase with Lighting-as-a-Service (LaaS):
| Customer model | Calculation | Present-value cost |
|---|---|---|
| Traditional purchase | $1.5M upfront + sum of ($75K + $500K)/(1.05)^year, years 1–15 | $7.47M |
| LaaS | Sum of ($216K/year + $250K/year)/(1.05)^year, years 1–15 | $4.84M |
As signed cash flows, NPV_purchase = −$1.5M − $5.97M = −$7.47M, and NPV_LaaS is about −$4.84M. Both options are customer costs. Under these assumptions, LaaS reduces present-value customer cost by about $2.63M; that difference is not customer profit.
The customer gains a lower upfront capital requirement and potential energy savings, reduced maintenance burden, and performance accountability. Cash timing differs, while balance-sheet and tax treatment depend on contract classification and applicable rules. The provider takes more maintenance and obsolescence risk, giving the customer a reason to pay for illumination outcomes rather than fixtures alone.
The reported Schiphol arrangement shows a major airport accepting a service model for a mission-critical lighting environment. Retained provider ownership can support circular-economy goals through responsibility for reuse and recycling. The sale becomes an operational performance promise. This launch evidence establishes a shift in ownership, maintenance responsibility, circular-design incentives, and payment model; it does not establish a margin multiple.
14.4 Connect the Service Promise to Provider Economics
A lower customer cost leaves a second question: can the provider finance and deliver the promise? For Philips, subscription contracts create predictable recurring revenue, and long service contracts keep the provider engaged after installation. Retained ownership rewards durability and maintainability. Connected lighting infrastructure can also become an IoT platform for building management.
The contract determines how those benefits turn into obligations:
| Component | Implementation | Revenue Impact |
|---|---|---|
| Pricing Model | Service fee tied to light usage or managed lighting scope | Scales with customer size |
| Contract Length | Multi-year operating agreement | Supports financing of upfront equipment |
| Performance Guarantee | Contractual service level for lighting performance | Builds customer trust |
| Maintenance | Provider handles repairs, replacements, and durability | Reduces customer operational burden |
| Energy Savings | Efficient LEDs reduce operating cost | Makes the service easier to justify |
| Circularity | Provider plans reuse/recycling at end of life | Prevents customer equipment obsolescence |
Customer skepticism about “paying forever” rather than purchasing once calls for total cost of ownership (TCO) comparisons that show service-fee timing, energy savings, and avoided maintenance. Philips’ hardware-sales compensation also created internal resistance: rewarding contract value rather than transaction size addressed sales-team concerns about commissions.
The provider funds or finances more hardware upfront. Asset-backed financing lets banks lend against predictable subscription revenue, but it does not remove the need to recover the equipment investment. Technology risk also remains: a 50,000-hour LED lifespan guarantee depends on use, corresponding to roughly 10–15 years only at suitable annual operating hours. Conservative engineering margins and insurance policies for large installations help address the risk of failed guarantees.
These obligations explain the model’s competitive barriers. It requires financing capacity, reliable maintenance operations beyond product sales, and brand trust that the provider can honor a long contract. Connected lighting produces occupancy and energy-pattern analytics that can support smart-building upsells. A second data revenue stream still needs clear permission and value exchange.
The transferable lessons are concrete: outcome pricing ties payment to illumination; taking maintenance and obsolescence risk can justify premium pricing; and 10–15-year contracts can support upfront hardware investment. Patient capital matters because recovery occurs across the contract life. IoT can turn commodity hardware into service revenue, but only when operational accountability and financing support the promise.
14.5 Follow One Tag from Shipment to Payback
The tracker makes the same timing problem visible at the device level. Unit economics describes the costs and revenue of one device over its life. The subscription produces recurring revenue; cellular connectivity and cloud ingestion, storage, and processing create recurring costs. Subsidised hardware creates a one-time cost that later margin must recover.
14.5.0.1 Trace the Tag Costs
For one tag, start with an activated, paying device. Add hardware and setup to its share of connectivity, cloud work, support, replacements, and field visits. Ask when it became active and billable, whether loss, return, or a support visit interrupted paid use, and when collected fees covered its full service cost. Join tag identity to activation, billing, support, return, and cost records. A missing link between a bill and a device leaves payback unproven even when fleet revenue looks healthy.
Figure 1 connects device growth to the financial measures used to test it.
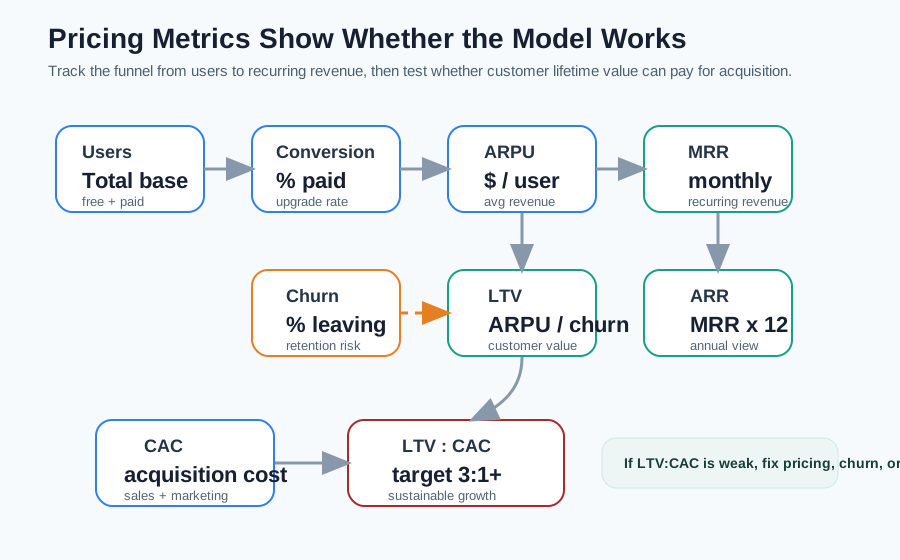
The chain moves from users through paid conversion to average revenue per user (ARPU), monthly recurring revenue (MRR), and annual recurring revenue (ARR). Churn is the rate at which customers leave. The dashboard’s lifetime value (LTV) estimate divides ARPU by churn; this is a revenue estimate, so the tracker review must also account for its subsidy and service costs. Customer acquisition cost (CAC) covers the cost of winning customers. Keep acquisition cost and hardware subsidy visible when testing the LTV:CAC ratio; do not let either disappear into a growth headline. Financial Metrics develops the margin, payback, LTV, and CAC language.
14.5.0.2 When a Tag Does Not Earn Back Its Cost
The same case looks different with different denominators. Separate shipped, activated, billable, retained, and past-payback devices. A tracker in a warehouse drawer still carries sunk hardware cost without subscription income. An active tracker may cost too much to connect, process, and support. Excessive updates create cellular and cloud cost; avoided loss or faster claims settlement gives customers a reason to renew.
Hardware revenue arrives once at shipment. Service revenue depends on remaining useful, connected, supported, and trusted long enough to cover subsidy, acquisition, and operating costs. Renewal behavior tests that promise. Use this analysis whenever a pitch claims recurring revenue without showing paid retention, per-device margin, payback, churn sensitivity, and attributable costs.
14.6 Test Monthly Margin Against Reporting Frequency
Put representative numbers on one device before approving its reporting behavior:
| Line item | Per device / month |
|---|---|
| Subscription revenue | +$10.00 |
| Cellular connectivity (LTE-M plan) | -$2.00 |
| Cloud (ingest, store, serve) | -$0.30 |
| Support and overhead (allocated) | -$1.70 |
| Gross margin | +$6.00 |
The table labels the $6 remainder “gross margin”; here it includes allocated support and overhead, so use it consistently as the monthly contribution available for subsidy recovery. A device that costs $40 to build and is given away pays back in $40 / $6 = 6.67 months, or about 7 months. Contribution starts recovering hardware immediately; cumulative contribution exceeds the subsidy during month 7.
A tracker reporting every 5 minutes sends about 288 messages/day, or roughly 1.7 MB/month in this example. Every-minute reporting raises message volume about 5×. Connectivity then moves toward $4–$5/month, leaving $3–$4/month against the unchanged $10 subscription, $0.30 cloud cost, and $1.70 support allocation. Payback becomes about 10–13.3 months. At the $5 connectivity end, margin halves and payback doubles. The reporting interval is therefore a financial decision as well as a product decision.
Use this table as a control surface during product review. The team should not approve a reporting interval, roaming SIM plan, dashboard retention period, or support SLA without showing which line item changes. LTE-M coverage may be essential for containers that travel outside Wi-Fi range, but the plan must include roaming policy, overage handling, inactive-device suspension, and firmware behavior when the device cannot attach; firmware is software stored in the device. A “better” technical setting can be a worse business setting if it adds cost that customers will not pay for.
Also separate gross margin from payback and LTV. Gross margin answers whether one active month is profitable. Payback answers how many active months are needed to recover the device subsidy. LTV answers whether the expected customer life covers subsidy, customer acquisition cost, replacements, support, refunds, and cloud operations. A healthy pilot should report all three, with sensitivity cases for churn, battery replacement, lost devices, and lower-than-expected utilization.
Pricing Strategies connects these cost changes to what customers pay. A faster interval needs a visible benefit that supports its recurring cost.
14.7 Keep Paid Devices Beyond the Recovery Point
Subsidised hardware creates a hidden dependency on retention, the length of paid use. Because cumulative contribution only covers the subsidy at roughly 7 months, a customer who cancels in month 3 leaves the business at a loss: the subsidy was never recovered. This is why churn is central to these models. High churn among short-lived subscribers can make every new device a money-loser even as the subscriber count climbs.
The mechanism forces specific design and pricing choices: lengthen expected life with rugged hardware and long battery life, reduce the subsidy or add a modest hardware fee to shorten payback, or add a minimum-term contract so a device cannot churn before it breaks even. Each is a lever on the same equation: get customers past payback before they leave. A model that ignores churn can show growing revenue while quietly losing money on every subsidised unit that cancels early.
Worked example: Two cohorts of 1,000 devices each carry a $40 subsidy and $6/month margin, so payback takes about 7 months. Cohort A’s customers stay 24 months on average, so each nets about 24 x \$6 - \$40 = \$104 in lifetime margin. Cohort B churns at 4 months average, before payback, so each device loses about $16: only $24 of margin against the $40 subsidy. Same product, same price; the churn rate flips the business from profit to loss. That is why the case’s real lesson is retention economics, not the demo.
14.8 Build the Evidence for an Expansion Decision
The cohort calculation depends on knowing what happened to each device. Telemetry means reports sent by a device so people can check it remotely. A recent location report proves neither that the subscription is paid nor that the hardware has paid back.
The business metric depends on telemetry quality. The backend should keep a device lifecycle state separate from billing state: manufactured, provisioned, shipped, activated, attached to network, reporting, suspended, lost, replaced, cancelled, refurbished, or decommissioned. MQTT or HTTPS event ingestion, SIM or eSIM account records, warehouse shipment data, billing records, and support tickets all need a shared device identifier so finance can reconcile active devices with actual network and cloud cost.
Cost instrumentation should be designed into the platform. Tag messages by customer, device, firmware version, reporting profile, region, and network plan before they enter services such as Amazon Web Services (AWS) IoT Core, Azure IoT Hub, object storage, stream processing, and analytics warehouses. Without those tags, the team cannot tell whether margin erosion came from one enterprise customer, a bad firmware retry loop, roaming traffic, dashboard queries, or a pricing assumption that was never true.
Subtract connectivity, cloud, and allocated support costs from collected fees for each group, then compare accumulated contribution with hardware and setup cost. Reporting frequency can lengthen recovery, while cancellation or loss can stop paid use before recovery. A retained device still needs its accumulated margin checked; continued activity alone does not establish profit.
Hold expansion until retained paid-device counts, per-device margin, and subsidy payback meet the pilot’s targets. Activations and vendor forecasts of total connections do not establish those results. Review sensitivity to volume, loss rate, churn, battery replacement, and utilization before adopting or rejecting the case. The applications module index places this evidence alongside other application cases.
Summary
The lighting comparison shows how a service contract can lower customer present-value cost while moving financing and maintenance obligations to the provider. The tracker case tests that provider obligation one device at a time: collected fees must cover recurring costs and recover the initial subsidy.
At $6 monthly contribution, the $40 tracker recovers its hardware cost in 6.67 months. More frequent reports reduce contribution, and early churn can end recovery. Retained billable devices, attributed costs, and joined lifecycle records make the adoption decision reviewable.
Recurring revenue works only when paid retention and accumulated margin recover the full service investment. Set the expansion gate using that evidence.
Carry these calculations into Business Model Cases: Proposals and Economics.
