17 Data Monetization: Direct and Ecosystem Value
17.1 Start With the Decision
A data product has no value until a named customer can act on it. The team must link the data, decision, benefit, and payer.
17.2 Route Overview
This is part 1 of 2. Continue with Data Monetization: Privacy and Governance Controls.
17.3 Part Objectives
- Compare direct, indirect, and ecosystem revenue models.
- Connect an IoT data product to a measurable customer action.
17.4 Start With the Story
A connected service has years of sensor records, and a partner offers to pay for access. Sending raw rows would be easy, but it could expose people and still leave the buyer without a useful decision. The team must define the insight, evidence, permission, price, and ongoing safeguards first.
17.5 Overview
This route designs an insight product, tests direct and indirect revenue, and applies privacy, ethics, consent, regulation, and decision-value pricing.
This is part 2 of 2. Review Data Monetization: From Raw Data to Value when you need the first route.
17.6 Learning Objectives
By the end of this chapter, you will be able to:
- design an insight product instead of selling raw records
- compare direct and indirect data-revenue models
- apply privacy, consent, regulation, and decision-value safeguards
17.7 Chapter Roadmap
- Start With the Story
- Overview
- Data Monetization
- Sell Insights, Not Raw Data
- Applying Data Monetization in Practice
- Cross-Reference
- Checkpoint: Data Product Economics
- Indirect Revenue Models
- Ecosystem Revenue Modeling
17.8 Data Monetization
Figure 17.1 answers the question this chapter keeps returning to: what has to happen to raw telemetry before anyone will pay for it?
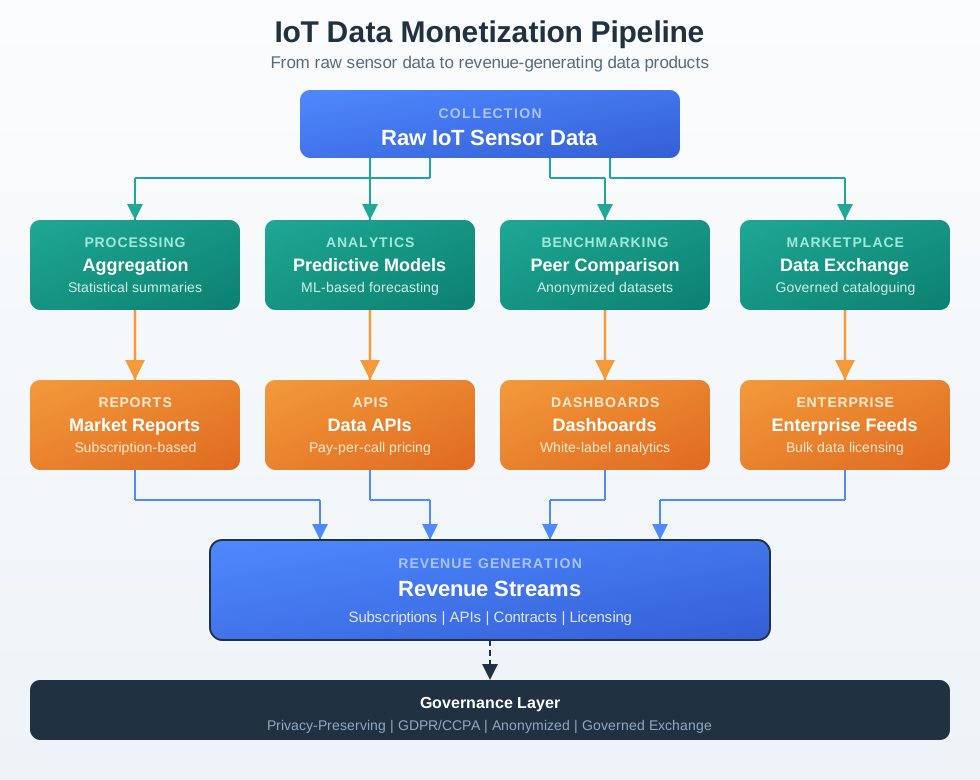
Figure 17.1 runs left to right, and the first box is the one nobody buys. Raw sensor data becomes summaries, then models, then peer benchmarks, and only then reaches a catalogue where a buyer can find it. Each step removes detail and adds meaning, which is the trade this chapter argues for. The four product shapes in the next column matter because they set the price. A report sells by subscription, an interface sells by the call, a dashboard sells as a service, and an enterprise feed sells by licence. The band running underneath is not decoration. Privacy protection, data-protection law and governed exchange run beneath every stage, so a product that fails there never reaches the revenue step.
Figure 17.2 puts figures on the same four steps, which makes the size of each change easier to judge.
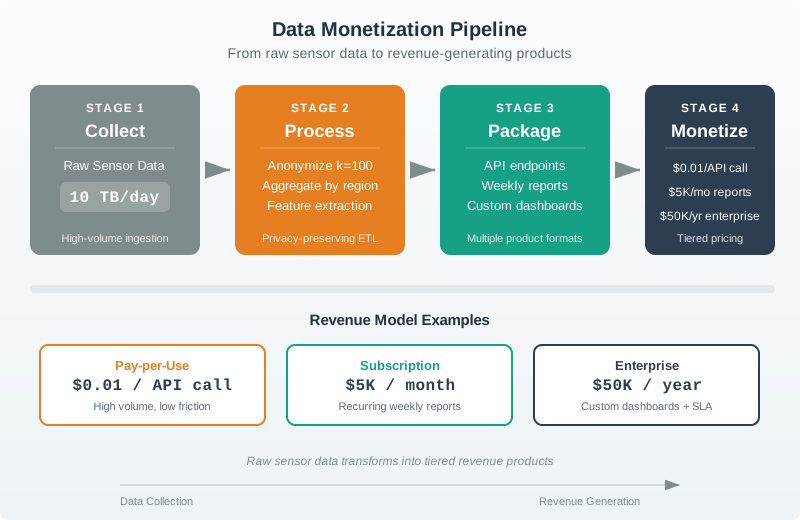
Compare the two ends of Figure 17.2. Ten terabytes a day arrive as raw readings, and what leaves is a short price list. The middle of the figure is where the value is made, and the numbers beside it are the honest part: a fraction of a penny for one interface call, thousands a month for a recurring report, tens of thousands a year for an enterprise deal with a service promise. The same underlying readings support all three. What differs is how much work has been done for the buyer, and how much responsibility comes with it. Price tracks packaging and promise, not the volume of telemetry collected. IoT devices generate large amounts of data that can be monetized in various ways while respecting privacy and regulatory constraints. Market forecasts vary by analyst and definition, so the durable skill is evaluating whether a proposed data product has a named buyer, a clear decision value, and a defensible privacy boundary.
17.8.1 Aggregated Insights
Sell anonymized, aggregated data to third parties for market research and trend analysis.
How it works: Raw sensor readings from thousands or millions of devices are combined into statistical summaries that reveal patterns without identifying individuals. The aggregation itself creates the value — no single device’s data is interesting, but the population-level trends are highly valuable.
Pattern examples:
| Company | Data Source | Buyer | Revenue Model |
|---|---|---|---|
| Smart thermostat platform | Regional temperature, humidity, and HVAC-state patterns | Utility planning teams | Demand forecasting reports and dashboards |
| Fitness route platform | Aggregated cycling/running traces | City planning departments | Heat maps and corridor analysis |
| Connected vehicle platform | Aggregated vehicle telemetry | Insurance and mapping companies | Governed API or clean-room access |
| Indoor air quality platform | CO2, particulate, and ventilation trends | Real estate and HVAC teams | Building health benchmarks |
Critical considerations:
- Ensure proper anonymization techniques (minimum group sizes of 50-100)
- Comply with GDPR, CCPA, and other data protection regulations
- Maintain user trust through transparency about what data is shared
- Obtain explicit consent before collecting data intended for third-party sale
- Regularly audit anonymization to prevent re-identification attacks
17.8.2 Predictive Analytics
Generate revenue from actionable predictions derived from IoT data. Unlike raw data or simple aggregations, predictive analytics applies machine learning models to forecast future events, making the output significantly more valuable.
Value chain: Raw data ($0.001/record) -> Cleaned data ($0.01/record) -> Aggregated statistics ($0.10/record) -> Predictive insights ($1-10/prediction)
Implementation examples:
- Fleet management: Telematics platforms can sell predictive maintenance insights that forecast component failures before roadside breakdowns.
- Agriculture: Weather, soil, and equipment telemetry can become field-level irrigation, yield-risk, or input-planning recommendations.
- Energy: Smart-meter analytics can identify usage patterns and appliance-level signals that utilities use for efficiency programs.
17.8.3 Benchmarking Services
Provide customers comparative performance data to help organizations understand their position relative to peers.
How it works: Your platform collects operational data from many customers, then offers each customer a view of how they compare to anonymized industry averages, top performers, and similar organizations.
Implementation examples:
- Energy Star Portfolio Manager: Buildings benchmark energy efficiency against similar properties nationwide
- Samsara: Fleet operators compare fuel efficiency, safety scores, and maintenance costs against industry peers
- Enlighted: Office buildings compare occupancy and space utilization against regional benchmarks
Pricing models: Benchmarking is usually sold as a subscription or account add-on. Higher tiers justify price when they provide finer peer groups, stronger data quality, and actionable recommendations rather than static charts.
17.8.4 Data Marketplaces
Create platforms where data buyers and sellers connect, facilitating data exchange with proper governance. Data marketplaces act as intermediaries, handling consent management, quality assurance, pricing, and delivery.
Marketplace economics:
First, Platform typically takes 15-25% transaction fee. Next, Sellers set pricing (per-record, per-query, or subscription). Then, Quality scoring and provenance tracking increase data value. After that, Escrow and preview mechanisms build buyer confidence.
Implementation examples:
First, Dawex: Enterprise data exchange platform for IoT and operational data. Next, Datarade: Aggregates data providers including IoT sensor data streams. Then, AWS Data Exchange: Marketplace for third-party data including IoT datasets. After that, John Deere Operations Center: Farmers can share anonymized field data with researchers and input suppliers.
The mistake: Offering raw sensor CSV exports (temperature readings, GPS coordinates, accelerometer values) as the primary data product.
Why it fails: Raw telemetry has weak market value because buyers must invest heavily in cleaning, processing, and analyzing it themselves. The same data becomes more useful when processed into building efficiency benchmarks, HVAC failure predictions, and energy optimization recommendations.
The consequence: Teams can spend heavily on collection infrastructure, then discover that raw exports produce weak revenue because buyers still have to clean, join, validate, and interpret the data. The value-to-cost ratio improves only when the product becomes a decision-ready insight.
The fix: Transform raw data into three tiers of increasing value:
| Tier | Product | Example | Price |
|---|---|---|---|
| Tier 1: Raw data | CSV exports, API dumps | Temperature readings every 5 min | Lowest value; highest cleanup burden |
| Tier 2: Processed features | Cleaned, aggregated, labeled | Daily energy consumption by zone | Higher value when it fits a workflow |
| Tier 3: Actionable insights | Predictions, recommendations, benchmarks | “HVAC unit will fail in 14 days” | Highest value when the decision saves cost |
Illustrative outcome: Repackaging raw data as Tier 3 insights can increase revenue per data point because the buyer pays for a decision-ready signal. For example, a smart-building platform might compare a low-price raw reading export with a higher-value failure prediction subscription; the second product earns more only if the prediction reliably prevents maintenance cost or downtime.
Key principle: Data value is created through processing, not collection. Budget for analytics, governance, product packaging, and buyer integration before scaling sensors and data lakes.
17.8.5 IoT Data Valuation
Before monetizing data, you need a framework for estimating its value. Not all IoT data is equally valuable — freshness, exclusivity, accuracy, and actionability all affect pricing.
Data value multipliers:
| Factor | Low Value | Medium Value | High Value |
|---|---|---|---|
| Freshness | Historical (>7 days) | Near-real-time (hours) | Real-time (<1 min) |
| Exclusivity | Commodity data available from many sources | Limited to a few providers | Only you can provide it |
| Accuracy | <95% confidence | 95-99% confidence | >99% calibrated |
| Actionability | Context/background info | Informs decisions | Triggers automated actions |
| Coverage | Local/single-site | Regional | National/global |
17.9 Applying Data Monetization in Practice
In real deployments, implementing data monetization is less about writing a single Python script and more about designing a pipeline:
First, Ingestion and Cleaning — Raw telemetry arrives from devices, is validated, deduplicated, and anonymized where needed. This stage typically filters out 10-30% of data as noise or duplicates. Next, Feature Engineering — You transform raw readings into higher-level features such as daily energy use, anomaly flags, or churn risk scores. This is where most of the intellectual property and competitive advantage resides. Then, Productization — Those features become reports, dashboards, APIs, or benchmark services that customers pay for. Each product format serves a different buyer persona and price point. After that, Governance and Compliance — Every step must comply with GDPR/CCPA and internal data-handling rules. Automated compliance checks should be embedded in the pipeline, not bolted on afterward.
For technical details on building these data pipelines, see:
- Edge Computing Patterns in Module 5.3 — how to process data before it leaves the device
- Stream Processing in Module 6.2 — real-time data transformation architectures
- Data Storage in Module 6.1 — choosing the right database for your data products
The key monetization step is deciding which derived insights are valuable enough that customers will pay for them. A useful test: if the insight saves or earns the buyer at least 10x what they pay for it, you have a viable data product.
 Checkpoint: Data Product Economics
You now know:
- The teaching scenario compares 80TB/day of raw thermostat data with processed insight pricing.
- In that scenario, raw CSV value is $292K/year, processed insights are $120M/year, and the value multiplier is 411x.
- A practical buyer test is whether the insight saves or earns at least 10x what the buyer pays for it.
Data products are one route. The next route monetizes the ecosystem around the device: partners, referrals, recommendations, and reduced churn.
17.10 Indirect Revenue Models
Indirect revenue models generate income not from the IoT product itself, but from the ecosystem, relationships, and behaviors it enables. For many IoT companies, indirect revenue ultimately exceeds direct product sales.
Figure 17.3 sorts ecosystem income into four families and puts a rough size against each one.
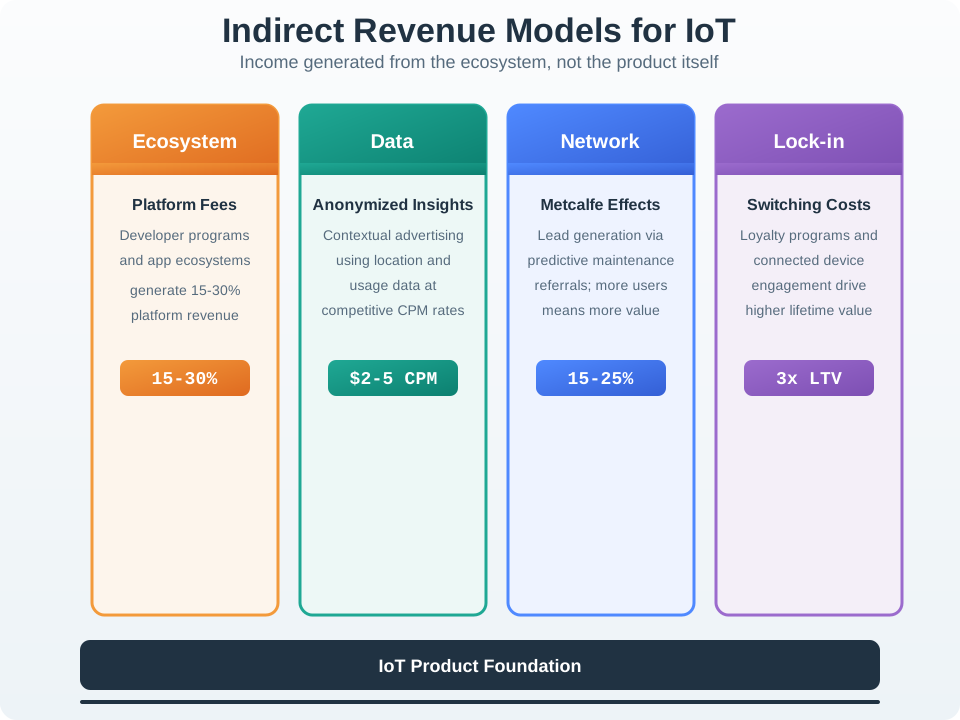
Everything in Figure 17.3 grows from the block at the base, so the installed product is the asset even when it is not the thing being sold. The four branches then earn in different ways. Platform fees charge the developers and integrators who want access to that base. The data branch sells anonymized context, priced here in single dollars per thousand impressions. The network branch earns from referrals and grows as the user count grows. Lock-in is the odd one out, because it raises lifetime value by making customers stay rather than by billing anyone. The figures are illustrative, but the point they carry is not: none of these branches exists without a product people keep using.
Figure 17.4 widens the frame, setting indirect revenue beside the direct routes it usually has to live with.
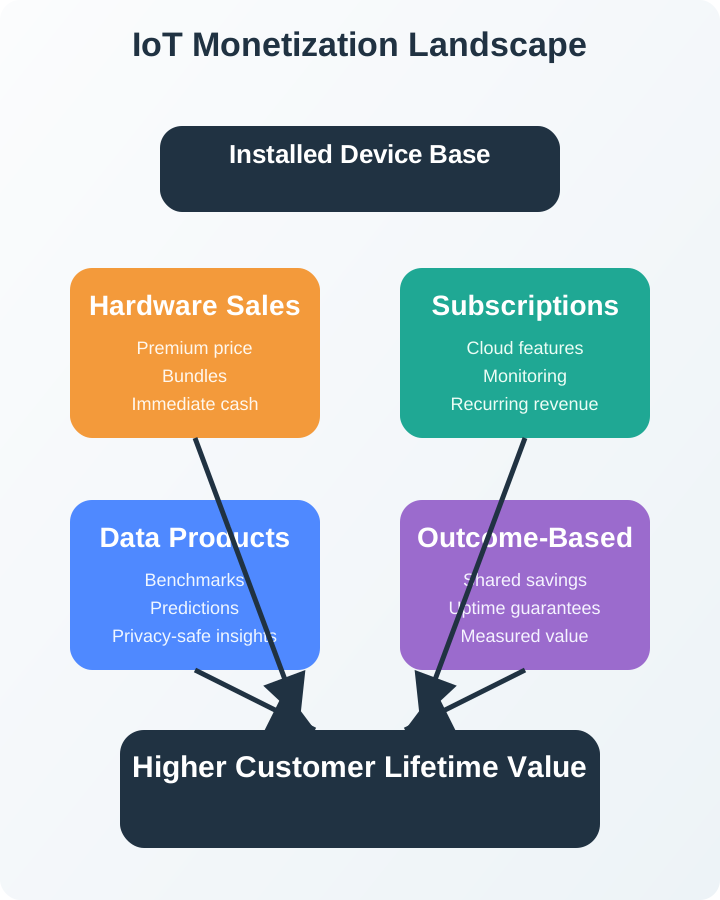
Figure 17.4 starts and ends in the same place. The installed device base feeds four pillars, and all four feed back into customer lifetime value. Hardware sales come first because they bring cash in early, but they stop the moment the box is delivered. Subscriptions charge for a capability that has to keep working, which turns support quality into revenue rather than cost. Data products sell benchmarks and predictions, and the figure attaches the words privacy-safe to them for good reason. Outcome-based pricing goes furthest, billing on measured savings or uptime, which only works when the supplier can prove the result. Most firms run several pillars at once, and the diagram shows why.
17.10.1 Ecosystem Monetization
Ecosystem monetization leverages the network of third-party developers, manufacturers, and service providers that build around your platform.
Platform Fees: Charge third-party developers or integrators API access fees, certification fees, or revenue sharing. In a smart-home ecosystem, the fee must be justified by real value: user reach, integration tooling, device certification, cloud infrastructure, support, and reduced partner acquisition cost.
| Platform Mechanism | What the Partner Gets | Why It Can Be Billable |
|---|---|---|
| API access | Commands, device state, automations, and account linking | Lets the partner plug into an existing user workflow |
| Certification | Compatibility testing and a “works with” badge | Reduces buyer uncertainty and support risk |
| Marketplace listing | Discovery, ratings, documentation, and onboarding | Lowers customer acquisition cost |
| Cloud integration | Event routing, permissions, rate limits, and monitoring | Avoids every partner rebuilding the same infrastructure |
Certification Programs: Generate revenue from “Works with” certification, testing, and compliance services. The defensible price depends on test depth, support burden, legal review, and the demand created by the platform.
Training and Education: Monetize ecosystem expertise through developer training programs and certification courses. Training revenue is usually secondary; the larger value is reducing support load and increasing successful integrations.
Model ecosystem monetization revenue from platform fees and certification programs. Adjust partner count and fee structure to project total revenue.
17.10.2 Advertising and Sponsorship
Display relevant advertising or sponsorship based on IoT data insights, requiring careful balance to avoid user alienation. Example: a free fitness app may show relevant sports-equipment offers, while a security camera or health-adjacent product needs a much stricter standard.
Revenue potential by channel should be modeled as assumptions, then validated with actual engagement:
First, In-app display ads: low friction, low trust risk only when clearly separated from product controls. Next, Sponsored content/recommendations: higher value when the recommendation helps the user’s task. Then, Location-based promotions: higher relevance, higher privacy scrutiny. After that, Native integrations: brand partnerships that must not compromise user safety or autonomy.
Best practices:
First, Ensure ads are genuinely relevant and valuable to the user context. Next, Provide ad-free paid option (typically $3-10/month). Then, Never compromise user privacy for advertising revenue. After that, Be transparent about data usage in clear, plain-language policies. Finally, Cap ad frequency to avoid fatigue (max 2-3 per session).
17.11 Continue to the Next Part
Carry this evidence into Data Monetization: Privacy and Governance Controls, which begins with Common Pitfall: Ad-Driven Revenue in IoT.