2 Manufacturing IoT: Connected Factory Systems
More
Depth: Practitioner
Progress saves as you read. Mark sections complete as you go; your progress appears in the sidebar.
- Podcast audio coming soon
- Character narration audio coming soon
2.1 Start With One Motor
Manufacturing IoT connects machines, workers, quality systems, and maintenance records so that raw signals can change production decisions. Smart manufacturing, also called Industry 4.0 or the Industrial Internet of Things (IIoT), links production from the factory floor to the customer site. Its aims include predictive maintenance, quality optimization, and supply-chain visibility. The practical test is whether that connection protects throughput and repeatability.
Picture one motor on a production line. Its sound changes before a bearing fails. The team wants an early warning, but a false stop also wastes time and material. Sensors measure vibration, temperature, electrical current, and ultrasonic signals; computers look for patterns that people might miss. Like a car dashboard warning of low oil, the warning is useful when someone can check the problem before damage occurs.
Name the plant decision first: which signal is watched, who receives the warning, what check follows, and what result permits a stop. Tie that path to the machine state and work order. More sensors can add detail, but they also add mounting, cleaning, network, and maintenance tasks. One motor cannot prove the value of a whole connected factory, settle safety or worker impact, or establish returns for packaging and supply. Each claim needs an owner and a measured result.
This chapter follows that decision loop into the plant stack, then tests the evidence needed to trust it. You will connect sensors to decisions using range, error, power, and interface evidence, and define a concrete scenario with pass criteria. The wider manufacturing route considers the four pillars of smart manufacturing and their business value, smart packaging for food safety, retail checkout and shelf monitoring, manufacturing and retail return on investment (ROI), factory-to-customer visibility, and reactive, preventive, and predictive maintenance. Maintenance and Supply Chains extends those comparisons beyond this first factory case.
Allow about 25 minutes for this intermediate factory discussion.
The problem is therefore larger than detecting a changing sound: the plant must connect a trustworthy measurement to accountable action. Start with the decision, map the systems that can carry it, then test both missed warnings and false stops.
KEY CONCEPTS
- Predictive maintenance (PdM)
Uses sensor evidence of approaching failure to time parts replacement, avoiding early replacement and unplanned downtime.
- Overall equipment effectiveness (OEE)
Combines availability, performance, and quality rates to score manufacturing efficiency in real time.
- Condition monitoring
Continuously measures vibration, temperature, and acoustic emission to track machine health trends.
- Digital twin
A virtual replica synchronized with real-time sensor data for simulation and anomaly detection.
- SCADA
Supervisory Control and Data Acquisition aggregates industrial sensor data for centralized monitoring and control.
- Vibration signature analysis
Frequency-domain analysis identifies bearing wear, imbalance, and misalignment before catastrophic failure.
- Mean time between failures (MTBF)
The average operational time between failures; compare it before and after maintenance changes.
2.2 Part Objectives
- Test connected factory with a concrete scenario and pass criteria.
- Evaluate connect sensors to the plant stack with range, error, power, and interface evidence.
2.3 Turn Signals Into Plant Decisions
A vibration alert, OEE dip, temperature excursion, or smart-package event creates value only when it changes a production, maintenance, quality, energy, or supply-chain decision. The signal must reach the person and system that can schedule work, change a recipe, quarantine stock, adjust a line, or stop a release. Ask what becomes earlier, safer, cheaper, or more reliable because the evidence exists.
For the motor, identify the asset, fault mode, downtime window, spare part, work-order owner, and production tradeoff before selecting accelerometers. For quality monitoring, identify the recipe parameter, batch identifier, sampling plan, acceptance rule, nonconformance owner, and release decision before selecting vision cameras or temperature probes. For traceability, choose the lot, serial, barcode, radio-frequency identification (RFID), GS1 Digital Link, or work-order identifier that ties the sensor evidence to the product being shipped.
Three questions keep this work concrete. Which machine, line, product, batch, recipe, or work order does the signal describe? Does it create a maintenance work order, production hold, supervisory alarm, quality nonconformance, purchase action, or operator instruction? Who owns the sensor, gateway, tag mapping, historical data store, alert threshold, and change-control path after the prototype? A dashboard alone leaves those questions unanswered.
The motor example makes the ownership test specific. The warning needs the bearing identity and operating mode; the fitter needs a work-order link; the production team needs the downtime window. Keep the maintenance disposition with the original signal so the next review can distinguish a confirmed fault from an unnecessary stop. The same record should show which production tradeoff justified the intervention.
Figure 1 follows a vibration alert through collection, connectivity, operational context, analytics, and execution. The return path matters: the plant needs a record of what happened after the warning, so it can compare the decision with the eventual maintenance finding.
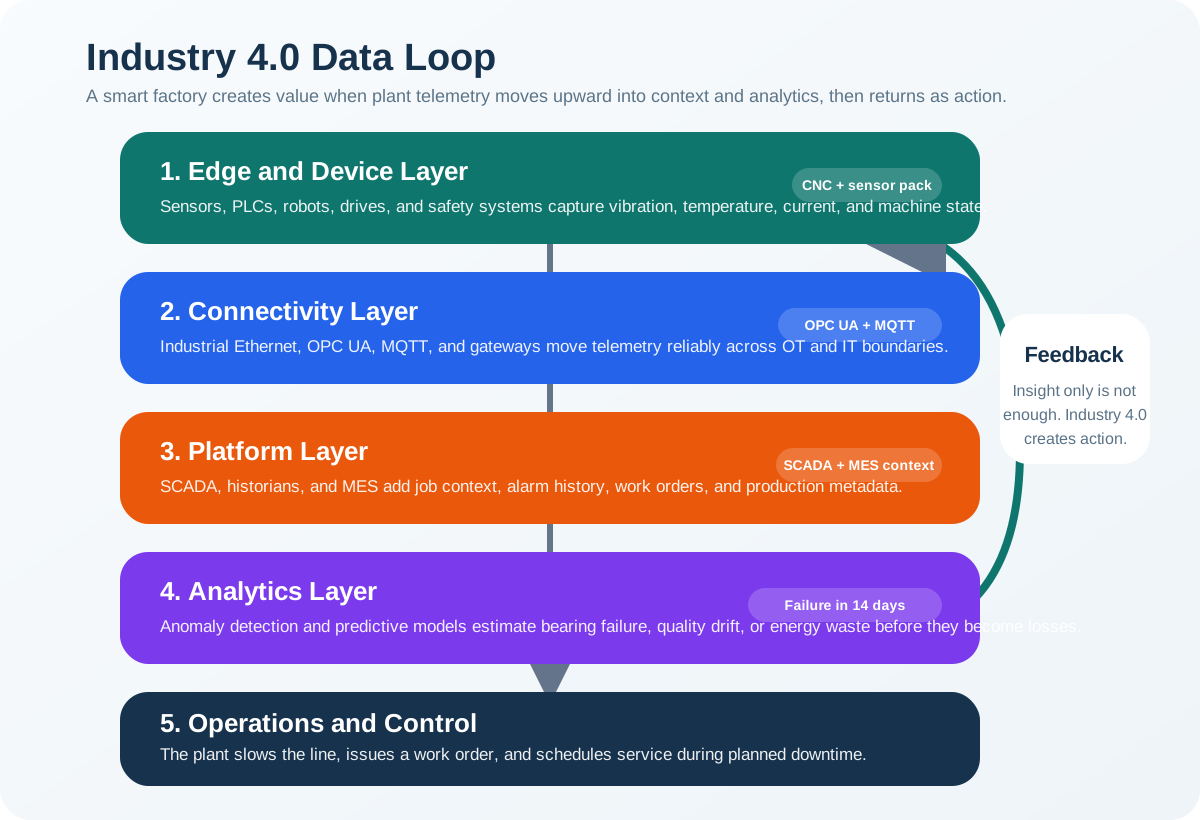
Read the loop from collection to execution. The raw vibration signal needs units, time, sample rate, and sensor health so its meaning can be checked. OPC UA or MQTT carries the signal across the plant boundary. Operations systems add the asset, line, material lot, recipe, and work order; analytics can then classify the event as an alarm, quality hold, or maintenance request. The loop closes when a maintenance or production system schedules work, adjusts the line, or stops a release and records the result.
The same discipline applies after products leave the line. Smart packaging, shelf weight sensing, and recall checks need to reach replenishment, quarantine, customer-notification, or product-lockout workflows quickly enough to prevent waste or harm. A supply chain is the product’s journey from factory to store and customer. Condition evidence must retain the identity needed to act along that journey.
For example, time-temperature indicators and freshness sensors add condition evidence to date labels and batch records. USDA estimates that 30% of the US food supply is lost or wasted at retail and consumer levels; date-label confusion is one cause, not the whole 30%. Link that evidence to quarantine, release, and recall rules. A cold-chain breach needs the affected lot and its production, transport, store-receipt, and buyer records. Where one serialized carton has its own temperature trace and handoff history, that unit evidence supports a narrower hold than treating every carton in the lot as affected.
2.4 Connect Sensors to the Plant Stack
Once the decision and identity are clear, map the systems that must carry them. Operational technology (OT) includes the equipment and systems used to monitor and control the plant. Manufacturing prototypes commonly cross between OT and enterprise systems, so the map must show both the measurement source and the action owner.
Programmable logic controllers (PLCs) and drives from Siemens, Rockwell Automation, Beckhoff, WAGO, Schneider Electric, or Omron may expose tags through Process Field Network (PROFINET), EtherNet/IP, Modbus TCP/RTU, OPC UA, IO-Link, or vendor tooling. Human-machine interfaces (HMIs) and SCADA systems such as Ignition, FactoryTalk, WinCC, or AVEVA System Platform may own alarms and operator visibility. Historians, which store time-series records, such as AVEVA PI System or InfluxDB may own that historical context.
A manufacturing execution system (MES), enterprise resource planning (ERP) system, or computerized maintenance management system (CMMS) may own schedules, work orders, inventory, and cost decisions. Examples include SAP, Oracle, and IBM Maximo. Naming these owners explains why an alert that reaches a screen can still fail to schedule maintenance: the display and the work-order system have different jobs.
Keep four stages visible in the implementation map. Collection records the raw signal with units, timestamp source, sample rate, deadband, calibration state, and device health. Context binds it to ISA-95 concepts: enterprise, site, area, line, cell, asset, material lot, recipe, and work order. Decision logic classifies the event as advisory, an alarm, a quality hold, an automatic setpoint recommendation, or a maintenance request. Execution sends the result to the system that owns action, such as a CMMS work order, MES hold, SCADA alarm, warehouse pick, or ERP purchase requisition.
This mapping changes procurement. A vendor dashboard may help with setup, but test export paths, API limits, tag naming, identity mapping, role-based access, certificate management, and historical replay before rollout. A data silo traps information in one system so it cannot be shared. Connecting the dashboard to existing ERP, MES, and quality systems helps prevent the project from creating another silo.
For a brownfield line, a modest gateway that reads existing PLC tags and adds batch and asset context is often the useful design. For a greenfield line, standardize naming, units, OPC UA nodes, MQTT topics, historian retention, and integration contracts before production starts. The chapter’s planning guidance allocates 30–40% of IoT project cost to integration and calls for API-first architecture in procurement. Ask whether the design integrates with ERP/MES and whether ROI can be measured within 12 months. If either answer is no, redesign before investing.
For predictive maintenance, record accelerometer axis, sampling rate, fast Fourier transform (FFT) window, motor current, bearing asset ID, operating mode, baseline period, alarm threshold, work-order link, and maintenance disposition. These fields let a reviewer connect the warning to the operating conditions and the eventual finding.
For production visibility, record PLC tag, line state, takt time, downtime reason, OEE component, batch ID, shift, operator acknowledgement, and MES/ERP mapping. For quality and traceability, record recipe version, lot ID, barcode/RFID/GS1 Digital Link identifier, sensor calibration, reject rule, nonconformance owner, and hold/release decision.
For supply-chain and retail loops, record time-temperature indicator state, cold-chain event, shelf weight/RFID count, expiration rule, recall scope, and replenishment action. A smart shelf uses a built-in scale to detect falling stock. Reconcile checkout sales with item identity and shelf counts, then assign replenishment when the threshold is crossed; an anonymous alert does not identify either the refill task or its owner.
2.5 Test the Warning and the Work Around It
The integration map says where the signal should go. The motor trial must now show whether it arrives with the right meaning and changes work usefully. Name the line, motor, product, and shift owner. Record normal sound, heat, and current together with machine state, batch name, and work order. For a known fault, time the first warning, ask a fitter to check, save the finding, and link it to the warning. Reset only with a recorded cause.
Test a missed warning as its own case. Retain the raw signals and stop time, count damaged parts and lost time, note safety risk, and investigate why the rule missed the wear. Change one rule, replay the old case, and retain the old result for comparison. Then test false warnings on a healthy motor: vary load, product, shift, and normal noise. Check whether the line stops, count the resulting waste, and decide whether a human check should precede action. Define a safe path when the evidence is uncertain.
Test the supporting links as well. Lose the local network while preserving the safe machine state; lose the remote service while preserving the local warning. Fill the data store, restore connections, and check message order, timestamps, and duplicate work orders. Assign an owner to each failure. Test the sensor physically by moving, tightening, and loosening it, exposing it to dust, heat, and wash water, and cutting and restoring power. Check its clock, identity, and mapping to the correct motor. A clean screen cannot prove a sound mount.
People are part of the trial. Keep warnings clear and near the task, make stop causes visible, and avoid blaming a worker from one signal. Give staff a way to report errors, record changes, train the next shift, and test the repair route. These checks preserve the distinction between detecting a condition and improving the work that follows it.
The original SuperWidget Factory example makes those roles memorable. Vibey the Vibration Sensor is on Machine #7’s spinning motor. In that illustrative story, a small rattle gives about 3 weeks’ warning of bearing wear; a weekend repair avoids a missed working day. Sparky the Current Sensor sees the largest machine rise from its normal 50 amps to 62 amps, prompting a check for a tight belt or a gear needing oil before the motor burns out. Both examples connect a changing measurement to an investigation.
A temperature sensor travels inside a box of chocolate bars. The story’s storage limit is below 72 degrees Fahrenheit; a reading rising to 74 degrees Fahrenheit prompts a phone warning to the driver to check the cooling unit and protect $5,000 of candy. A smart scale watches Shelf 7B at MegaMart: 24 cereal boxes weigh about 18 kilograms, then the reading falls to 12 kilograms and prompts the stockroom to replenish Crunchy Oats. Before that shelf evidence, stock could remain empty for hours. These are condition and stock signals with different action owners.
A time-temperature warning likewise needs more than a rising number. Thermo identifies a cooling problem for the driver to check, while the product identity and hold rule determine what happens to the shipment. Scally identifies a shelf and product for the stockroom, while checkout evidence helps reconcile the remaining stock. Neither a weekly aggregate nor a camera view without item identity supplies that complete replenishment record.
Factory Manager Maria’s story reports zero surprise breakdowns that month, $50,000 saved in emergency repairs, sensors paying for themselves in two months, and safer work for the factory team. Treat those as the example’s outcomes to verify, rather than proof supplied by a sensor alone. Likewise, the chapter’s comparison with reactive “fix it when it breaks” maintenance gives 25–30% lower maintenance costs and 70–75% fewer breakdowns for condition-based approaches; its PdM discussion gives a 30–50% MTBF improvement through early intervention. Test such claims against the plant’s own baseline and maintenance records.
Count parts and time saved alongside extra checks, new maintenance work, spare parts, service fees, false stops, and pilot cost. Compare the same time span and state what remains unknown. A useful pilot can still need more proof; an unsuccessful one can reveal a better question. That is how the single-motor case supports a measured investment decision without standing in for every factory, packaging, retail, or safety claim.
Summary
Manufacturing IoT becomes useful when a signal retains its asset and product identity, reaches the system that owns the decision, and produces a recorded result. Collection, context, decision, and execution explain how the motor’s warning becomes a work order, and how a package or shelf event becomes a hold or replenishment task.
Test missed warnings, false stops, physical mounting, communication failures, and staff workflows before claiming value. Compare benefits with integration and ongoing care costs over the same period, keeping uncertainty visible.
Connect each trustworthy signal to an accountable action, then measure what changed in the plant.
Carry the motor’s evidence into Manufacturing IoT: OT Integration Boundaries, where the next chapter begins with those boundaries.
