20 IIoT Operations: Signal Trust and Authority
More
Depth: Practitioner
Progress saves as you read. Mark sections complete as you go; your progress appears in the sidebar.
- Podcast audio coming soon
- Character narration audio coming soon
20.1 The Decision at Stake
A sound measurement does not grant permission to stop a line. This chapter separates signal trust from control authority so that an industrial decision has both evidence and an accountable owner. It builds on IIoT Operations: Trusted Loops, the first part of this three-part sequence.
In the chapter’s car factory, a temperature sensor detects a robot-arm motor reaching 85 degrees instead of 70. A motion sensor notices tiny wobbles; a light sensor still sees correctly painted cars, and a buzzer alerts the repair team. The signals suggest a maintenance problem, but they do not establish who may slow or stop the robot. A stale reading, an idle machine, or a failed calibration could change the conclusion.
Industrial Internet of Things (IIoT) connects measurements to operational decisions in settings where timing, reliability, safety, and evidence matter. A modern automotive factory can house hundreds to thousands of robots and tens of thousands of sensors. Its fastest control decisions happen near the machine. A stopped high-volume line can lose throughput, create scrap, and disrupt downstream work; a responsive cloud dashboard alone cannot establish safe operation.
The problem is to turn these readings into a justified action without giving analytics unreviewed control of the plant. We will first separate the signal, timing, and authority contracts, then trace the services that support them. Downtime economics and the history of Industry 4.0 will help us test whether a proposed transformation delivers an operational result.
KEY CONCEPTS
- Signal trust
Preserve the conditions that make a measurement meaningful.
- Control authority
Name who may act and the safety contract that permits it.
- Service dependencies
Record which supporting services keep the production loop viable.
- Operational evidence
Tie maintenance decisions to a failure mode and a measurable result.
20.2 Learning Objectives
- Assign authority for IIoT signals and control actions.
- Test Industry 4.0 claims against operational evidence.
20.4 Trace the Services Behind the Decision
Once authority is explicit, ask what must remain available for the decision to work.
An IIoT service is a bounded capability with inputs, behaviour, an owner, and an observable result. A useful first cut separates primary services, which directly deliver the production or mission outcome, from secondary services, which enable, protect, observe, or restore that outcome. On a filling line, measuring fill level and stopping or rejecting an incorrectly filled container are primary services. Device identity, time synchronization, diagnostics, historian export, certificate rotation, and software update are secondary services because they support the production loop rather than perform the fill decision themselves.
The labels are about dependency, not importance. A safety interlock or identity service may be secondary to the production function and still be the most critical service in the system. The same capability can also change class across boundaries: location tracking may support maintenance in one plant but become the primary outcome of an asset-tracking product. Classify against a named operational outcome, then draw the dependency direction instead of assigning a permanent label to a technology.
This taxonomy matters when ownership and service levels are agreed. For each primary service, record its trigger, output, decision owner, timing limit, safe failure state, and the secondary services it depends on. For each supporting service, record which primary outcomes degrade when it is late or unavailable, whether the primary loop can continue locally, and who restores it. That service graph exposes a common IIoT mistake: a machine-control loop is described as independent, while its identity, clock, gateway, or configuration path remains an undocumented single point of failure.
20.5 Test the Downtime Case
The service graph explains how a maintenance loop works. Its value still depends on the failure it can prevent. In industrial settings, downtime economics are local: predictive maintenance, using condition evidence to arrange repair before failure, can pay for a sensor program when the failure mode, downtime cost, repair window, and action owner are real. Start with high-cost failure modes and test the evidence behind any efficiency claim.
The automotive example below shows why a single prevented outage can justify a year of sensors. Treat its result as an illustration tied to these assumptions, rather than a guaranteed return for any installation.
Given: Automotive assembly line produces 60 vehicles/hour worth each, operating 20 hours/day.
Illustrative gross production value rate:
For an unplanned 4-hour downtime event:
If vibration sensors ( installed) plus ML analytics (/year) prevent just one such failure per year:
This illustrates why IIoT sensor budgets are easier to justify when they are tied to a specific downtime scenario rather than a vague efficiency claim.
The $8.4M is gross production value at risk, not established profit or cash savings. Calling the 209× result an actual investment return would require evidence that the production loss is avoided and the relevant costs are captured. The stated 20-hour working day gives operating context; the four-hour outage determines this calculation.
20.6 Place Industry 4.0 in Context
The maintenance loop belongs to a longer change in production. Industry 4.0 is the fourth industrial revolution, affecting how products are designed, manufactured, distributed, and maintained. Its shorthand is a factory nervous system and brain: machines sense conditions, communicate status, learn from data, and coordinate decisions instead of only following isolated programmed instructions.
The chapter’s timeline starts with Industry 1.0 (1784), when water and steam power drove machines in place of manual labor. Industry 2.0 (1870) brought electricity and mass production; assembly lines such as Henry Ford’s factories made identical products cheaply. Industry 3.0 (1969) brought computers and automation, including PLCs that ran machines from programs. Industry 4.0 (2011) adds connected machines, prediction, and coordinated decisions: a factory can reorganize work when a machine breaks and use sensor evidence to anticipate problems.
Industrial and consumer IoT differ in typical design priorities. Consumer products emphasize convenience, user experience, and fast release cycles. Industrial systems emphasize safe, reliable operation over long equipment lifetimes, with tight timing budgets and continuous service for years. The comparison spans design focus, timing, reliability, failure consequence, lifecycle, and protocol choices. A consumer fault may cause inconvenience or affect safety and health; an industrial failure can affect safety, cost throughput, create scrap, and disrupt downstream work.
The six rows in Figure 1 compare those priorities side by side.
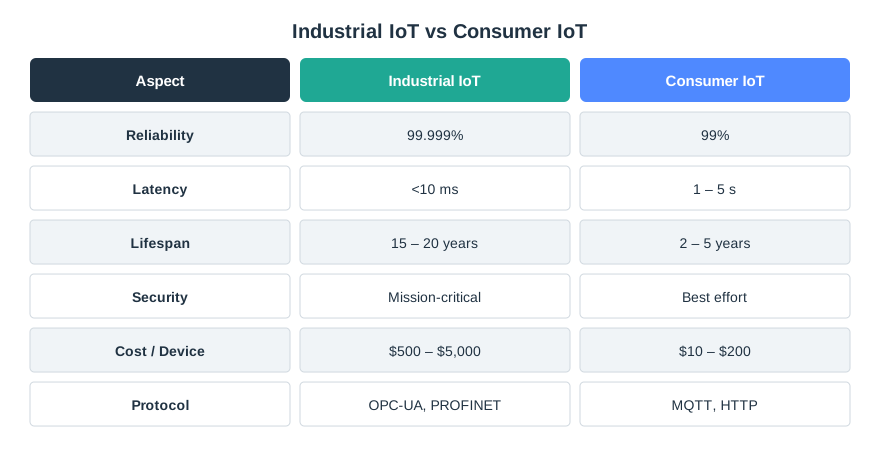
These are typical priorities rather than universal targets. The use case sets the actual requirements: name the plant condition, decision, time limit, safe state, owner, and evidence. Neither robot count nor cloud dashboard response time is a substitute for the robot’s local timing and safe behavior.
The original factory analogy makes that coordination approachable. Sensors act like school hall monitors who report a problem to the principal before it spreads. Temperature Terry’s heat warning and Max’s vibration warning reach Bella’s repair alert while Light Lucy continues checking quality. Remembering past problems can help the factory spot trouble earlier, but that learning still needs the signal and authority contracts established above.
Welcome to ToyMaker Factory, where robots build the world’s best toy cars! But today, something strange was happening…
Thermo the Temperature Sensor was keeping watch on Big Red, the giant robot arm that painted toy cars. “Uh oh, team! Big Red is getting warmer than usual - 85 degrees instead of 70!” Motion Mo the Motion Detector noticed something too: “Big Red is also shaking a tiny bit when she moves. Something’s not right!”
The sensors immediately called for help. Signal Sam the Communication Expert sent a message zooming through the factory’s computer network: “ATTENTION FACTORY BRAIN! Big Red needs help!” Within seconds, the story’s factory computer identified worn motor bearings as the problem.
But here’s the amazing part: instead of waiting for Big Red to break down completely (which would stop ALL the toy cars from being painted!), Power Pete the Battery Manager helped reduce Big Red’s speed just a little bit. Then the factory computer sent a message to order new bearings AND scheduled a repair for next Tuesday during lunch break when the factory was already taking a rest.
Sunny the Light Sensor chimed in from the quality check station: “I’m still checking every toy car with my camera eyes, and they all look perfect! Big Red is still doing great work, just a little slower.” A week later, a repair technician arrived with the new bearings, fixed Big Red in just 30 minutes, and the factory never had to stop at all!
| Word | What It Means |
|---|---|
| Smart Factory | A factory where all the machines have sensors and can talk to each other through computers |
| Predictive Maintenance | When sensors notice small problems early so machines can be fixed BEFORE they break down completely |
| Robot Arm | A machine that can move and grab things, like a human arm, but much stronger and more precise |
| Assembly Line | A row of machines where each one does one job, and the product moves from machine to machine until it’s finished |
| Digital Twin | A computer copy of a real machine that lets engineers test ideas without touching the real thing |
The toy-factory story illustrates predictive maintenance: notice a small problem early enough to arrange a repair before a breakdown. Its automatic diagnosis and speed reduction are story assumptions; in a plant, the evidence and approved authority must support each step. The separate home activity uses a spinning top or fidget spinner and your hand to explore how changes in motion change the vibrations you feel.
20.7 Test the Transformation Claim
With the maintenance loop and its boundaries clear, we can test the claim that connecting sensors alone creates Industry 4.0. A sensor retrofit might log a motor’s temperature to a spreadsheet for a weekly manual check. A coordinated system connects the measurement to analysis, maintenance, parts ordering, and a technician’s work.
That coordination requires vertical integration, from field devices to enterprise resource planning (ERP), and horizontal integration with supply-chain partners. Real-time analytics, machine-learning models, and autonomous decision-making need organizational change, worker upskilling, and appropriate business models alongside the technology. The chapter’s 3–5 year implementation horizon describes a substantial transformation, rather than the time needed for a simple sensor retrofit; it is a planning illustration, not a universal completion rule.
Consider the chapter’s fuller example. An edge gateway collects vibration, temperature, and current at 10 kHz, runs a fast Fourier transform (FFT) locally, and sends features to a cloud machine-learning model trained on 100,000 motors. When estimated remaining useful life (RUL) falls below 14 days, the system schedules maintenance, orders a replacement bearing, and notifies a technician with augmented-reality (AR) repair instructions. Those numbers describe the example’s proposed pipeline; a review must still establish signal quality, suitable timing, and permission for every resulting action.
The change reaches how manufacturing operates, makes decisions, and creates value. It depends on connecting the right services to an accountable result. Xu, Yu, Griffith, and Golmie’s survey supplies a cyber-physical systems perspective on how control, networking, computing, and analytics fit together:
Summary
Signal trust preserves timestamp, asset identity, operating state, unit, quality flag, and model version. The timing budget keeps fast control at the machine while supervisory, execution, and business systems do their appropriate work. Control authority names who may act under an approved safety contract.
Primary services deliver the named production outcome; secondary services enable, protect, observe, or restore it. Their dependencies belong in the operating record. A credible Industry 4.0 case connects those services to a measurable result, with local downtime assumptions and evidence for the action taken.
A trustworthy signal supports a decision; approved authority permits an action. Tie both to a named owner and an operational result before claiming value from the connected factory.
Carry this evidence into IIoT Operations: Legacy Risk and Evidence, which begins with Legacy Integration Risk.
