Chapters

38 Audio Feature Extraction for IoT

analytics-ml
modeling
audio

  1. Data Dora listens beside a small sound sensor as one knock wave and steady fan noise overlap, with the device visibly unsure which event occurred.

    How can the device tell a knock from the fan?

CP-0121 pre-concept hook: How can the device tell a knock from the fan?

38.1 Start With the Story

Picture a small device that must tell a knock from fan noise. It cannot keep or study an endless sound stream with no clear bounds.

First, state what sound matters, how it is cut into short parts, and what result the device may report. Keep the room and sensor setup with the record.

More sound can help a model, but it can also cost power and expose speech. Smaller records save space, yet they may lose a clue the task needs.

That is the simple story, but it does not choose each signal step or model rule. The worked feature path later in the chapter provides that detail.

Use the Practitioner section to build and test the feature record. Use Under the Hood to study noise, change, privacy, and model limits in more depth.

Plain check

  • Name the sound event. Mark its start. Mark its end. Save the room state.
  • Check the sample clock. Check each short frame. Keep the same gain. Note any cut signal.
  • Test quiet sound. Test loud sound. Test a new room. Test a new case.
  • Save the feature steps. Save the label source. Name the model owner. Set the next test.
  • Use Practitioner to build. Use deeper signal checks. Keep raw sound brief. State each limit.

Picture an IoT team using the ideas in Audio Feature Extraction for IoT during a live operations review. A device has produced messy evidence, an analytic step is about to change an alert or control decision, and someone has to explain why the result should be trusted.

Read this page as that path from sensor evidence to accountable action. Start with what the system observes, keep the model or data treatment visible, and finish with the check that would convince an operator, maintainer, or auditor to act.

38.2 Short-Time Audio Features

IoT audio analytics usually starts with a microphone stream, but the model should not be described as if it consumes an unbounded waveform. The stream is divided into short overlapping frames, each frame is transformed into compact features, and a classifier or detector reads a sequence of feature records. The same pattern supports keyword spotting, machine sound monitoring, acoustic occupancy cues, and simple alarm detection.

The feature choice depends on the acoustic task. MFCCs are common for speech-like sounds because they summarize the spectral envelope on a perceptual frequency scale. Log-mel spectrograms are common for small neural networks that learn time-frequency patterns. RMS energy and zero-crossing rate are simpler features that can support activity gates, voice activity checks, or low-cost alarms. None of these features proves an event by itself; labels, background noise, microphone placement, and deployment validation define the claim.

A keyword recognizer adds a training contract to that feature record. Keep the train, validation, and test split; the background-noise set; augmentation rules such as time shifting and background-volume mixing; the batch shape; the loss and optimizer choice; and the early-stopping rule with the model evidence. For a small CNN, the review should be able to trace audio input representation, convolution and pooling, fully connected layers, and inference labels such as target word, silence, and unknown. Multi-task audio models need the same discipline: if one input is used to infer speaker, stress, gender, or environment, each task needs its own label source, metric, and failure boundary instead of borrowing confidence from the shared hidden layers.

If you only need the intuition, this layer is enough: audio feature extraction turns raw samples into a bounded, reviewable feature record. Always keep the frame size, hop size, feature family, label source, acoustic environment, privacy boundary, and retest trigger with the model result.

Worked example: a doorbell classifier using 16 kHz audio with 25 ms frames and a 10 ms hop creates about 98 feature frames per second. If the product later switches to a sealed microphone housing, the feature record should say that the acoustic boundary changed, even if the model file stayed the same.

For a reviewable implementation, separate the signal decision from the model decision. The signal decision says what reaches the feature extractor: sample rate, channels, gain, filtering, clipping policy, frame length, hop length, and any resampling. The model decision says how those records are interpreted: feature family, normalization, label window, confidence threshold, debounce rule, and retest trigger. Keeping those two records separate prevents a later model update from hiding a microphone or firmware change that actually changed the evidence.

Sound-based sensing is broader than asking a smart speaker to transcribe speech. A tabletop or phone-based interface may classify a blow, scratch, tap, or surface-borne vibration as the interaction itself. The raw event is still an acoustic or structure-borne signal; the reviewable evidence is the time-frequency trace, amplitude envelope, gesture segment, placement, and validation set that make the input distinguishable.

That boundary is what keeps examples such as BLUI, Scratch Input, and Surface Link honest. BLUI treats a localized blow as an input gesture. Scratch Input separates line, circle, triangle, square, and multi-part marks by their amplitude profiles. Surface Link compares spectrogram trends from phones resting on the same surface. The claim is not that a microphone heard something; it is that this acoustic path, feature extractor, and placement can distinguish the intended gesture or pairing under tested conditions.

The same pattern appears in activity-recognition prototypes that treat everyday sound and body vibration as sensor evidence. Ubicoustics uses a single trained model to classify acoustic events from spectrogram structure without asking every room or object to be retrained in place. BodyBeat places a microphone near the neck and compares short-time spectra for silence, speech, drinking, coughing, eating, and breathing, so the review question becomes whether the placement and labels cover the activity claim. Ear-worn systems add proximity and gyroscope traces to acoustic or vibration features, separating face touches, drinking, eating, and talking by the joint pattern rather than by one sensor alone.

Some systems deliberately move beyond the ordinary audible band. ViBand-style work uses high-rate wearable vibration or bio-acoustic sensing to capture body-coupled activity cues that a normal low-rate motion pipeline would miss. SoundWave-style interaction sends an ultrasonic tone around 18-22 kHz and listens for the reflected signal; a hand moving near the speaker and microphone changes the received spectrum. For IoT design, the lesson is not to name the demo, but to keep the emitted tone, receiver path, sampling rate, placement, reflected-wave geometry, and privacy boundary with the feature record.

Frames

Short windows such as 20 to 40 ms make sound locally stable enough for spectral analysis. Hop size controls how often new feature records are produced.

Spectral Features

STFT, mel filterbanks, MFCCs, and log-mel spectrograms summarize frequency content rather than storing every waveform sample.

Context

Room acoustics, microphone housing, distance, gain control, and background sounds change the evidence boundary for every audio model.

Privacy

Audio can reveal speech and behavior. Keep raw clips only when the application, consent, retention rule, and review process justify them.
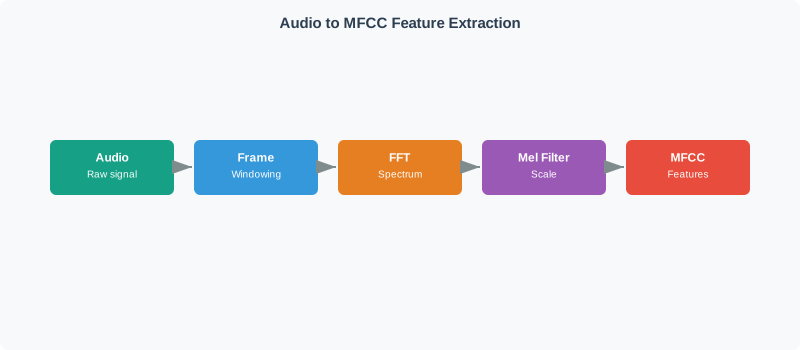
The MFCC pipeline diagram in Figure 38.1 shows where a revealing raw waveform becomes a compact feature record, so it also locates the chapter’s privacy and retention boundary.

Audio moves through capture, windowed frames, FFT power, log-mel filters and DCT into 13 MFCC coefficients. Compact features need a retention decision and are not automatically anonymous.
Figure 38.1: MFCC feature extraction pipeline from audio input to compact feature output

Trace Figure 38.1 from audio through framing and windowing, the frequency spectrum, mel filtering, and the compact coefficient output. Frame and hop sizes determine the time evidence available; spectral and mel stages reshape frequency information; the coefficients preserve a task-oriented envelope rather than a replayable waveform. That reduction can support minimisation, but it is not automatically anonymous. This advances the running narrative: retain raw clips only under an explicit need, consent, access, and deletion rule, and version the exact feature recipe used after deletion.

The feature record is only one of four decisions a keyword recognizer commits to, and the other three are the ones review meetings forget to ask for. Follow the numbered stages in Figure 38.2, reading each stage’s bottom line as the thing that has to exist on paper afterwards.

Four numbered stage cards connected by arrows: audio input representation with 16 kHz mono, a 25 ms frame, a 10 ms hop and 98 frames per second at 13 coefficients; model selection with a small CNN over the fixed 98 by 13 window and classes for target word, silence and unknown; model training with a train, validation and test split, a background-noise set, augmentation and batch 256; and inference with threshold, debounce and cooldown. Each card ends with a Record line, and a closing panel states the frame-length and hop trade-off.
Figure 38.2: Four stages, four records — and one trade-off that no stage name mentions.

In Figure 38.2, AUDIO INPUT REPRESENTATION carries the arithmetic already worked out above: 16 kHz mono at a 25 ms frame and a 10 ms hop, which is 98 frames per second and 1,274 bytes as int8. MODEL SELECTION then fixes what the classifier is allowed to see — a bounded 98 × 13 window rather than an open stream, with silence and unknown as real classes and not leftovers. MODEL TRAINING and INFERENCE each add their own record, and the last of them is the one that decides user-visible behaviour, because threshold, debounce, and cooldown turn a per-frame score into one decision per event. The closing panel is the reason the sequence is worth drawing at all: the frame and hop trade-off is invisible in every stage name, and it lives in the feature record rather than in the model file.

Overview Knowledge Check

The mathematical gist. At 16 kHz, Nyquist limits honest input to 8 kHz. The chapter’s 25 ms frame therefore holds 400 samples, its 10 ms hop holds 160, and the stated schedule produces 98 frames per second. An 18—22 kHz sensing tone does not vanish: it aliases into 2—6 kHz, while 16-bit PCM has a 98.1 dB ideal quantisation ceiling. Sample rate, not a larger buffer, separates the two use cases.

Math Bridge · guided foundationsWhy can a 16 kHz audio pipeline turn ultrasound into an audible feature?Let Data Dora trace frames, Nyquist, aliasing, and bit depth with the chapter's numbers.

38.3 MFCC Feature Record

A practical edge audio pipeline starts with sampling and framing, then computes features before inference. For a speech-like keyword or sound cue, a defensible first pass is mono audio, a fixed sample rate, a frame length near the speech analysis range, a short hop, pre-emphasis or high-pass filtering when justified, a window function, FFT, mel filterbank energies, log compression, and a DCT or retained log-mel representation. The classifier should receive a fixed number of recent frames, not an open-ended stream.

Worked example: 16 kHz mono audio for a small keyword detector
sample rate: 16,000 samples/second
sample width: 16-bit PCM = 2 bytes/sample
frame length: 25 ms
frame samples: 16,000 x 0.025 = 400 samples
hop length: 10 ms
hop samples: 16,000 x 0.010 = 160 samples
raw audio rate: 16,000 x 2 = 32,000 bytes/second

one-second feature window:
frames in first second: floor((16,000 - 400) / 160) + 1 = 98 frames
MFCC coefficients per frame: 13
float feature record: 98 x 13 x 4 = 5,096 bytes
int8 feature record: 98 x 13 = 1,274 bytes

review note:
The arithmetic is only valid for this sample rate, frame size, hop size,
coefficient count, numeric type, and one-second feature window.
Design Item
Practitioner Choice
Review Evidence
Sampling
Choose sample rate and bit depth for the sound band that matters, then keep gain and resampling rules stable.
Record sample rate, bit depth, channel count, microphone placement, gain control, clipping checks, and any resampling.
Features
Use MFCCs for compact speech-like features, log-mel spectrograms for learned time-frequency patterns, and simple energy features for gates.
Record frame length, hop length, window function, number of mel filters, coefficient count, normalization, and numeric type.
Labels
Define event boundaries before training. Include background, unknown, and transition examples rather than forcing every frame into a target class.
Keep label source, annotator instructions, ambiguous examples, and class balance by environment.
Inference
Run the smallest model that meets the application boundary, then apply confidence, debounce, and cooldown rules.
Report confusion by class, false accept and false reject behavior where relevant, latency, memory, compute, and power context.

Practitioner Knowledge Check

Before the derivations, it helps to see how much data each stage actually keeps, because the compression is steeper than the block names suggest. Read Figure 38.3 by bar width: every bar is drawn as wide as the data still being carried at that point.

Five stacked stages for one 25 ms frame, each with a bar whose width matches the data carried: 400 raw samples, still 400 after pre-emphasis and windowing, 201 one-sided FFT power bins, 26 mel band energies, and 13 DCT coefficients. A second card lists the parameters that must travel with the model, and a closing panel states that compact is not anonymous.
Figure 38.3: The frame loses 97% of its numbers before the model ever sees it.

The first two bars of Figure 38.3 are the same width on purpose. Pre-emphasis and window changes the shape of the frame without changing its size, which is why leakage and spectral tilt are corrected here and nowhere later. The reduction begins at the FFT power spectrum, where a 400-point real FFT turns the 400-sample frame into 400/2+1=201400/2+1=201 one-sided bins and discards phase. It becomes severe across the Mel filter bank and log and the DCT, which leave 26 and then 13 numbers. Those 13 are the model’s entire view of 25 milliseconds of sound. The second card is the practical consequence: a record that names only “MFCC” cannot be reproduced, because the FFT length, the mel filter count, and whether coefficient zero was kept all change the numbers without changing the name. And as the closing panel insists, that compression is minimisation, not anonymity.

38.3.1 Pre-emphasis, finite frames, and the window response

The MFCC path begins with a first-order pre-emphasis filter:

y[n]=x[n]αx[n1],0α<1.y[n]=x[n]-\alpha x[n-1], \qquad 0\leq\alpha<1.

Its transfer function and frequency response are

H(z)=1αz1,H(ejω)=1+α22αcosω.H(z)=1-\alpha z^{-1}, \qquad \left|H(e^{j\omega})\right|= \sqrt{1+\alpha^2-2\alpha\cos\omega}.

At DC, the gain is 1α|1-\alpha|; at the Nyquist frequency it is 1+α|1+\alpha|. With α=0.97\alpha=0.97, those gains are 0.03 and 1.97 respectively. The filter therefore suppresses slow/common components relative to rapid changes, partly flattening the downward spectral tilt common in voiced speech and improving numeric use of the later spectrum. It can also emphasize high-frequency sensor noise, so alpha and the decision to use pre-emphasis belong in the feature version rather than being assumed for every machine sound.

Speech and many mechanical sounds are not stationary over a whole recording. The short-time approximation forms frame ii with hop RR and length NN:

xi[n]=x[n+iR]w[n],0n<N.x_i[n]=x[n+iR]w[n],\qquad 0\leq n<N.

At 16 kHz, a 25 ms frame has N=400N=400 samples and a 10 ms hop has R=160R=160, so adjacent frames overlap by 240 samples, or 60%. The frame is short enough that its frequency mixture changes slowly within one analysis record, while the overlap gives an event near one frame edge another analysis window instead of treating each 25 ms block as isolated.

Truncating a waveform with a rectangular window multiplies it sharply in time, which convolves its spectrum with a high-sidelobe sinc-like response and spreads energy into unrelated FFT bins. A Hamming window tapers the endpoints:

w[n]=0.540.46cos(2πnN1).w[n]=0.54-0.46\cos\left(\frac{2\pi n}{N-1}\right).

That taper reduces sidelobes and therefore spectral leakage, at the cost of a wider main lobe and reduced ability to separate very close tones. Window choice is a measurement trade, not decoration: a speech-envelope model often accepts the wider lobe, whereas a narrow machine-fault tone may require a longer frame or a different window.

Three formulas have now been introduced, and each of them does something to the signal that a plot makes obvious in a second. Inspect the three panels of Figure 38.4 in order; the numbers marked on each plot are the ones from this chapter’s own 16 kHz pipeline.

Three stacked panels. The first plots the pre-emphasis magnitude response for alpha 0.97, marked with a gain of 0.03 at DC and 1.97 at the 8 kHz Nyquist frequency. The second shows a speech-like waveform with three overlapping analysis bars, a 25 ms frame and a 10 ms hop marked by a double-headed arrow. The third compares a dashed rectangular window against a Hamming taper falling to 0.08 at both ends.
Figure 38.4: What α\alpha, the hop, and the taper each actually do to the frame.

Panel one of Figure 38.4 is the whole argument for α\alpha: the response climbs from a gain of 0.03 at DC to 1.97 at Nyquist, so slow components are suppressed relative to rapid change — and so is nothing else, which is why the same curve will amplify high-frequency sensor noise on a machine that is not a talker. Panel two makes the overlap concrete: the 25 ms frame bar and its two successors are offset by the 10 ms hop, leaving 240 shared samples, so an event landing near one frame edge is analysed again inside the next. Panel three sets the Hamming taper against the rectangular window drawn as a dashed outline; the taper’s ends fall to 0.08 instead of stopping abruptly, which is what trades sidelobe leakage for a wider main lobe. Read together, the three panels are three measurement decisions, and none of them is recoverable from a model file that only says “MFCC”.

38.3.2 Normalized spectrum and mel filter bank

For each windowed frame, compute an NN-point discrete Fourier transform

Xi[k]=n=0N1xi[n]ej2πkn/N.X_i[k]=\sum_{n=0}^{N-1}x_i[n]e^{-j2\pi kn/N}.

One common normalized power-spectrum convention is

Pi[k]=Xi[k]2N.P_i[k]=\frac{|X_i[k]|^2}{N}.

Libraries also use 1/N21/N^2, one-sided energy doubling, or window-energy normalization. Those conventions change feature magnitudes even when the waveform is identical, so record the FFT length, one- or two-sided spectrum, and normalization rule with the model.

The mel mapping compresses high physical frequencies:

m(f)=2595log10(1+f700),f(m)=700(10m/25951).m(f)=2595\log_{10}\left(1+\frac{f}{700}\right), \qquad f(m)=700\left(10^{m/2595}-1\right).

For example, 1,000 Hz maps to about 1,000 mel, while 8,000 Hz maps to about 2,835 mel. Equal spacing in mel therefore puts filter centers close together at low frequency and farther apart in hertz at high frequency.

Build MM triangular filters step by step:

  1. Choose fminf_{min} and fmaxfs/2f_{max}\leq f_s/2, map both to mel, and place M+2M+2 equally spaced points between them.
  2. Convert those points back to hertz and then to FFT-bin locations, for example bm=(N+1)fm/fsb_m=\left\lfloor(N+1)f_m/f_s\right\rfloor.
  3. For filter mm, rise linearly from zero at bm1b_{m-1} to one at bmb_m, then fall to zero at bm+1b_{m+1}.
  4. Sum the power under each triangle:
Ei,m=kPi[k]Hm[k].E_{i,m}=\sum_k P_i[k]H_m[k].
  1. Apply log(Ei,m+ϵ)\log(E_{i,m}+\epsilon) to turn multiplicative spectral changes into additive differences and prevent a zero-energy logarithm.
  2. Apply the discrete cosine transform to decorrelate the log-filter energies:
ci,r=m=1Mlog(Ei,m+ϵ)cos[πrM(m12)].c_{i,r}=\sum_{m=1}^{M}\log(E_{i,m}+\epsilon) \cos\left[\frac{\pi r}{M}\left(m-\frac12\right)\right].

Retaining the lower-order ci,rc_{i,r} coefficients gives the compact MFCC record; higher orders mostly describe finer variations across the filter-bank envelope. Record whether coefficient zero is kept, whether liftering is applied, and whether per-channel or dataset normalization follows. A model trained with 40 filters, one normalization rule, and 13 retained coefficients cannot safely consume features produced by an undocumented “equivalent” pipeline.

The mel scale is usually described as “perceptual”, which is true and unhelpful when you are choosing a filter count. Figure 38.5 runs one frame through all three steps so the warping shows up as geometry rather than as an adjective.

MFCC panels move from a power spectrum through hertz-to-mel conversion to triangular filters. One frame becomes filter energies, then log and DCT produce a compact record.
Figure 38.5: Equal spacing in mel is deeply unequal spacing in hertz.

Panel one of Figure 38.5 is the frame as the FFT leaves it: 201 one-sided bins at 16,000/400=4016{,}000/400=40 Hz spacing, with most of the energy in the low resonances and very little above 6 kHz. Panel two explains why that distribution is about to be treated unevenly — 1,000 Hz = 1,000 mel but 8,000 Hz = 2,835 mel, so the upper half of the audible range is compressed into roughly a third of the mel axis. Panel three shows what that does to the filters: the labelled centre frequencies bunch together below 1 kHz and stretch apart above 4 kHz, and the bars beneath convert those triangles into ten band energies on an evenly spaced index. That last move is the one worth naming in a review, because from the model’s side the uneven hertz axis is gone: it sees band 1 through band 10, and any narrow tone that fell inside a wide upper triangle has already been merged with its neighbours.

Those coefficients then have to be turned into a trained model, and the loop that does it is where the acoustic assumptions are quietly baked in. Work through Figure 38.6 from the top of the batch loop to the four heads at the bottom.

Upper card: a training loop where a random index leads to loading audio samples, augmenting the clip and extracting a 98 by 13 MFCC record, while a parallel branch selects background noise with a random time shift and volume and feeds the augmentation step. The batch of 256 goes to a cross-entropy loss and an Adam or SGD update, with an arrow looping back and a note to repeat about 500 steps or stop early. Lower card: one audio window enters shared hidden layers that fan out to keyword, speaker, stress and environment heads.
Figure 38.6: Where augmentation belongs, and why four heads cannot share one confidence.

Note where Augment the clip sits in Figure 38.6: before Extract MFCC 98 x 13, never after. Background noise, time shift, and volume are applied to audio, so the features the model trains on are produced by the same path that will run on the device — augmenting the coefficients instead would train the model on records the field can never generate. The loop then closes through Cross-entropy loss and Adam or SGD update and repeats, which is why the split and the background-noise set are part of the model’s evidence rather than a preprocessing footnote. The lower card carries the discipline that multi-task audio work most often skips: shared hidden layers may serve keyword, speaker, stress, and environment at once, but each head needs its own label source, its own metric, and its own stated failure boundary. A trunk that is well validated for keyword detection has proved nothing about the speaker head hanging off the same layers.

38.4 Audio Evidence Under Change

Audio feature pipelines are sensitive to changes that may look minor in a diagram. A new microphone housing can attenuate high frequencies. Automatic gain control can alter energy features. A factory floor can add tonal noise that was absent in the lab. A model trained on clean speech can treat ventilation, echoes, or nearby talkers as target-like evidence. The deployment should expose these boundaries rather than presenting a single average metric as universal.

The brittle point is that audio features are not raw facts; they are measurements made under assumptions. A 25 ms frame improves short-time stationarity, but it smears events shorter than the frame. A mel scale emphasizes perceptual bands, but a machine-fault detector may care about narrow tones that speech-oriented settings compress away. Mean-variance normalization can stabilize one microphone placement while masking a gain or enclosure change. Treat each transform as a review choice with a reason, not as an automatic recipe.

The speech-coding history behind those choices matters. Harvey Fletcher's equal-loudness and critical-band work showed that human hearing is not a flat frequency meter: audibility depends on frequency, sound-pressure level, and nearby masking bands. Telephone systems therefore narrowed ordinary voice service to the range needed for intelligible speech, while later codecs and MFCC-style features use perceptual scales, filterbanks, and compression to preserve decision-relevant evidence instead of every waveform detail. For IoT audio, that is useful only when the product claim is speech-like or human-auditory; a machine-fault detector may need narrow tones that a speech-oriented representation would hide.

A perceptual audio coder makes that boundary concrete. It sends audio through a coding filterbank, uses a perceptual model to estimate what a nearby louder masker will hide, allocates quantization and rate control so the added error stays under the masking threshold, then packs the coded bitstream. Linear predictive coding, associated with Bishnu Atal's speech work, takes a different speech-specific route: it models the vocal tract as a filter excited by voiced pulse trains or unvoiced noise. These are useful precedents for compact edge features, but they also warn reviewers not to let a speech or human-hearing model discard evidence needed for a non-speech IoT event.

STFT Boundary

The FFT sees only the current frame. Window choice, frame length, and overlap trade time resolution against frequency resolution.

Mel and MFCC Boundary

Mel filters and cepstral coefficients compress spectral shape. This can help small models, but it can also discard details needed for some non-speech events.

Quantization Boundary

Feature tensors and models may be quantized for edge inference. Validate after conversion because thresholds and minority classes can shift.

Retention Boundary

Raw audio, derived features, and event labels carry different privacy risks. Retention policy should match the smallest evidence needed for review.

Boundary
Failure Mode
Retest Trigger
Acoustic scene
Background machinery, wind, reverberation, distance, or competing speakers changes the feature distribution.
New room, enclosure, mount, operating mode, microphone supplier, or background sound profile.
Signal chain
Gain control, filtering, clipping, resampling, or firmware changes alter the frame before feature extraction.
New firmware, audio driver, microphone gain, sample rate, codec, filter, or clipping rate.
Label boundary
Event start and end times are ambiguous, so frame labels are shifted or overconfident.
New annotator instructions, new event classes, more unknown/background examples, or different labeling granularity.
Model boundary
Compression, thresholds, smoothing, or cooldown logic changes false accepts, false rejects, and latency.
New model family, quantization mode, confidence threshold, debounce rule, or target device.

A practical retest plan therefore has two loops. The fast loop runs on-device sanity checks: clipping rate, background energy, missing frames, confidence distribution, and latency. The slower loop samples hard cases for human review without storing broad raw-audio history by default. For privacy-sensitive products, store derived features or short consented clips only when they are needed to explain a model decision. For safety-sensitive products, keep enough evidence to reproduce false accepts and false rejects when the acoustic scene changes.

Under-the-Hood Knowledge Check

38.5 FFT And MFCC Parameter Explorer

An FFT size is an evidence choice, not a quality slider. At sample rate fsf_s, an NN-sample frame spans N/fsN/f_s seconds and its bin spacing is fs/Nf_s/N. Longer frames separate closer steady tones but blur short events. Overlap reduces the hop between decisions and increases compute; it does not create new independent samples. A window reduces edge discontinuities at the cost of widening the response around a tone.

The final row is a small leakage probe, not a specification for a window: it evaluates the selected tone at the nearest bin and its two neighbors. Sweep the tone between bin centers and compare windows. Then choose the shortest frame that still separates the task’s relevant frequencies, measure compute and latency on the target, and keep the choice with the model record.

MFCCs add another bounded sequence: optional pre-emphasis, windowed spectrum, Mel-spaced filterbank energies, logarithm, and a discrete cosine transform. Record sample rate, frame, hop, window, filter count, coefficient count, normalization, and implementation version. Speech defaults are only a starting hypothesis for machinery, wildlife, or occupancy audio; validate that the compressed representation retains the events the IoT decision actually needs.

38.6 Summary

Audio feature extraction makes IoT audio reviewable by converting a continuous waveform into short-time feature records. The durable pattern is to preserve the sampling, frame, hop, feature, label, privacy, and deployment evidence with the classifier result. MFCCs, log-mel spectrograms, RMS energy, and zero-crossing rate are useful only when their assumptions match the target sound and acoustic environment.

Key Takeaway

An audio model claim is not just a model name or an average metric. It is a feature pipeline plus a documented acoustic boundary: sample rate, frames, hops, labels, environment, device signal chain, privacy rule, and retest trigger.

38.7 See Also

Feature Engineering for ML

Connect audio windows to general feature records, normalization, and reviewable model inputs.

IoT Machine Learning Pipeline

Place audio collection, labeling, training, deployment, and monitoring in the full ML workflow.

Edge ML and TinyML Deployment

Review quantization, memory, latency, power, and on-device inference constraints.

Anomaly Detection for IoT Systems

Compare event detection with anomaly detection for machines, environments, and operations.
