18 Kalman Filters for Sensor Fusion
18.1 Start With the Story
Picture an IoT team using the ideas in Kalman Filters for Sensor Fusion during a live operations review. A device has produced messy evidence, an analytic step is about to change an alert or control decision, and someone has to explain why the result should be trusted.
Read this page as that path from sensor evidence to accountable action. Start with what the system observes, keep the model or data treatment visible, and finish with the check that would convince an operator, maintainer, or auditor to act.
18.2 Kalman Filters Maintain Belief
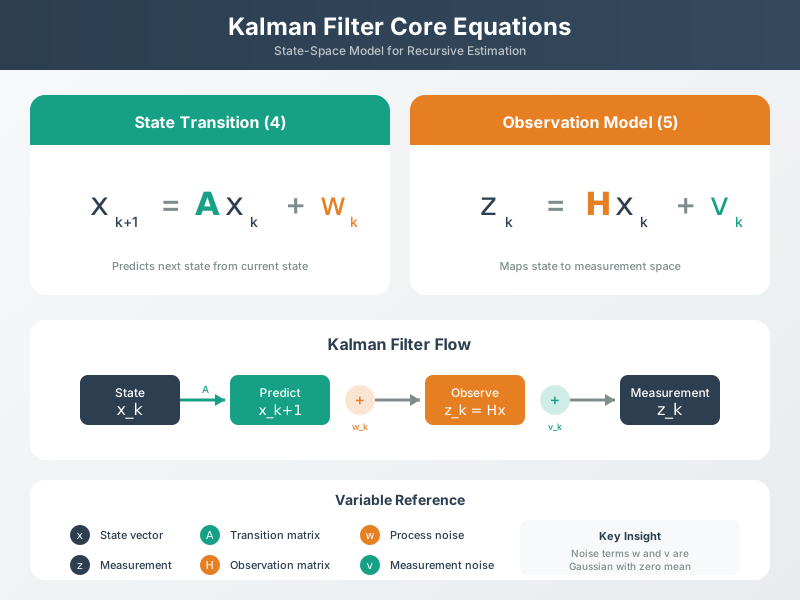
A Kalman filter is a state estimator for systems that can be described with a model, measurements, and uncertainty. The filter keeps two things together: a best estimate of the state and a covariance that describes the uncertainty in that estimate. It predicts the next state from the model, then corrects that prediction when a measurement arrives.
For IoT sensor fusion, the important idea is not that the output is smooth. The important idea is that every fused estimate carries its uncertainty and update evidence. A temperature estimate, location estimate, or velocity estimate should record the state vector, time step, process noise, measurement noise, innovation, Kalman gain, accepted/rejected measurements, and degraded-mode status.
If the model is linear and the noise assumptions are reasonable, a Kalman filter gives a principled way to balance prediction and measurement. If those assumptions are weak, the filter still needs validation gates and review evidence.
The state vector is the contract between the physics and the software. A simple tracking filter might estimate position and velocity; a building filter might estimate temperature plus a slowly changing sensor bias. The transition model says how that state should move between samples. The observation model says how a sensor reading relates to the hidden state. Those two models are separate on purpose: a sensor may measure only one part of the state, and the filter still uses the model to carry the unmeasured parts forward.
Noise terms make the estimate reviewable instead of magical. Process noise says how much the model can be wrong between updates; measurement noise says how much the sensor can be wrong when it reports. The filter should publish those assumptions with the fused output or at least preserve them in the audit record, because changing Q or R can change whether the same measurement is accepted, rejected, or only partly trusted.
State
The hidden variables being estimated, such as temperature, position, velocity, or bias.
Covariance
The uncertainty attached to the current state estimate and relationships between state dimensions.
Prediction
The model-based step that advances the state and usually increases uncertainty.
Correction
The measurement update that uses innovation and gain to adjust the state and reduce uncertainty.
Overview Knowledge Check
18.3 Tune Prediction vs Measurement
In the scalar case, the Kalman gain shows the trust balance directly. A high gain means the measurement pulls the estimate strongly. A low gain means the model prediction dominates. Process noise Q controls how much uncertainty is added during prediction; measurement noise R controls how much the filter trusts the sensor. Both should be based on observed behavior and retested after sensor, firmware, sampling, or deployment changes.
Worked example: one scalar temperature update
previous estimate x: 20.0 deg C
previous variance P: 0.50
process noise Q: 0.10
measurement z: 21.2 deg C
measurement variance R: 0.40
state model F: 1
measurement model H: 1

predict:
x_pred = 20.0
P_pred = P + Q = 0.50 + 0.10 = 0.60

innovation:
y = z - x_pred = 21.2 - 20.0 = 1.2 deg C
S = P_pred + R = 0.60 + 0.40 = 1.00

Kalman gain:
K = P_pred / S = 0.60 / 1.00 = 0.60

update:
x_new = x_pred + K * y = 20.0 + 0.60 * 1.2 = 20.72 deg C
P_new = (1 - K) * P_pred = 0.40 * 0.60 = 0.24

Interpretation:
The estimate moves toward the measurement but does not copy it.
The variance drops from 0.60 predicted to 0.24 after the measurement update.
Practitioner Knowledge Check
18.4 Innovation Gating Protects Estimates
The innovation is the difference between what the sensor reports and what the filter predicted the sensor should report. Large innovations can be real changes, bad tuning, stale timestamps, miscalibration, sensor faults, or a model that no longer fits the operating mode. Production filters should treat the innovation as evidence, not just a number inside the update equation.
A common scalar gate compares the innovation squared with its expected variance. If the normalized innovation is too large, the system can reject the measurement, downweight it, publish a degraded mode, or trigger a sensor-health review. This connects Kalman filtering to the broader fusion contract: accepted and rejected inputs must be visible.
Covariance is also a design surface, not just a matrix in the code. If a sensor becomes stale, the predicted covariance should usually grow because the state is less certain. If two measurements share a calibration source, the filter should not treat them as fully independent evidence. If an innovation gate rejects several readings in a row, the output record should show whether the system is holding the model prediction, using a fallback sensor, or stopping an action because observability is weak.
Residual review closes the loop. Engineers can plot innovations over time and compare them with the assumed noise model. Persistent positive residuals can reveal bias; residuals that spike after firmware or enclosure changes can reveal a timing or calibration problem; residuals that are always smaller than expected can indicate overestimated noise. That review evidence is what keeps Q, R, gates, and covariance from becoming untested constants.
Worked example: normalized innovation gate
predicted state: 12.0 m
predicted variance P: 0.64
measurement z: 14.0 m
measurement variance R: 0.36

innovation:
y = z - prediction = 14.0 - 12.0 = 2.0 m

innovation variance:
S = P + R = 0.64 + 0.36 = 1.00

normalized innovation squared:
NIS = y^2 / S = 4.0 / 1.00 = 4.0

decision example:
If the configured one-dimensional gate is 3.84, this measurement is outside
the gate. Quarantine it, publish the predicted state with degraded evidence,
and record the rejection reason for review.
Innovation
Measurement minus predicted measurement; the first signal that model and sensor disagree.
Gate
A plausibility rule that prevents a single suspect reading from corrupting the fused state.
Retest
Required after tuning changes, sensor replacement, firmware updates, or changed operating modes.
Fallback
Degraded-state publishing, last-good hold, alternate sensor use, or actuation stop when observability is weak.
Under-the-Hood Knowledge Check
18.5 Summary
Kalman filters combine a predictive model with measurements while carrying uncertainty through every step. The prediction step advances the state and increases uncertainty with process noise. The update step compares the measurement with the prediction, computes an innovation and gain, adjusts the state, and reduces uncertainty when the measurement is accepted. Practical IoT use requires explicit Q/R tuning evidence, timestamp alignment, calibration checks, innovation gates, rejected-input records, degraded modes, and retest triggers.
A Kalman filter is trustworthy only when the fused state, covariance, tuning assumptions, innovation evidence, accepted or rejected measurements, and fallback behavior are visible together.
18.6 See Also
Fusion Architectures
Place Kalman state estimates within centralised, hierarchical, or distributed fusion patterns.
Fusion Best Practices
Use calibration, time alignment, gates, and degraded modes around the estimator.
Particle Filters
Compare Kalman assumptions with sampling-based filters for nonlinear or non-Gaussian states.
Complementary IMU Fusion
Contrast covariance-based correction with lightweight embedded orientation fusion.