19 Particle Filters for Localization
19.1 Start With the Story
Picture an IoT team using the ideas in Particle Filters for Localization during a live operations review. A device has produced messy evidence, an analytic step is about to change an alert or control decision, and someone has to explain why the result should be trusted.
Read this page as that path from sensor evidence to accountable action. Start with what the system observes, keep the model or data treatment visible, and finish with the check that would convince an operator, maintainer, or auditor to act.
19.2 Particle Filters Track States
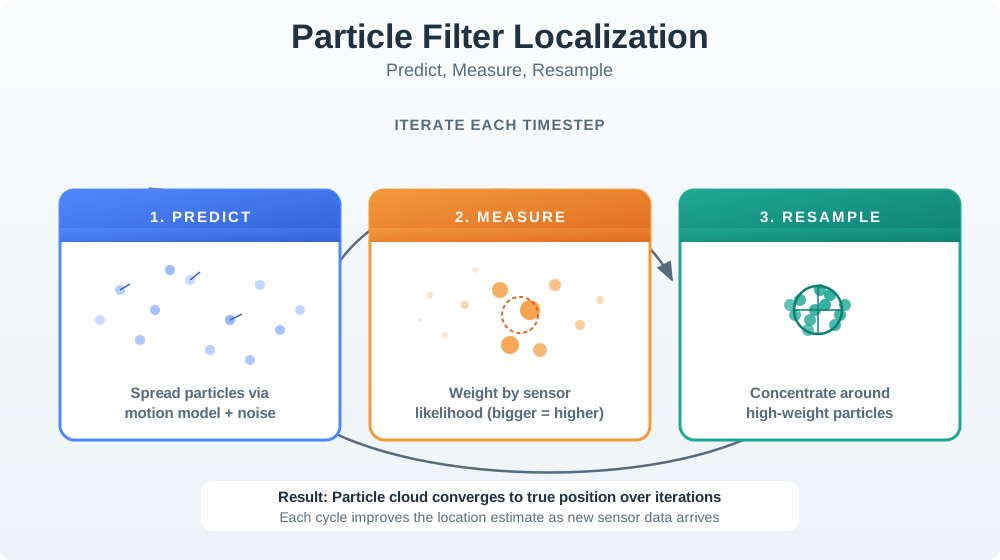
A particle filter is a sequential Monte Carlo estimator. Instead of forcing the state belief into one Gaussian mean and covariance, it carries many particles. Each particle is a possible state, such as a device location, robot pose, or user trajectory, with a weight that says how well that hypothesis explains recent sensor evidence.
This matters when an IoT state is nonlinear, constrained, or non-Gaussian. A person may be equally likely to be near two corridors until a new BLE beacon reading arrives. A robot cannot pass through a wall even if the motion model says the straight-line path is short. A noisy radio fingerprint can create several plausible positions instead of one symmetric uncertainty ellipse.
Choose a particle filter when the belief shape matters. If one compact Gaussian is honest enough, a Kalman-style estimator is usually cheaper. If the belief can be multimodal, sharply bounded by maps, or driven by nonlinear likelihoods, particles preserve evidence that a single mean can hide.
Particle
One hypothesis about the hidden state, such as x-y floor position, heading, speed, or sensor bias.
Weight
A relative score based on how likely the latest measurement is if that particle were the true state.
Resampling
A step that copies high-weight particles and removes low-weight particles so compute stays focused.
Estimate
A weighted mean, highest-weight state, confidence region, or set of modes published with evidence.
Overview Knowledge Check
19.3 Predict, Weight, Resample
The common bootstrap particle filter has four operating steps. Predict each particle forward with the motion model and process noise. Weight each predicted particle using the sensor likelihood model. Normalize the weights so they sum to one. Resample when the particle set has collapsed too far onto a few hypotheses.
The likelihood model is the engineering contract. For a range sensor it may be a Gaussian error model around distance. For BLE localization it may compare observed RSSI against a fingerprint map. For a map-aware robot it may assign near-zero likelihood to poses that imply the robot crossed a wall. Those choices should be versioned and tested, because they decide which particles survive.
Worked example: one-dimensional location update
measurement z: 10.0 m
sensor sigma: 1.0 m
predicted particles x_i: 8.8, 9.5, 10.2, 11.0, 12.0 m
relative likelihood: exp(-0.5 * error^2 / sigma^2)

particle  error  likelihood  normalized weight
8.8 m     -1.2   0.487       0.158
9.5 m     -0.5   0.882       0.285
10.2 m     0.2   0.980       0.317
11.0 m     1.0   0.607       0.196
12.0 m     2.0   0.135       0.044

sum of likelihoods = 3.091
weighted estimate =
8.8*0.158 + 9.5*0.285 + 10.2*0.317 + 11.0*0.196 + 12.0*0.044
= about 10.02 m

Interpretation:
The particles near the 10.0 m measurement dominate the estimate.
The 12.0 m particle is not impossible, but it contributes little evidence.
Practitioner Knowledge Check
19.4 Degeneracy and Compute Limits
A particle filter usually fails in one of two ways. Degeneracy happens when nearly all probability mass sits on a few particles, so most compute is wasted. Particle impoverishment happens after repeated resampling when the surviving particles become too similar, so the filter stops representing uncertainty. Both problems are operational, not just mathematical.
Effective sample size is a practical monitor for degeneracy: ESS = 1 / sum(w_i^2). If all particles have equal weight, ESS is close to the particle count. If one particle dominates, ESS approaches one. Many systems resample only when ESS falls below a threshold, then inject process noise so the population can keep exploring plausible states.
Worked example: resampling trigger
particle count N: 5
normalized weights: 0.62, 0.18, 0.10, 0.06, 0.04

ESS = 1 / (0.62^2 + 0.18^2 + 0.10^2 + 0.06^2 + 0.04^2)
ESS = 1 / 0.432
ESS = 2.31 particles

example threshold: 0.5 * N = 2.5
decision: ESS is below threshold, so resample.

Operational note:
After resampling, copy high-weight particles more often, drop weak particles,
then add realistic motion noise. Without noise, the copied particles can become
identical and the filter may not recover when the next measurement contradicts them.
Proposal Distribution
The rule used to draw candidate particles. A bootstrap filter uses the motion model; stronger proposals can use the latest measurement too.
Systematic Resampling
A common low-variance resampling method that spreads copies according to cumulative particle weights.
Latency Budget
Particle count, likelihood cost, and update rate must fit the edge gateway, robot, or phone that runs the filter.
Review Evidence
Published estimates should include particle count, ESS, resampling count, sensor age, rejected evidence, and confidence mode.
Under-the-Hood Knowledge Check
19.5 Summary
Particle filters estimate nonlinear or non-Gaussian IoT states by carrying many weighted hypotheses. Each update predicts particles with a motion model, weights them with a sensor likelihood model, normalizes the weights, and resamples when effective sample size shows degeneracy. They are useful for indoor localization, robot pose tracking, and intermittent asset tracking, but they require explicit evidence about particle count, likelihood assumptions, resampling, stale measurements, alternate modes, and compute latency.
A particle filter is trustworthy when it preserves the competing hypotheses, not just the final mean: publish the estimate with weights, ESS, resampling state, sensor freshness, and confidence limits.
19.6 See Also
Kalman Filters
Compare particle filtering with covariance-based state estimation for linear or near-Gaussian systems.
Fusion Architectures
Place particle filters within centralised, hierarchical, or edge gateway fusion designs.
Fusion Best Practices
Connect likelihood models, calibration, stale-data handling, and degraded modes to deployment review.
Fusion Applications
Review practical tracking, localization, and situational-awareness examples that need fusion evidence.