4 Electromagnetic Waves and Antennas
electromagnetic waves for IoT, IoT spectrum basics, frequency wavelength relationship, RF path loss fundamentals, antenna wavelength basics
4.1 Start With the Wireless Story
Every wireless decision begins with a wave leaving an antenna and losing strength as it travels. Keep that physical story visible: frequency shapes wavelength, antennas shape direction, obstacles shape loss, and dB arithmetic decides whether the receiver can still hear the device.
4.2 In 60 Seconds
Wireless IoT works because antennas convert electrical signals into electromagnetic waves and receivers convert those waves back into electrical signals. The basic relationship is:
wave speed = frequency x wavelengthIn air, the wave speed is close to the speed of light. Higher frequency means shorter wavelength. Lower frequency means longer wavelength. This single relationship influences antenna size, path loss, obstacle behavior, spectrum allocation, and the trade-off between range and bandwidth.

Phoebe’s Why
A radio wave is an electric-and-magnetic oscillation travelling at the speed of light, \(c\). In the time one cycle takes, the wave front moves forward exactly one wavelength – wavelength is literally the distance one cycle covers. Run \(f\) cycles every second and the wave advances \(f \times \lambda\) metres per second, and that speed must equal \(c\). So frequency and wavelength are locked together: choose one and the other is fixed. The same length scale sets the antenna. A straight element resonates when its length is a convenient fraction of \(\lambda\) – a quarter or half wave – because then the current sloshing along the metal stays in step with the wave it launches. That is why antenna size tracks the band, not the protocol name.
The Derivation
The speed lock:
\[\lambda = \frac{c}{f}\]
An isotropic transmitter spreads its power \(P_t\) evenly over a sphere of radius \(d\), so the power density at the receiver is
\[S = \frac{P_t}{4\pi d^2}\]
An ideal isotropic receive antenna collects energy over an effective aperture set by wavelength:
\[A_e = \frac{\lambda^2}{4\pi}\]
Received power is density times aperture:
\[P_r = S\,A_e\]
\[P_r = P_t\left(\frac{\lambda}{4\pi d}\right)^2\]
Free-space path loss is the transmit-to-receive power ratio:
\[\mathrm{FSPL} = \left(\frac{4\pi d}{\lambda}\right)^2\]
Worked Numbers: IoT Bands
- 2.4 GHz: \(\lambda = 3.00\times10^{8}/2.4\times10^{9}\) \(= 0.125\) m – the 12.5 cm quoted above; quarter-wave element \(= 0.125/4\) \(= 0.03125\) m \(\approx 31.2\) mm
- 868 MHz: \(\lambda = 0.3456\) m \(\approx 0.346\) m; quarter-wave \(\approx 86.4\) mm
- FSPL at 100 m, 2.4 GHz: \(4\pi d/\lambda\) \(= 4\pi(100)/0.125\) \(= 10053\); in dB, \(20\log_{10}(10053)\) \(= 80.0\) dB
- Split-form check (\(d\) in m, \(f\) in Hz): \(20\log_{10}d + 20\log_{10}f - 147.55\) \(= 40 + 187.60 - 147.55\) \(= 80.05\) – the same 80.0 dB
An 80 dB loss means the receiver collects about one part in \(10^{8}\) of the transmitted power, so a \(+10\) dBm transmitter arrives near \(-70\) dBm – still about 20 dB above a typical \(-90\) dBm receiver sensitivity. Real paths then add wall, obstruction, and multipath losses on top of this free-space floor, so the remaining margin must be confirmed by measurement.
The practical lesson is not that one frequency is universally best. The practical lesson is that each wireless design needs evidence for its frequency choice, antenna placement, path-loss margin, interference environment, and regulatory band.
4.3 Learning Objectives
By the end of this chapter, you will be able to:
- explain how frequency, wavelength, wave speed, and antenna size are related
- distinguish RF propagation evidence from theoretical free-space calculations
- compare sub-GHz, 2.4 GHz, 5 GHz, and higher-frequency bands at a design level
- use dB reasoning without mixing linear and logarithmic units
- identify why polarization, Fresnel clearance, obstacles, and multipath affect IoT links
- build a review record for an RF fundamentals claim
4.4 Why EM Waves Matter In IoT
Most IoT connectivity choices eventually become radio choices. A sensor may use Wi-Fi, BLE, Zigbee, Thread, LoRaWAN, NB-IoT, LTE-M, UWB, RFID, NFC, or a proprietary radio. Each option uses electromagnetic waves differently, but the review questions are similar:
- What frequency band is used?
- What wavelength does that imply?
- Can the antenna fit and perform in the enclosure?
- How much path loss and obstruction loss can the link tolerate?
- Is the band licensed, unlicensed, or shared?
- What interference and coexistence conditions exist?
- What field evidence proves that the link works at the installed location?
The physics is not a substitute for field testing, but it prevents obviously weak radio decisions.
4.5 Wave Relationship
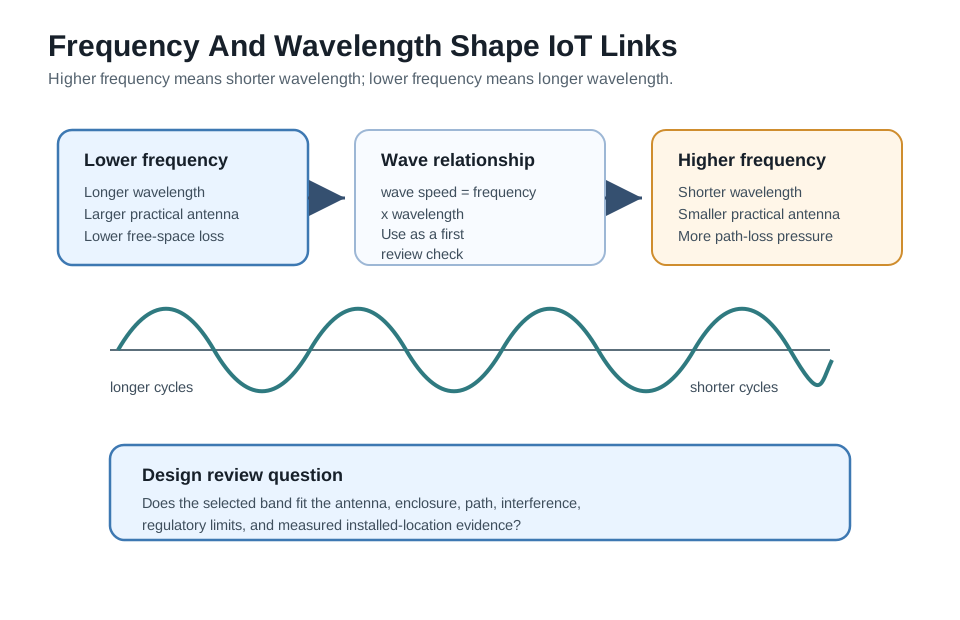
Use Figure 4.1 to keep the basic relationship visible during design review. Frequency, wavelength, antenna dimensions, and free-space path loss move together. A small device can make a high-frequency antenna easier to package, but that does not automatically make the link easier to close.
4.6 Frequency And Wavelength
Electromagnetic waves can be described by frequency and wavelength:
- frequency: how many wave cycles occur per second
- wavelength: the physical distance between equivalent points on the wave
- wave speed: the speed at which the wave propagates through the medium
For radio in air, a useful engineering shortcut is:
wavelength in centimeters is approximately 30 / frequency in GHzThat means a 2.4 GHz signal has a wavelength of about 12.5 cm. A sub-GHz signal has a longer wavelength. A 5 GHz signal has a shorter wavelength. These are approximate values, but they are good enough to reason about antenna size, form factor, and obstacle scale before doing detailed design.
4.7 Antenna Size And Enclosure Reality
Antennas do not need to be exactly one wavelength long, but wavelength strongly influences practical antenna size. Quarter-wave elements, chip antennas, PCB antennas, matching networks, ground planes, feed lines, and enclosure materials all affect the result.
Review questions:
- Is the antenna sized and tuned for the intended frequency band?
- Does the enclosure, battery, hand, wall, pole, or machine body detune the antenna?
- Is there enough ground plane or counterpoise for the selected antenna type?
- Is the device orientation predictable or variable?
- Was antenna performance measured in the final enclosure, not only on a development board?
A data sheet antenna result is not enough if the final product packaging changes the RF environment.
4.8 Spectrum Regions Used By IoT
IoT systems usually use radio and microwave regions of the electromagnetic spectrum. Visible light, infrared, and optical wireless communication can also be useful in specific line-of-sight systems, but general IoT coverage usually depends on radio because radio waves can diffract, reflect, and penetrate some materials.
Common design-level groupings are:
- sub-GHz bands for longer range, larger antennas, and lower data-rate links
- 2.4 GHz for globally common short-range radios such as Wi-Fi, BLE, Zigbee, and Thread
- 5 GHz and 6 GHz Wi-Fi bands for higher local throughput and shorter practical range
- cellular bands that vary by operator, country, and technology generation
- UWB and mmWave-style systems for specialized short-range ranging, sensing, or high-throughput links
- optical and infrared systems for line-of-sight or room-confined communication
Two practical spectrum reminders keep the classroom diagram tied to deployment evidence. The atmosphere does not pass every band equally: radio, microwave, visible, and selected infrared windows can support terrestrial links, while many infrared, ultraviolet, X-ray, and gamma regions are absorbed before they become ordinary IoT communication paths. Infrared is also a broad region. Near infrared behaves closer to visible light and supports line-of-sight controls or short optical links; far infrared is associated with thermal emission from warm objects such as radiators, sunlit pavement, and heated enclosures. Record which region the design uses before treating “infrared” or “optical” as one technology.
The review should name the actual band and region, not just the marketing name of the protocol.
4.9 Path Loss Is Not The Whole Channel
Free-space path loss is a useful first check because it shows how signal strength falls with distance and frequency in an unobstructed path. It is not a complete deployment model.
Real IoT links also include:
- walls, floors, soil, vegetation, people, vehicles, and machinery
- antenna gain and antenna loss
- polarization mismatch
- cable and connector loss
- multipath fading and reflections
- noise floor and receiver sensitivity
- interference from nearby systems
- duty-cycle, transmit-power, and channel-access limits
- retry behavior and device sleep state
Use free-space path loss to catch weak assumptions, then use site measurements to approve the design.
4.10 dB Reasoning
Radio engineers use decibels because link budgets involve large ratios. A dB value is logarithmic, so do not mix it with linear watts or milliwatts casually.
Useful review reminders:
- adding dB values corresponds to multiplying ratios
- dBm is an absolute power level relative to one milliwatt
- dBi describes antenna gain relative to an ideal isotropic antenna
- link margin is the amount of signal budget remaining after expected losses
- a small-looking dB change can represent a large power ratio
For chapter review, it is better to record the assumptions and measured margin than to memorize many formulas.
4.11 Propagation Evidence Map
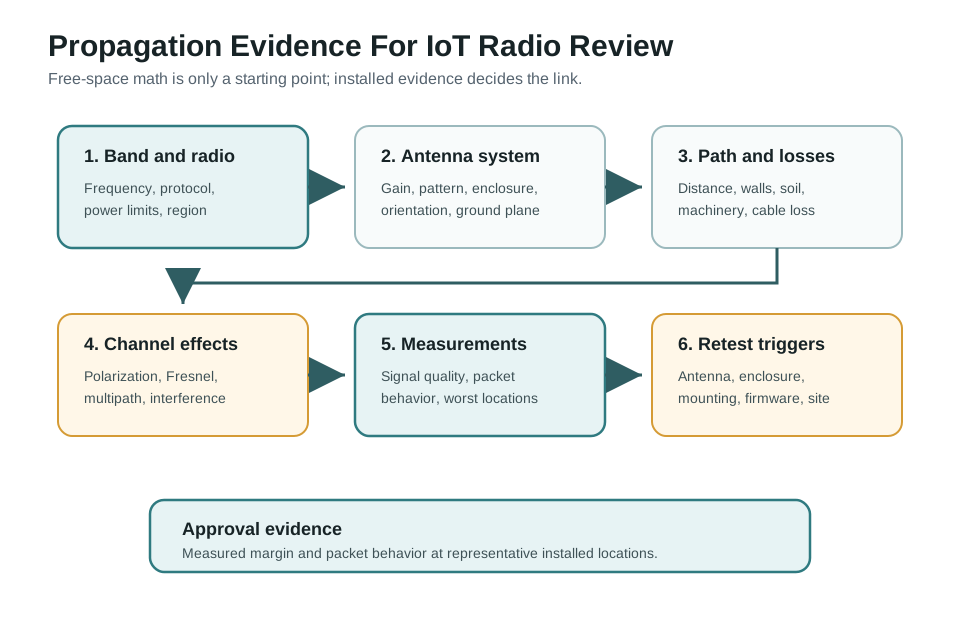
Use Figure 4.2 when a design answer relies on simple range rules. The evidence record should include the band, antenna, enclosure, path, obstacles, polarization, interference, measurements, and retest triggers.
4.12 Polarization, Fresnel Zone, And Multipath
Polarization describes the orientation of the electric field. A vertically polarized antenna and a horizontally polarized antenna may not couple efficiently. If device orientation changes in use, the review should not assume ideal alignment.
The Fresnel zone is the volume around the line-of-sight path that radio energy occupies. A path can look visually clear but still lose margin if terrain, shelving, vehicles, trees, or building edges intrude into the Fresnel zone.
Multipath occurs when signals arrive by multiple reflected paths. It can help or hurt depending on timing, antenna placement, frequency, and receiver behavior. Indoor and industrial environments often need field measurements because reflections and shadowing are hard to predict from a diagram.
4.13 Radio Versus Optical Links
Visible light and infrared are also electromagnetic waves. They can carry data, and they may be useful when the design wants room-confined communication, line-of-sight control, or reduced RF leakage. However, they are usually blocked by walls and opaque objects. That makes them unsuitable for many general-purpose sensors but useful in deliberate optical designs.
The review should ask whether the communication path must work through obstacles, around corners, or through enclosures. If yes, radio is usually the starting point. If no, optical or infrared options may be viable.
4.14 Worked Review: Door Sensor Band Claim
Prompt: “Use the highest-frequency Wi-Fi band because it has more bandwidth.”
Review path:
- Identify the payload size, reporting interval, sleep behavior, and battery target.
- Check whether the payload needs high throughput or only a small status update.
- Compare path loss and wall loss for candidate bands at the installed locations.
- Check antenna size, enclosure effect, association overhead, and retry behavior.
- Measure signal quality and packet success from representative doors, not only near the access point.
- Select the band that satisfies margin, reliability, and energy evidence.
Accepted answer: “High bandwidth does not prove a good sensor link. The chosen band must match payload, energy, coverage, and installed-location evidence.”
4.15 Worked Review: Outdoor Sensor Link
Prompt: “The devices have line of sight, so the link budget is solved.”
Review path:
- Confirm distance, antenna height, frequency band, transmit power, antenna gain, and receiver sensitivity.
- Check Fresnel-zone clearance, not just visual line of sight.
- Include expected obstruction, vegetation, weather, mounting, cable, and polarization losses.
- Measure received signal and packet behavior at representative times and positions.
- Record fade margin and retest triggers after antenna, enclosure, mounting, firmware, or site changes.
Accepted answer: “Line of sight is useful evidence, but a review-ready outdoor link also needs Fresnel, antenna, loss, measurement, and retest evidence.”
4.16 Common Mistakes
- treating a protocol name as proof of RF range
- assuming higher frequency is better because it has more bandwidth
- using free-space path loss as if walls, floors, bodies, or machinery do not exist
- quoting antenna length from the wave equation without checking enclosure detuning
- mixing dBm, dBi, dB, watts, and milliwatts in one calculation
- ignoring polarization and device orientation
- treating visual line of sight as the same thing as Fresnel clearance
- accepting a range claim without field measurements from the intended installation
4.17 Knowledge Check: Wave Fundamentals
4.18 Match The RF Term To The Review Evidence
4.19 Order The RF Fundamentals Review
4.20 Review Checklist
Before approving an EM-wave or spectrum claim, confirm that the record includes:
- frequency band, regulatory region, and selected radio technology
- practical wavelength and antenna implications
- antenna type, enclosure, ground-plane, and orientation evidence
- path-loss assumptions and real obstruction losses
- polarization, Fresnel, multipath, and interference considerations
- measured signal quality from representative locations
- receiver sensitivity, transmit-power limits, and link margin
- retest triggers after antenna, enclosure, mounting, firmware, or site changes
4.21 Frequency Sets Wavelength, Antenna Size, and Range
Every wireless choice starts with one equation: λ = c / f, where c is the speed of light. Wavelength λ decides how big an efficient antenna must be and how the signal travels. At 2.4 GHz, λ ≈ 12.5 cm; at 5 GHz, ~6 cm; at a sub-GHz cellular band like 900 MHz, ~33 cm.
That single relationship drives a recurring trade-off. Higher frequencies (5 and 6 GHz Wi-Fi) allow tiny antennas and wide channels but lose energy faster and penetrate walls poorly. Lower frequencies (700–900 MHz cellular, sub-GHz IoT) need bigger antennas but travel farther and bend around obstacles — which is why carriers use low bands for coverage and high bands for capacity.
Worked scale check. Compare a 900 MHz meter radio with a 2.4 GHz sensor at the same distance. The wavelength changes from about 33 cm to 12.5 cm, so a quarter-wave radiator changes from roughly 8.3 cm to 3.1 cm. The smaller antenna is attractive for packaging, but the free-space frequency penalty is 20 log10(2400/900) ≈ 8.5 dB. If the lower-frequency link had 14 dB of measured fade margin before a door closed, the higher-frequency design can spend most of that margin before accounting for wall loss, body shadowing, antenna detuning, or interference. 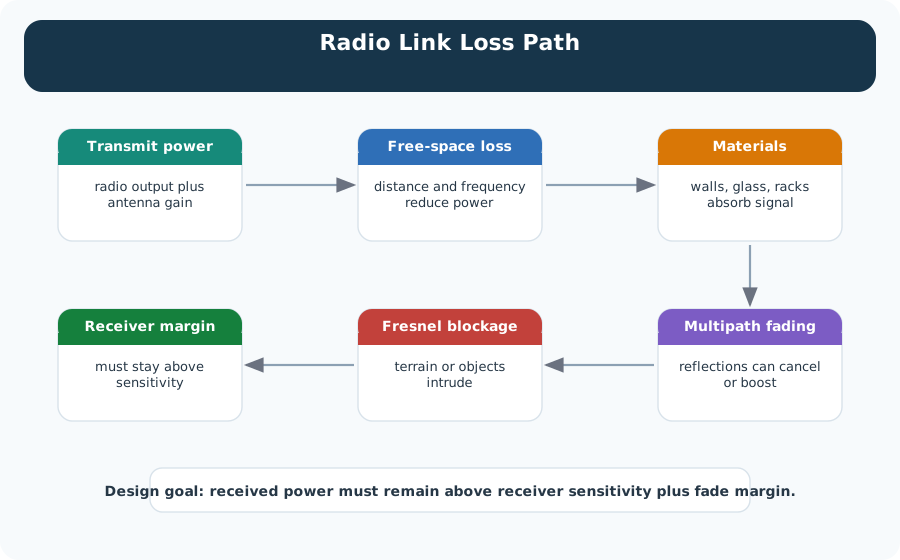
This is why a review should not stop at “the device supports 2.4 GHz” or “sub-GHz reaches farther.” A defensible claim names the band, calculates the rough wavelength and path-loss implication, then checks the installed antenna. A plastic enclosure may change the result only a little; a battery, metal bracket, water-filled product, or human hand can move the antenna match enough to turn a passing lab link into a marginal field link. Frequency gives the first-order expectation; measurement confirms whether the final product still has margin.
One sentence: low frequency = big antenna, long reach; high frequency = small antenna, short reach, fat pipe. Wavelength is the lever behind both.
4.21.1 Overview Knowledge Check
4.22 Antenna Sizing and Gain in dBi
An efficient antenna is sized to the wavelength. A half-wave dipole is λ/2; a quarter-wave monopole is λ/4. That is why a 900 MHz whip is physically large while a 2.4 GHz chip antenna fits on a fingernail.
| Band | λ | ½-wave dipole | ¼-wave monopole |
|---|---|---|---|
| 900 MHz | 33 cm | 16.7 cm | 8.3 cm |
| 2.4 GHz | 12.5 cm | 6.2 cm | 3.1 cm |
| 5 GHz | 6.0 cm | 3.0 cm | 1.5 cm |
| 6 GHz | 5.0 cm | 2.5 cm | 1.2 cm |
Antenna gain is quoted in dBi (decibels over an ideal isotropic radiator). Gain is not amplification — it is focus: a higher-gain antenna concentrates energy into a narrower beam. A simple dipole is about 2.15 dBi. The regulator caps EIRP = transmit power + antenna gain, so adding antenna gain may force you to reduce conducted power to stay legal.
Worked example. A design must shrink its antenna by moving from 900 MHz to 2.4 GHz. The quarter-wave monopole drops from 8.2 cm to 3.1 cm — great for a small enclosure — but the same 2.4 GHz link now suffers more path loss and weaker wall penetration, so coverage per node falls. The antenna got smaller; the RF job got harder.
A review-ready antenna decision also includes the installation geometry. A quarter-wave monopole needs an effective counterpoise; a PCB inverted-F antenna needs keep-out space; a chip antenna needs the matching network and ground layout assumed by its reference design. Rotating a wall sensor by 90 degrees can change polarization alignment with the gateway. Moving the same board from an open bench to a sealed box near a lithium cell or metal bracket can shift resonance, reduce efficiency, and alter the radiation pattern. Those effects are not visible in the frequency equation, but they are often visible in RSSI, packet error rate, return loss, or antenna efficiency measurements.
Use the arithmetic as a sanity check, then ask for evidence. If a 2.4 GHz enclosure prototype shows 10 dB less link margin than the bare evaluation board, the next action is not to rewrite the range claim; it is to inspect antenna clearance, matching, orientation, cable loss, and nearby materials. If the product cannot afford a longer antenna, the system may need a closer gateway, a lower-rate modulation with better sensitivity, a different band, or a changed mechanical layout.
4.22.1 Practitioner Knowledge Check
4.23 Why 5 GHz Costs ~6.4 dB Versus 2.4 GHz
Free-space path loss grows with the square of frequency: FSPL(dB) = 20 log₁₀d + 20 log₁₀f + 32.44 (with d in km and f in MHz). Hold distance fixed and change only frequency, and the penalty for going from 2.4 GHz to 5 GHz is 20 log₁₀(5000/2400) ≈ 6.4 dB; to 6 GHz it is ~8 dB. A 6 dB loss is a factor of four in power — roughly halving the range for the same link budget, before you even count worse wall penetration at higher bands.
Two more effects matter close to the antenna and across obstacles. Antenna measurements are only valid in the far field, beyond roughly 2D²/λ (D = antenna size); nearer than that, coupling and metal detune the pattern. And polarization must match: a vertically polarized transmitter into a horizontally polarized receiver can lose 20 dB or more to cross-polarization.
Worked example. A dual-band gateway shows solid 2.4 GHz coverage but patchy 5 GHz coverage in the same building. Nothing is broken: the ~6.4 dB extra free-space loss plus higher wall attenuation at 5 GHz simply shrink the 5 GHz cell. The fix is architectural — more or closer 5 GHz access points — not more transmit power, which regulators cap by EIRP anyway.
The same math helps when judging measurement reports. A received-power sample of -72 dBm is not meaningful by itself; compare it with receiver sensitivity, required modulation, packet error rate, and fade margin. If the receiver needs -92 dBm for the selected PHY, the nominal margin is 20 dB before obstruction and fading allowances. If a closed metal door or water-filled container adds 12 dB of shadowing, only 8 dB remains. If polarization mismatch or a poor antenna match spends another 6 dB, the link is nearly out of margin even though the free-space estimate looked comfortable.
A strong under-the-hood review therefore keeps all terms in dB until the end: transmit power, antenna gains, cable losses, path loss, obstruction allowance, receiver sensitivity, and required fade margin. It also separates model evidence from field evidence. The equation explains why the candidate band is plausible; the installed measurement proves whether the actual channel, antenna, enclosure, and interference environment are acceptable.
| Check | Arithmetic carried through | Result to use in the review |
|---|---|---|
| 900 MHz wavelength | 30 cm/GHz / 0.9 GHz = 33.333... cm |
About 33.3 cm, so a quarter-wave element is 33.333... / 4 = 8.333... cm. |
| 2.4 GHz wavelength | 30 cm/GHz / 2.4 GHz = 12.5 cm |
Quarter-wave is 12.5 / 4 = 3.125 cm, matching the small-antenna packaging claim. |
| Same-distance frequency penalty | 20 log10(2400 / 900) = 8.519... dB |
A 14 dB lower-band fade margin becomes 14 - 8.519... = 5.480... dB before walls, hands, detuning, or interference. |
| 5 GHz versus 2.4 GHz | 20 log10(5000 / 2400) = 6.375... dB |
Round at the end: about 6.4 dB, or 10^(6.375... / 10) = 4.34x power ratio. |
| 6 GHz versus 2.4 GHz | 20 log10(6000 / 2400) = 7.959... dB |
About 8.0 dB, which is why 6 GHz coverage needs more careful cell planning. |
| Installed margin example | -72 - (-92) = 20 dB; 20 - 12 = 8 dB; 8 - 6 = 2 dB |
After obstruction and mismatch allowances, only 2 dB remains. That is nearly out of margin. |
The audit does not approve a band by itself. It shows which numbers must survive the field measurement: antenna fit, EIRP limit, obstruction allowance, sensitivity, packet success, and retest triggers all have to leave enough margin after the arithmetic is done.
4.23.1 Under-the-Hood Knowledge Check
4.24 Summary
Electromagnetic-wave fundamentals connect wireless physics to IoT design decisions. Frequency and wavelength determine antenna scale and influence path loss. Free-space calculations are useful early checks, but field measurements, enclosure effects, polarization, Fresnel clearance, multipath, and interference determine whether the installed system works. A strong RF review documents the band, antenna, path assumptions, measured evidence, and retest plan.
4.25 Key Takeaway
EM Waves and Spectrum Basics should tie mobile wireless fundamentals to spectrum, propagation, link budget, coverage planning, licensing, power, and deployment evidence.
4.26 Concept Relationships
- Frequency bands and licensing explain which radio bands a device is allowed to use.
- Cellular spectrum applies the same wave fundamentals to licensed operator bands.
- Propagation design turns the basic wave relationship into link budget and coverage evidence.
- Wi-Fi, BLE, Zigbee, Thread, and LoRaWAN make different trade-offs using different bands and PHY designs.
- Antenna and enclosure design decide whether the theoretical band choice survives the final product.
4.27 What’s Next
- IoT Frequency Bands and Licensing connects wave behavior to band rules and regulatory constraints.
- Cellular Spectrum for IoT applies spectrum thinking to licensed cellular IoT services.
- Propagation and Design extends these fundamentals into coverage, path loss, interference, and placement review.
- Wi-Fi Fundamentals explores how Wi-Fi uses 2.4 GHz, 5 GHz, and newer bands.
- Mobile Wireless Comprehensive Review reviews the wider mobile-wireless design space.